http://www.sciencepublishinggroup.com/j/ijecec doi: 10.11648/j.ijecec.20190502.11
ISSN: 2469-8040 (Print); ISSN: 2469-8059 (Online)
High-voltage Pulse Generation Using Electrostatic
Induction in Capacitor
Taku Saiki
Department of Electrical and Electronic Engineering, Faculty of Engineering Science, Kansai University, Suita, Japan
Email address:
To cite this article:
Taku Saiki. High-voltage Pulse Generation Using Electrostatic Induction in Capacitor. International Journal of Electrical Components and Energy Conversion. Vol. 5, No. 2, 2019, pp. 20-29. doi: 10.11648/j.ijecec.20190502.11
Received: October 19, 2019; Accepted: November 18, 2019; Published: November 22, 2019
Abstract:
Pulse power sources can produce high temperature or high-density extreme conditions within a short time. They have been introduced to various fields such as those in laser, fusion research, the production of plasma, shockwaves in water, water treatment, and exhaust gas treatments. Various high voltage pulse sources using insulated-gate bipolar transistor (IGBT) semiconductors with high voltage resistivity have been used. Also, Marx bank circuit is well known as an instrument that produces voltage pulses with low repetitive rates. These instruments have several advantages. However, their problems are a complex structure, high cost, and excessive weight. A simple method of producing high voltage pulses with short rising times based on electrostatic induction in external capacitor used for pulse power applications is proposed. The circuit has a simple structure and contains a minimum number of parts, which makes the instrument small and light weight. In fact, the generation of sawtoothed high voltage pulses with short rising times and low repetitive rates of a few 100 Hz was successfully conducted in experiments. Theoretical analysis was simultaneously undertaken. The numerically calculated results for generating high voltage pulses were goodly consistent with the experimental ones. Moreover, it has been confirmed that amplification of the output voltage by electro-hydrodynamics (EHD) electricity generation using a jet flame resulted in higher voltage pulses, lower electricity consumption, and high repetition rates.Keywords:
High Voltage Pulses, EHD Power Generation, Flame Jet, Electrostatic Induction1. Introduction
Pulse power sources, which can produce high temperature or high-density extreme conditions by releasing electric or magnetic energy stored in coils or capacitors within a short time, have been introduced to various fields such as those in laser [1], fusion research [2], the production of plasma, shockwaves in water, water treatment, and exhaust gas treatments [3-13].
Various pulse power sources have now been developed due to the expanding fields of application [3-19]. The required conditions for pulse power sources differ according to applications. The required parameters for the pulse power sources of individual applications are high voltage, high current, voltage or current pulses with short rise times, large averaged output power, and high repetitive rates.
The generation of pulses using discharge switches typified by a conventional gap switch has been continuously researched [6, 19]. Also, various high voltage pulse sources
using insulated-gate bipolar transistor (IGBT) semiconductors with high voltage resistivity have been used as alternative switches [15-16]. The Marx bank circuit is well known as an instrument that produces voltage pulses with low repetitive rates [6]. These instruments or electrical circuits have several advantages. However, their three main problems are: 1) a complex structure, 2) high cost, and 3) excessive weight, which is very hard to reduce.
This paper proposes a new method of easily producing sawtoothed high voltage pulses with short rising times and low repetitive rates based on electrostatic induction in the external capacitor.
added to them. In this method, unlike the conventional one, the load is electrically discontinuous, and substantially less direct current is used for charging from the power supply. A large difference in operation occurs, and the electric energy is repeatedly charged in the capacitor indirectly through electrostatic induction using a high voltage power supply.
The proposed circuit has a simple structure and no moving parts. Thus, the instrument can be small, light weight, and have a long lifetime. In addition, an experiment on high voltage pulses that were amplified due to EHD power generation using a jet flame was also carried out to find whether the electric power of the power source was reduced.
2. Principle for Generation of High Voltage Pulses
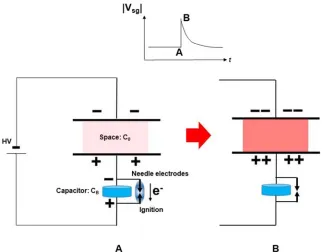
Figure 1. Principle underlying generation of high voltage in space sandwiched by electrodes. Vsg: Voltage of the capacitor that consists of space and the two electrodes.
The principle underlying the generation of high voltage pulses by charging and discharging external capacitors is outlined below. The space between two electrodes can be seen as a capacitor with a capacitance of C0 and an external capacitor with a capacitance
of CB, as shown in Figure 1. Here, CB is much larger than C0. We
have called the external capacitor a boosting capacitor below. Here, the space between the electrodes is assumed to be filled with gas such as air or low pressure gas. A boosting capacitor is connected in series with the capacitor that consists of the space and electrodes. The capacitors connected in series are connected to a high voltage power supply. The boosting capacitor has needle-needle electrodes. When a high voltage is added to this circuit once, the boosting capacitor is charged to a high voltage due to electrostatic induction by HV supply. The voltage of the boosting capacitor reaches the threshold voltage of the needle-needle electrodes for discharge, which occurs between the electrodes that shorten, and negative charge flows out of the boosting capacitor (Figure 1A). It means that positive charge flows to the below electrode of the capacitor which consists of space and two electrodes. A large current flows between electrodes within a short time. If the discharge has negligible energy loss, all the stored electrical energy in the boosting capacitor migrates to the capacitor, which consists of space and two electrodes. A very high voltage is generated in the capacitor,
which consists of space and the two electrodes (Figure 1B). This is because the series connected capacitors are recognized as a single capacitor with variable capacitance. The boosting capacitor is ignored by the shortening of the needle-needle electrodes when discharge occurs.
After discharging in needle-needle electrodes, the moved and stored positive charges at the below electrode of the capacitor consisting of a space and two electrodes remain because the electrical connection is cut.
The boosting capacitor re-charges using the electrostatic induction in the boosting capacitor. I call the device a boosting capacitor because, when charged, it releases the electrical power repeatedly and enhances the density of the positive charges in the lower electrode of the space gap. Also, the boosting capacitor can be considered a pulse current source in principle.
the effective capacitance decreases.
The stored electrical energy of the capacitor that consists of space and the two electrodes is explained next.
= ∙ ∙ (1)
Here, V0 is the voltage that is added to the capacitor that
consists of space and the two electrodes.
Also, the equation for the stored electrical energy of the boosting capacitor is:
= ∙ ∙ (2)
Here, VB is the voltage to the boosting capacitor when
discharge occurs. After discharge has occurred, all the stored electrical energy in the boosting capacitor migrates to the capacitor that consists of space and the two
electrodes.
The new electrical energy of the capacitor that consists of space and the two electrodes is next changed as:
′= (3) Thus, the equation for V0' after discharge is:
= ∙
(4)
The stored charge in the boosting capacitor by the move of discharge to the capacitor consists of space and the two electrodes. After that, the moved charges slowly disappear. The equation for the increment of the stored charge at the positive electrode is:
∆ ∙ ∙ ∙ ∙ (5)
Here, Q0 >0. This ∆Q0 is newly stored in the capacitor that
consists of space and the two electrodes for each discharge.
∆Q0(t0) is the supplied charge at discharge, and Q0 is
calculated by:
∆ ∙ ( ) ! (6)
where t0 is when discharge occurs. The equation for the
current that flows out of the capacitor is:
! "#
p
= ∙
"
(7)
where Rp is the internal resistance of the capacitor. The
equations from (1) to (8) were converted to differential equations, and the charge, voltage, and currents of the capacitor were calculated.
The equation for the repetition time is:
$ ∝ ∙" ∙#&
"'() (8)
Here, Rs is the charging resistance, and VOCW is the output
voltage of the rectification circuit. The time depends on CB, VB, Rs, and Vocw.
3. Method for Experiment
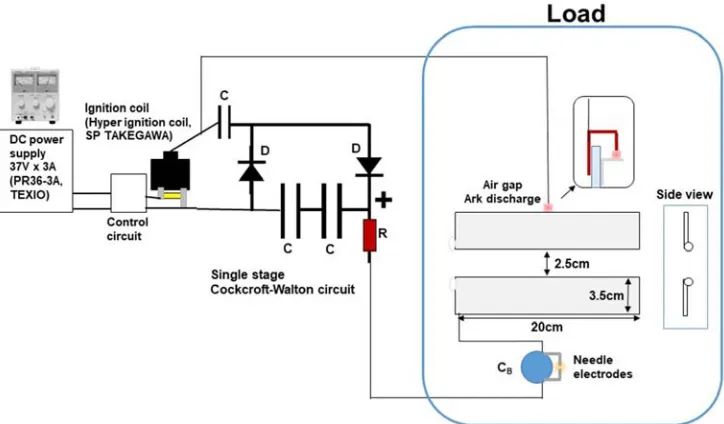
Figure 2. Experimental setup for generating high voltage pulses.
CB: boosting capacitor, D: high voltage withstanding diode
The experimental setup for generating high voltage pulses is outlined in Figure 2. Two capacitors (capacitance of 100 pF (TDK, Japan), withstanding voltage of 3 kV, distance of 4 mm between needle electrodes, capacitance of 1000 pF (Murata Manufacturing, Japan), withstanding voltage of 16 kV, and a distance of 2 mm between needle electrodes) were used in the experiment as the boosting capacitors. Two diodes (Fuji Denki Systems, Japan, with a withstanding voltage of 12 kV) connected in series were used. A DC power source (36V ×3A, PR36-3A, TEXIO, Japan) was also used. A high voltage generator (a harmonic power source using an ignition coil with a frequency of 20 kHz and a maximum output voltage of 5 kV) was connected to the DC power source. The high voltage generator was connected to a single-stage Cockcroft-Walton (CW) circuit (a double voltage rectifier circuit), as outlined in Figure 1. The output was chosen on the plus electrode side of the double voltage rectifier circuit. High voltage enamel resistance with a length of 4.8 cm and resistance of 18 kohm was connected to the plus output side of the rectifier circuit to monitor the currents.
The load consisted of two aluminum plates (the capacitor consisted of space and the two electrodes. The thickness of both Al plates was 0.5 mm was used, as indicated on the right of Figure 2. The two aluminum plates were placed vertically. The size of both Al plates were 3.5× 20 cm. Their edges were rounded with a diameter of 3 mm. The top of the Al plate had a needle electrode with a 1 mm gap to the Al plate. Here, an arc discharge at the needle electrode by increasing the output voltage of the rectifier circuit to enhance the output voltage was generated. The arc discharge has less of a relationship to the characteristic of pulse voltage generation, and we can ignore it as if it is a conduction line.
Here, the circuit point, at which the output of the high voltage power generator and the input of the rectifier circuit were connected, as shown in Figure 2, was connected to the load as an output. The bottom Al plate was connected to the positive output of the rectifier circuit via the boosting capacitor.
A high voltage probe (HV-60, Sanwa, Japan), an oscilloscope (TDS-2012, Textronics, Japan), and a tester (CD731a, Sanwa, Japan) were used for measuring the voltage waveform and the average voltage was added to the load, current. The waveform of the output voltage was pulse when the load was not connected because AC and DC voltage were mixed. When the load and the boosting capacitor were connected to the rectifier circuit, arc discharge occurred at the needle gap and the load current increased, which resulted in degrading the output voltage of the DC power source and the occurrence of relaxed self-excited oscillation.
4. Results and Discussion
An experiment to generate high voltage pulses was conducted by using the instrument outlined in Figure 2. The
results are provided in Figures 3 and 4.
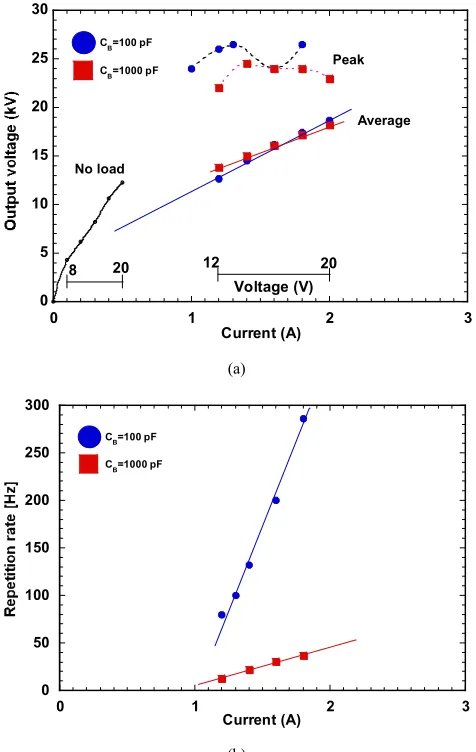
The measured voltage added to the load and current are given in Figure 3 (a). The output voltage of the rectifier circuit was proportionally changed to the output voltage or current of the DC power source when no arc discharge was generated at the needle gap. A maximum average output voltage of 12.5 kW was obtained for an output voltage of 20 V and an output current of 0.5 A. The load current increased and the output voltage of DC power supply degraded when arc discharge at the needle gap was generated and CB =100
pF was used. Average output voltages of 12 kV and 19 kV were obtained for the output currents of 1.2 and 2.0 A, as shown in Figure 3 (a). An output peak voltage of around 26 kV was obtained.
The load current increased, and the output voltage of the DC power supply degraded when arc discharge was generated at the needle gap and CB =1000 pF was used.
Average output voltages of 13 and 18 kV were obtained for the output currents of 1.2 and 2.0 A, as shown in Figure 3 (a). An output peak voltage of around 25 kV was obtained. The repetition rates obtained from the oscilloscope are plotted in Figures 3 (a and b).
The repetition rate changed from 80 and to 290 Hz for the output currents of 1.2 and 2.0 A when CB =100 pF was used, as
shown in Figure 3 (b), whereas the repetition rate changed from 10 and to 40 Hz for the output currents of 1.2 and 2.0 A when CB =1000 pF was used, as shown in Figure 3 (b), due to
the increasing charge time of the boosting capacitor.
The waveforms of applied voltage to the load obtained by oscilloscope at CB = 100 pF and without arc discharge are
given in Figure 5, where the 20 kHz AC component appeared in the waveform. Sawtoothed high voltage pulses applied to the load with the repetition rate of 7.1Hz were observed. The voltage increments applied to the load within a short time were 6 kV when discharge occurred at the needle electrodes of the boosting capacitor. After that, the voltages applied to the load slowly decreased due to outflowing stored charges.
The waveforms of applied voltage to the load obtained by oscilloscope at CB = 100 pF and with arc discharge are
provided in Figure 6. Also, sawtoothed high voltage pulses applied to the load with a repetition rate of 290 Hz were observed, where the output current increased to 1.8 A and blocking oscillation was observed after arc discharge was generated. The voltage increment applied to the load within a short time was 4 kV when discharge occurred at the needle electrodes of the boosting capacitor.
The waveforms of the applied voltage to the load obtained by oscilloscope at CB = 1000 pF and with arc
changing the space gap of the load. However, there was less change in the average or peak voltage applied to the load and the repetitive rate was observed in an experiment.
The waveform of the rise voltage applied to the load at
CB =100 pF is shown in Figure 8. It was found that the rise
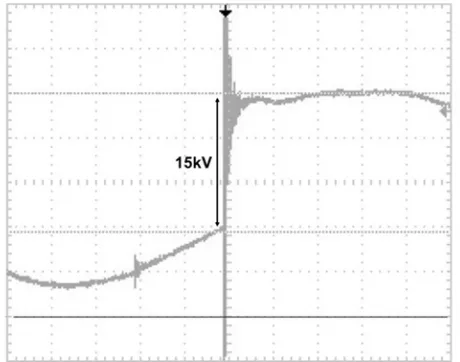
time was a few tens of nanoseconds. The waveform then indicated an oscillation due to the inductance component. Here, the increment of voltage was 6 kV. The waveform of the rise voltage applied to the load observed by using a spherical electrode gap at CB =1000 pF is given in Figure 9.
We found that the rise time was the same, and the waveform indicated an oscillation due to the inductance component. Here, the increment of voltage was 15 kV.
The waveform of current at CB =100 pF is indicated in
Figure 10, as an example. This was because the waveform of the output voltage was a pulse, and the current flowed asymmetrically. A larger current flowed when the voltage was high. A pulse current simultaneously flowed in the load at the discharge of the needle electrode gap. The current was evaluated to be 22 mA, which was determined from the voltage of 400 V at the waveform, as shown in Figure 9. The duration of the discharge pulse was evaluated to be 3.3 µs.
(a)
(b)
Figure 3. Properties of added voltage and current applied to load. (a) Average and peak voltage applied to load and (b) repetition rate.
Figure 4. Measured average output current for rectification circuit. Source current was changed from 1.2 to 2.0 A for CB =100 pF, and average output current for rectification circuit was changed from 0.1 to 0.21 mA. Average output current increased by 20 times compared to when there was no load.
Figure 5. Waveforms of applied voltage to load. Without arc discharge, current: 0.4 A, repetition rate: 7.1 Hz, CB =100 pF, 5 kV/div., and 50 ms/div.
Figure 6. Waveforms of applied voltage to load. Current: 1.8 A, repetition rate: 290 Hz, 5 kV/div, and 50 ms/div.
0 5 10 15 20 25 30
0 1 2 3
Current (A)
12 20
CB=100 pF
CB=1000 pF
No load
Peak
Average
20 8
Voltage (V)
0 50 100 150 200 250 300
0 1 2 3
Current (A)
CB=100 pF
C
B=1000 pF
0 0.1 0.2 0.3
0 1 2 3
Current (A)
With ark
Without ark
12 20
20 8
Figure 7. Waveforms of applied voltage to load. Current: 2.0 A, repetition rate: 33 Hz, 5 kV/div, and 10 ms/div.
Figure 8. Waveform of applied voltage to load: CB=100 pF, 5 kV/div, and 1
µs /div.
Figure 9. Waveform of applied voltage to load: as an example, 1000 pF, sphere gap electrode: 2 mm gap (discharge voltage: 6 kV), 5 kV/div, and 2.5 µs/div.
Figure 10. Waveform of current: as an example, output current of DC power source: 1.2 A, 5 kV/div, and 25 µs/div.
The numerically calculated waveform of the voltage applied to the load, as an example, is shown in Figure 11. Equations (5) to (7) were used for calculating the voltage applied to the load and current and charge, where the repetition rate is 100 Hz for the calculation parameter. The VB
is 4 kV, C0 is 10 pF, CB is 100 pF, Vini is 10kV, and Rp is 200
Mohm. The time mesh was set to 10 µs. The calculated results in Figure 11 are the sawtooth waveforms and are consistent with the results in Figures 5-10. It was found that the output currents that flowed out of the load were 6.5 mA at peak and there was a weak current of below 0.1 mA at the charging boosting capacitor.
Figure 11. Numerically calculated waveform of voltage applied to load, as an example.
The calculated and measured raised voltage of the pulse during discharge for VBis shown in Figure 12. Equations (1) to (4) were
shown in Figure 12 (a). However, the experimental results are not consistent with the numerically calculated ones at CB =1000 pF, as
shown in Figure 12 (b). The measured VB reduced from the
calculated ones at η=1.0. Because the experimental results between using the needle electrode gap and using the spherical electrode gap were almost the same, we expected this to be due to a reduction in capacitance in the ceramic capacitor at high voltage because of material properties. The measured VB was close to the
calculated one at η=0.5. It was found that the stored electrical energy of 0.8 mJ completely migrated to the load at CB =100 pF.
The raised voltage of the pulse during discharge for CB are
plotted in Figure 13. Equations (1) to (4) were also used for calculating the voltage applied to the load. It was recognized that the charges in the load depended on the initial voltage, Vini, that was
applied to the load. If C0 =10 pF, CB =100 pF, CB =4 kV, and Vini is
0 kV, the boosting capacitor has 32% of the charge stored in the load. If Vini is 10 kV, only 15% of the charge is stored in the load.
The DC component of the output voltage for the rectification circuit must remain low with increasing repetition rate.
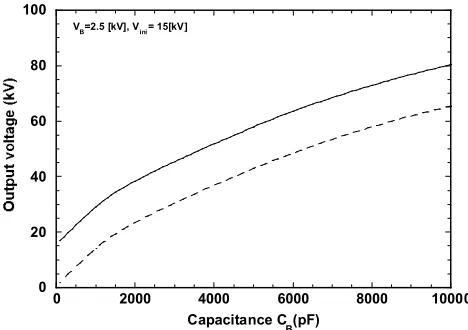
The numerically calculated results for the raised voltage of the pulse during discharge are plotted in Figure 14, where CB =2.5 kV
and Vini=15 kV. When capacitance increased, the raised voltage of
the pulse became saturated. It has been recognized that we needed to use a capacitor with lower capacitance and high withstand voltage instead of using a capacitor with high capacitance.
(a)
(b)
Figure 12. Voltage applied to load and raised voltage of pulse during discharge for VB. (a) CB =100 pF and (b) CB =1000 pF. Red squares plot experimental results when spherical electrode gap was used, and blue squares plot experimental results when needle electrode gap was used.
Figure 13. Raised voltage of pulse during discharge for CB. CB =100 pF and C0 =10pF. Solid line plots calculated applied voltage to load. Blue squares plot experimental results when using needle electrode gap.
Figure 14. Applied voltage to load and raised voltage of pulse during discharge as function of CB. Solid line plots applied voltage to load. Dashed line plots raised voltage of pulse during discharge.
Flame jet EHD power generation [21] was used to enhance the output voltage and reduce consumption power. The structure of the load connected to a single-stage Cockcroft-Walton (CW) circuit was modified to the single Al electrode in Figure 15 to adapt the experiment using flame jet EHD power generation. The EHD power generator uses the following technique. Di-electric fluid or weakly ionized plasma is used for an alternative in the belt to move the electrons. The fluid absorbs some of them. The electrons are accelerated in the fluid. As a result, an effective new high voltage power supply is created, and additional connects are enabled except for the high voltage power source. The negative charges are collected at the front of the flame. A high voltage is generated between the front of the flame and the positive electrode. A negative needle electrode was used for the load, and the flame coming out from a butane burner (flame length: 5 cm) was closed, as shown in Figure 15. The direction of the needle electrode is parallel to the bottom Al plate electrode.
0 10 20 30 40 50 60
0 1 2 3 4 5 6
VB (kV)
V VV V out outout out Δ Δ Δ ΔV, η=1. 0η=1. 0η=1. 0η=1. 0
0 10 20 30 40 50 60
0 1 2 3 4 5 6
V B (kV)
η=0.5 η=0.5 η=0.5 η=0.5 V V V V out outout out Δ Δ Δ ΔV, η=1.0η=1.0η=1.0η=1.0
0 5 10 15 20
0 5 10 15 20
Vini (kV)
VB = 2 (kV)
VB = 4 (kV)
VB = 6 (kV)
0 20 40 60 80 100
0 2000 4000 6000 8000 10000
Capacitance C
B(pF)
V
Figure 15. Load using flame jet EHD power generation.
(a)
(b)
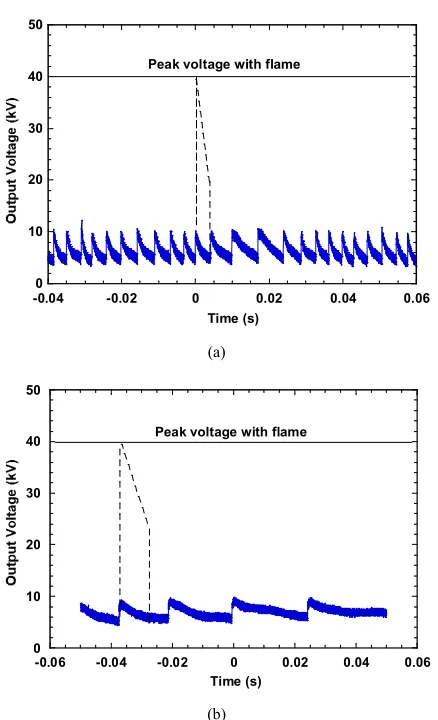
Figure 16. Applied voltage to load. (a) CB =100 pF, current of power source: 0.5 A, and repetition rate: 130 Hz, (b) CB =1000 pF, current of power source: 0.5 A, and repetition rate: 250 Hz.
(a)
(b)
0 10 20 30 40 50
-0.04 -0.02 0 0.02 0.04 0.06
Time (s) Peak voltage with flame
0 10 20 30 40 50
-0.06 -0.04 -0.02 0 0.02 0.04 0.06
(c)
Figure 17. Properties of circuit. (a) repetition rate, (b) average current: CB =100 pF, and (c) average current: CB =1000 pF.
The distance between the needle electrode and Al electrode was set to 3.0 cm. When CB =100 pF, the repetition rate was
remarkably increased from 17 Hz to 250 Hz and a corona discharge from the Al plate electrode was observed. The generated voltage between the flame and the Al plate electrode of the load was estimated to be 40 kV, which was estimated from the corona discharge length of 1.5 cm. A maximum amplified voltage of 40 kV was also prospected
from the prevous experiment [20].
The measured voltage applied between electrodes is plotted in Figures 16 (a) and (b). The output current of the DC power source was 0.5 A at CB =100 pF, and the repetition rate
increased to 250 Hz. The average voltage between electrodes was 7 kV. The output current of the DC power source was 0.5 A at CB =1000 pF, and the repetition rate increased to 130 Hz.
The average voltage between electrodes was 6 kV.
The repetition rate for the output current of the DC power source is plotted in Figure 17 (a). The repetition rate at CB =100
pF changed to a few Hz and 20 Hz for each output current of 0.3 and 0.5A when the flame jet was not used. The repetition rate increased to 200 and 250 Hz for each output current of 0.3 and 0.5A when the flame jet was used. The repetition rate at CB
=1000 pF changed to 1.4 and 2.6 Hz for each output current of 0.3 and 0.5A when the flame jet was used. The repetition rate also increased to 16 and 130 Hz for each output current of 0.3 and 0.5A when the flame jet was used.
The measured average output current for the rectification circuit is shown in Figures 17 (b) and (c). The output current of the DC power source at CB =100 pF is 0.5A, and the average
output current increased to 0.32 mA. The output current of the DC power source is 0.5A at CB =1000 pF, and the average output
current increased to 0.28 mA.
The results obtained from the experiments are summarized in Table 1.
Table 1. Comparisons of high voltage pulses being generated using relaxed self-excited oscillation and that using flame jet EHD power generation.
Output power of supply (W) Total output power applied to load (W) Power from boosting capacitor to load (W) Using only relaxed
self-excited oscillation 40 4 0.2
Using flame jet EHD power
generation 10 (only rectification circuit) 9 (with flame) 5 (0.3 only rectification circuit)
This method easily produced high voltage pulses from a DC power source. The limit of the repetition rate of the voltage pulse should be 1 kHz due to the use of the discharge gap. Part of the output electrical power for the rectification circuit migrated to the boosting capacitor, and the stored electrical energy was injected to the load with a different timing.
The average voltage added to the load was 7 kV when flame jet EHD power generation was used and the average current was 0.32 mA, where the consumption power was evaluated to be 2.1 W. The peak voltage of the load due to voltage amplification of the flame jet EHD increased to around 40 kV. This total consumption power at load was evaluated to be 9 W. When the CB was 100 pF, the stored electrical energy was
0.8mJ, the repetition rate was 250 Hz, and the transfer electrical energy from the boosting capacitor to the load was evaluated to be 0.2 W. When the CB was 1000 pF, the stored
electrical energy was 2.4 mJ, the repetition rate was 130 Hz, and the transfer electrical energy from the boosting capacitor to the load was evaluated to be 0.3 W. It was found that the transfer electrical power in both cases was almost the same. The voltage added to the load was multiplied by four times due to the voltage amplification of flame jet EHD, and the transfer electrical power to the load was amplified by 16 times the original power. Thus, the transferred electrical power was
finally increased to 5 W, which was the effect of the voltage amplification of flame jet EHD. The multiplication was remarkably significant.
The maximum power from the DC power supply was 10 W. However, we could not obtain adequate capabilities from the rectification circuit because the load was very small. If we had used load with high levels of current, the energy efficiency of the rectification circuit should have been improved. The three main contributions to improvements were: 1) using fewer variations in capacitance for the boosting capacitor, 2) using a flat capacitor with reduced weight, and 3) using a small flame source. Thus, using these would reduce the weight of the instrument.
5. Conclusion
power generation and a boosting capacitor with low consumption of electricity in the load. The power consumption was one order lower than that using normal relaxed self-excited oscillation, and the transferred electrical energy from the boosting capacitor to the load was multiplied to 5 W.
This research did not receive any specific grant from funding agencies in the public, commercial, or not-for-profit
sectors.
References
[1] C. K. Patel, “Continuous-Wave Laser Action on Vibrational-Rotational Transitions of CO2”. Physical Review, 136 (5A) (1964) A1187.
[2] M.K.Matzen, “Z Pinches as Intense X-ray Sources for
High-energy Density Physics Applications”, Physics of Plasmas, 4 (1997) 1519.
[3] H. Akiyama, S. Sakai, T. Sakugaw, and T. Namihira, “Environmental Applications of Repetitive Pulsed Power”, IEEE Trans. Dielectr. and Electr. Insulat., 14 (2007) 825. [4] B. Sun, M. Sato, “Use of a Pulsed High-voltage Discharge for
Removal of Organic Compounds in Aqueous Solution”, J. Phys. D: Appl. Phys., 32 (1999) 1908.
[5] J. S. Clements, M. Sato, R. H. Davis, “Preliminary Investigation of Prebreakdown Phenomena and Chemical Reactions using a Pulsed High-voltage Discharge in Water”, IEEE Trans. Ind. Appl., 23 (1987) 224.
[6] I. V. Lisitsyn, H. Nomiyama, S. Katsuki and H. Akiyama, “Thermal Processes in a Streamer Discharge in Water, ”IEEE Trans. Dielectr. Electr. Insulat., 6 (3), (1999) 351.
[7] M. Rezal, Dahaman Ishak, M. Sabri, “High Voltage Magnetic Pulse Generation using Capacitor Discharge Technique”, Alexandria Engineering Journal, 53 (2014) 803.
[8] T. Shao, G. S. Sun, P. Yan, S. C. Zhang, “Breakdown Phenomena in Nitrogen due to Repetitive Nanosecond-pulse”, IEEE Trans. Dielectr. Electr. Insul., 14 (2007) 813.
[9] E. L. Neau, “Environmental and Industrial Applications of Pulsed Power Systems”, IEEE Trans. Plasma Sci., 22 (1994) 2.
[10] F. Fukawa, N. Shimomura, T. Yano, “Application of Nanosecond Pulse Power to Ozone Production by Streamer Corona”, IEEE Trans. Plasma Sci., 36 (2008) 2592.
[11] F. Yan, B. Lin, C. Zhu, Y. Zhou, X. Liu, C. Guo, Q. Zou, “Experimental Investigation on Anthracite Coal Fragmentation by High-voltage Electrical Pulses in the Air Condition: Effect of Breakdown Voltage”, Fuel, 183 (2016) 583.
[12] S. Katsuki, H. Akiyama, A. Abou-Ghazala and K. H. Schoenbach, “Parallel Streamer Discharges Between Wire and Plane Electrodis in Water”, IEEE Trans. Dielectr. Electr. Inslat., 9 (2002) 498.
[13] M. Sato, T. Tokutake, T. Ohshima and A. T. Sugiarto, ” Aqueous Phenol Decomposition by Pulsed Discharges on the Water Surface“, IEEE Trans. Ind. Appl., 44, (2008) 1397. [14] H. Li, A. Lukanin, A. Tskhe, S. Sosnovskiy, “Multifunctional
Generator of High-voltage Microsecond Pulses”, J. of Electrostatics, 90 (2017) 74.
[15] T. Shao, et al., “Excitation of Atmospheric Pressure Uniform Dielectric Barrier Discharge using Repetitive Unipolar Nanosecond-pulse Generator”, IEEE Trans. Dielectr. Electr. Insul., 16 (2010) 1830.
[16] T. Shao, D. D. Zhang, Y. Yu, “A Compact Repetitive Unipolar Nanosecond-pulse Generator for Dielectric Barrier Discharge Application”, IEEE Trans. Plasma Sci., 38 (2010) 1651. [17] K. Yan, E. J. M. van Heesch, A. J. M. Pemen, P. A. H. J.
Huijbrechts, F. M. van Gompel, H. van Leuken, and Zdenek Matyáˇs, “A High-Voltage Pulse Generator for Corona Plasma Generation”, IEEE Trans. Ind. Appl., 38 (3) (2002) 866. [18] D. Wang, S. Okada, T. Matsumoto, T. Namihira and H.
Akiyama, “Pulsed Discharge Induced by Nanosecond Pulsed Power in Atmospheric Air”, IEEE Plasma Sci., 38, (2010) 2746.
[19] J.-D. Moon, “A Compact High-voltage Pulse Generator using a Rotary Airhole Sparkgap”, J. of Electrostatics, 65 (2007) 527. [20] R. A. Ford, Home Made Lightning, McGraw-Hill, New York,
2002.