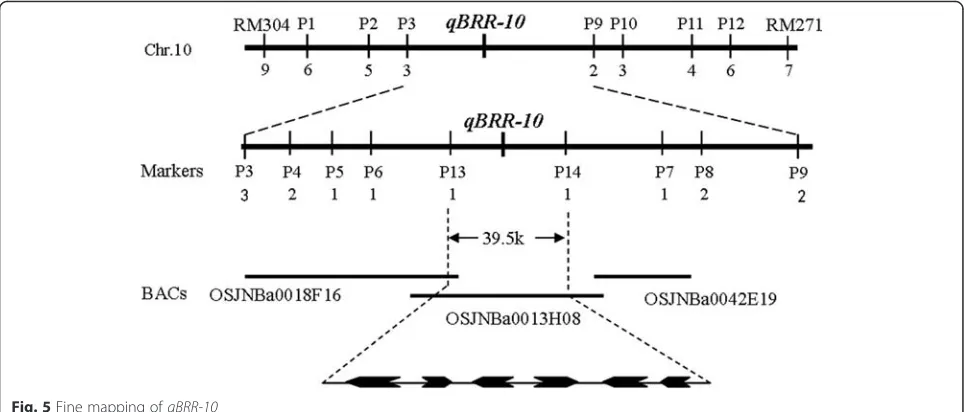
Fine Mapping Identifies a New QTL for Brown Rice Rate in Rice (Oryza Sativa L.)
Full text
Figure
Related documents
On the off chance that Lewy bodies create in a piece of the cerebrum called the mind stem, and indications of dementia, somebody may likewise create manifestations like
Energy Balance (TSEB) model for estimating daytime ET using tower-based land surface 18.. temperature measurements over two Pinot Noir (Vitis vinifera ) vineyards at different
A regulatory threshold is a specified concentration of the medication or a derivative thereof in plasma or urine, whereas a withdrawal time guideline is a suggested time before an
Keywords: Flexible pavement, Benkelman Beam, 5 th wheel bump integrator, unevenness index, correlation,..
In developed countries widespread universal vaccination of infants has dramatically decreased the incidence of pertussis, especially hospitalisation and death, among those aged
Consistent with arbitrageurs’ limited ability to provide liquidity, we find that at the time of liquidity crises hedge funds reduce their equity holdings by 9% to 11% per
The results of previous research showed a linear rela- tionship between the stretch factor (increase in lateral speckle size) and blood flow velocity. However, errors exist in the
by MarvinSketch and ADMET Predictor (but not ACD/Percepta), that the solubility profile of the more soluble drug, PG-300995, could be adequately predicted by the
