LETTER
Temperature control of micro heater
using Pt thin film temperature sensor
embedded in micro gas sensor
Jun‑gu Kang
1,2, Joon‑Shik Park
2*, Kwang‑Bum Park
2, Junho Shin
2, Eung‑An Lee
3, Sangsoo Noh
3and Hoo‑Jeong Lee
1,4*Abstract
Pt thin film temperature sensors (Pt T sensors) are embedded in micro gas sensors to measure and control the work‑ ing temperature. We characterized electrical resistances of Pt T sensors and micro heaters with temperature changing in the oven and by Joule heating. In order to enhance the accuracy of temperature measurement by the Pt T sensors, we investigated the correlation among the Pt T sensor, micro heater, and the working temperature, which was linear proportional relation expressed as the equation: T2= 6.466R1–642.8, where T2= temperature of the Pt micro heater and R1= the electrical resistance of the Pt T sensor. As the error by physically separated gap between Pt T sensor and micro heater calibrated, measuring and controlling temperature of micro heater in micro gas sensors were possible through the Pt T sensors. For the practical use of Pt T sensor in micro gas sensor, the gas sensing properties of fabri‑ cated micro gas sensors to 25 ppm CO and 1 ppm HCHO gases were characterized.
Keywords: Micro gas sensor, Pt thin film temperature sensor, CO and HCHO gases
© The Author(s) 2017. This article is distributed under the terms of the Creative Commons Attribution 4.0 International License (http://creativecommons.org/licenses/by/4.0/), which permits unrestricted use, distribution, and reproduction in any medium, provided you give appropriate credit to the original author(s) and the source, provide a link to the Creative Commons license, and indicate if changes were made.
Background
Micro gas sensors with micro-platforms, which consist of micro heaters and sensing electrodes on the membranes, have been actively researched, due to the possibility to miniaturize sensors and reduce power consumptions [1–4]. Micro heaters are necessary for elevated tempera-tures to operate micro gas sensors [5], because most of gas sensors need thermal energy to react gases [6, 7]. However, usually, it is hard to measure and control accu-rate temperatures of micro gas sensors with input pow-ers to increase temperatures of micro heatpow-ers. In general, there are two kinds of measurement methods of tem-perature of micro heaters. One is contact type method such as thermocouples, negative temperature coefficient (NTC) thermistors and Pt resistance temperature detec-tors (RTDs), and so on. The other is non-contact type
method such as IR cameras. Even though many research-ers have measured the temperatures of micro gas sensors by IR cameras, there are some still problems in terms of measurement errors by setting the incorrect emissivity and not enough precision due to the resolution of the cameras [8]. For instance, temperature measurement of the same device is remarkably changed with variations of emissivity. The measured temperature is highly depend-ent on emissivity of materials. The reason why it is diffi-cult to determine the exact emissivity of IR camera is that other materials exist surrounding micro heater layer in the micro gas sensor as reported in [8, 9] and the emissiv-ity is affected by not only the kinds of materials but also morphologies of surfaces and shapes of materials [10]. Also, it is not possible to measure the operating tempera-ture of packaged micro gas sensors using by IR cameras. In the case of the contact type of temperature sensors, it is also hard to measure the operating temperature of micro gas sensors with membranes due to the fracture problem from fragile structures of membranes and ther-mal conductivity problem between the micro heaters and
Open Access
*Correspondence: [email protected]; [email protected]
1 School of Advanced Materials Science & Engineering, Sungkyunkwan University, Suwon, Gyeonggi 16419, Republic of Korea
2 Korea Electrical Technology Institute (KETI), Seongnam, Gyeonggi 13509, Republic of Korea
contact type temperature sensors. So, special micro tem-perature sensors are needed.
We need to avoid some problems above such as emis-sivity error from IR cameras, fracture problem and ther-mal conductivity of contact type temperature sensors. Also, more exact temperature monitoring of micro heat-ers in MEMS gas sensors using by micro Pt thin film temperature sensors (briefly, Pt T sensors) in the micro-platform of micro gas sensors is needed. Temperature could be measured using by Pt T sensors no matter what materials surrounding micro heaters. So, Pt T sensors could avoid emissivity error problem from IR cameras and fracture problem and thermal conduction problem from contact type temperature sensors.
In this study, in order to enhance the accuracy of temperature measurement of micro heaters in micro-platform of micro gas sensors, the Pt T sen-sors were designed, fabricated, and characterized in micro-platform.
Methods
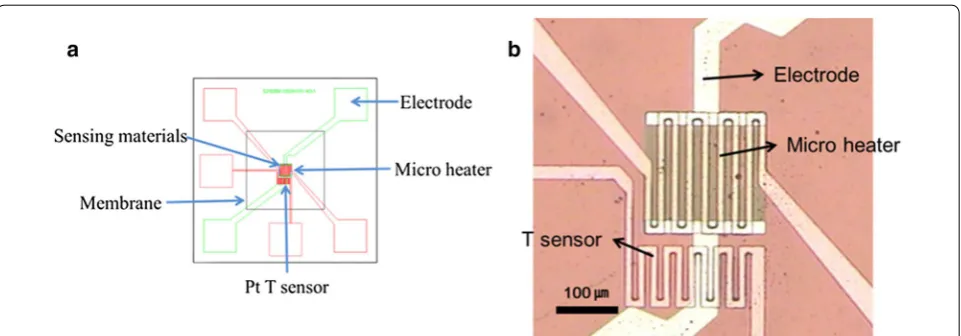
Experimental procedures consisted of micro gas sensor design and fabrication, electrical resistance measurement of micro heaters and Pt T sensors. We measured temper-ature of micro gas sensors using by an IR camera (FLIR T 420, FLIR, USA) to compare with the results of Pt T sensors. The Pt T sensor was embedded in the micro gas sensor, which had electrode, micro heater, sensing mate-rials, and membrane. The micro heater increases temper-ature to activate the sensing materials which react gases. The electrode measures the electrical resistances of sens-ing materials, which detects reactive gases. The SiNx
membrane was adjusted for the low power consumption of micro gas sensor. Most of the micro gas sensor pro-cesses were fabricated same as the design and similar to our previous work [11]. An additional method for Pt T sensor was described as follows. In process of fabricat-ing micro heater on the membrane, the Pt T sensor was integrated nearby the micro heater part on the same layer with separation distance of 20 µm for electrical isolation as shown in Fig. 1. The chip size is 2828 μm × 2828 μm. The heater size is 190 μm × 190 μm with thickness of 200 nm. The membrane size is 1401 μm × 1401 μm. The width of the micro heater is 10 μm.
In order to measure and control the temperature of the micro gas sensors with input power, we carried out the procedures which consisted of the following four steps:
(1) Measurement of the electrical resistance change of both Pt T sensors and micro heaters in the tem-perature oven (SU201, Espec, Japan) as a function of temperature from 25 to 150 °C.
(2) Measurement of the electrical resistance of micro heaters and Pt T sensors by Joule heating with vari-ous input power of a DC power supply from 1 to 15 mW
(3) Measurement of the temperature of the micro heat-ers by an IR camera during Joule heating with input power to compare with the results from (1) and (2) above regarding the micro heaters.
(4) Calibration of the results from (1) and (2) above in order to measure and control the temperature of the micro heaters and compare with the result from (3).
Results and discussion Pt T sensors
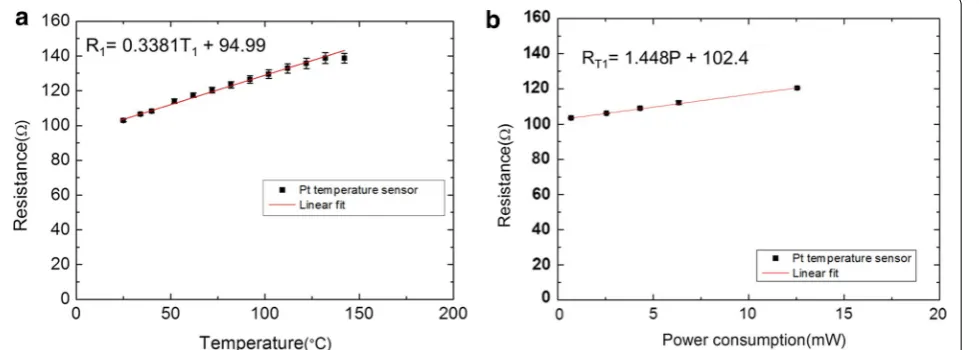
Figure 2a shows the electrical resistance changes of the Pt T sensors in the temperature oven with increasing tem-perature, which is linear. The electrical resistances (R1)
were 103 and 145 Ω at 25 and 150 °C, respectively. Red line is a linear fit of the electrical resistance versus tem-perature, which can be expressed as the Eq. (1):
where R1 = Resistance of Pt T sensor in temperature
oven, T1 = Temperature of Pt T sensor equal to the oven
temperature.
The electrical resistance is directly proportional to input power as shown in Fig. 2b, which can be expressed as the Eq. (2):
(1)
R1= 0.3381T1+94.99,
where R T1 = resistance of Pt T sensor by Joule heating
with input power, P = power consumptions.
Pt micro heaters
To investigate temperature difference between T1 and
T2 owing to 20 μm physical gap, we characterized the
electrical resistance change of the Pt micro heaters in the temperature oven. As shown in Fig. 3a, the electri-cal resistances were 127 and 171 Ω at 25 and 150 °C in the temperature oven, respectively. The change of slope is linear functions of temperature and the red line is linear fit which is expressed as follow the Eq. (3):
(2) RT1=1.448P +102.4,
(3) R2= 0.3511T2+118.3,
Fig. 2 a The electrical resistance of the Pt T sensors measurement versus temperature from 25 to 150 °C in the temperature oven. b The electrical resistance of the Pt T sensors versus input power by joule heating from 1 to 12 mW
where R2 = the electrical resistance of the micro heater
in temperature oven, T2 = temperature of the Pt micro
heater.
Figure 3b shows the correlation between the electrical resistance and input power, which is linear proportional relationship expressed as Eq. (4):
where R2 = resistance of micro heater by joule heating
with input power, P = power consumptions.
The electrical resistance of the Pt micro heaters were 131 and 174 Ω at 2 and 15 mW, respectively.
We assumed that R2 in Eq. (3) was equal to R2 in Eq. (4)
to know the relationship between input power and
(4)
R2=3.288P +125.1,
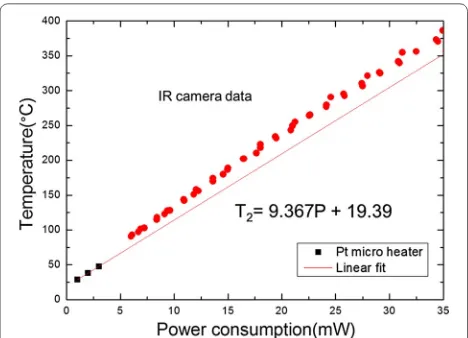
temperature of the Pt micro heaters, which was obtained from two Eqs. (3) and (4) as shown in Fig. 4. Equation (5) was temperature measurement with input power from calculating the Eqs. (3) and (4) in Fig. 4.
For the comparison with measurement results from an IR camera, the temperature of the Pt micro heater was measured by an IR camera (T420, FLIR, USA, emissiv-ity = 0.5). The red dot in Fig. 4 shows the Pt micro heater temperature with input power, displaying almost same slope of linearity in Fig. 4. These results measured by micro heaters were well agreement with the IR camera results.
R1 = the electrical resistance of Pt T sensor
R2 = the electrical resistance of Pt micro heater P = the power consumptions.
Heat losses appeared through 20 μm physical gap between the Pt T sensor and the Pt micro heater which generated heat by input power. Finally, in order to meas-ure and control the temperatmeas-ure of the Pt micro heater using Pt T sensor, we need to investigate the relation-ship between the electrical resistance of Pt T sensor and Pt micro heater temperature as follows. Equation (1) informs the electrical resistance of Pt T sensor (R1) at T1.
P1 is consumed power to reach the electrical resistance
of the Pt T sensor R1 through Eq. (2). The temperature of
the Pt micro heater which is supplied P1 power
consump-tions is T2 from Eq. (5). We could obtain two graphs from
the above procedures and calculations through Eqs. (1), (2) and (5), as presented in Fig. 4, which shows that T1 is
lower than T2 in Fig. 5.
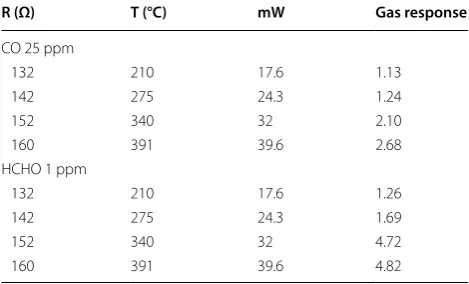
Figure 6 shows the gas responses to 25 ppm CO and 1 ppm HCHO gases with the working temperature in situ, which is obtained by the fabricated micro gas sen-sor using SnO2 thin film sensing materials with Pt T
sen-sor (see also Table 1). With input powers from 17 mW reached to 210 °C to 39 mW reached to 391 °C, the fab-ricated micro gas sensor reacted with the gases and the working temperature was measured by the Pt T sensor simultaneously. The gas responses to 25 ppm CO and 1 ppm HCHO gases of the fabricated gas sensors were 1.13 and 1.26 at 17.6 mW, and 2.68 and 4.82 at 39.6 mW, respectively.
Conclusions
In this study, we fabricated the Pt T sensors integrated in micro gas sensors to measure and control the work-ing temperature. There were heat losses between the Pt T sensor and the Pt micro heater due to 20 μm physical gap. In order to enhance the accuracy of temperature
(5) T2=9.367P +19.39
Fig. 4 The linear fitted red line was temperature measurement with input power from calculating the Eqs. (3) and (4). The red dot showed the temperature versus power consumptions measured by the IR camera. The temperature of the Pt micro heater and an IR camera showed the almost same degree of linearity
measurement by the Pt T sensors, we investigated the correlation between the Pt T sensor and the working temperature, which was linear proportional relation expressed as the equation: T2 = 6.466R1–642.8, where
T2 = temperature of the Pt micro heater and R1 = the
electrical resistance of the Pt T sensor. As the error by separation gap calibrated, measuring and controlling the temperature of micro gas sensors were possible through the Pt T sensors. In addition, we measured the gas response of the fabricated micro gas sensor to 25 ppm CO and 1 ppm HCHO gases and the working tempera-ture with the integrated Pt T sensors. Further work is thermal analysis to compare with the above results and enhance the accuracy of temperature measurement.
Authors’ contributions
JK has made substantial contributions to conception, acquisition of data and analysis. JSP and HJL have been involved in drafting the manuscript or revising it critically for important intellectual content. KBP, JS, EAL and SN have given approval of the version. All authors read and approved the final manuscript.
Author details
1 School of Advanced Materials Science & Engineering, Sungkyunkwan University, Suwon, Gyeonggi 16419, Republic of Korea. 2 Korea Electrical Tech‑ nology Institute (KETI), Seongnam, Gyeonggi 13509, Republic of Korea. 3 Dae Yang Electric Co., Ltd, Incheon, Gyeonggi 22013, Republic of Korea. 4 SKKU Advanced Institute of Nanotechnology (SAINT), Suwon, Gyeonggi 16419, Republic of Korea.
Competing interests
The authors declare that they have no competing interests.
Funding
This research was supported by the Project No. 10043800, of “S/W converged components technology development program” by KEIT and MOTIE in Korea. The authors appreciate for research funding. J.S.Park and J.G. Kang also would like to acknowledge thepartial support from the R&D Convergence Program of MSIP andNST of Republic of Korea (Grant CAP‑13‑1‑KITECH).
Publisher’s Note
Springer Nature remains neutral with regard to jurisdictional claims in pub‑ lished maps and institutional affiliations.
Received: 28 April 2017 Accepted: 1 September 2017
References
1. Ahmed MGA, Dennis J, Khair MHM, Rabih AA, Mian MU (2016) Characteri‑ zation of embedded micro‑heater and temperature sensor in a CMOS‑ MEMS resonator for gas sensing. Int J Appl Eng Res 11:4381–4386 2. Lu C‑J, Steinecker WH, Tian W‑C, Oborny MC, Nichols JM, Agah M et al
(2005) First‑generation hybrid MEMS gas chromatograph. Lab Chip 5:1123–1131
3. Barrettino D, Graf M, Wan Ho S, Kirstein KU, Hierlemann A, Baltes H (2004) Hotplate‑based monolithic CMOS microsystems for gas detection and material characterization for operating temperatures up to 500/spl deg/C. IEEE J Solid State Circuits 39:1202–1207
4. He X, Li J, Gao X, Wang L (2003) NO2 sensing characteristics of WO3 thin film microgas sensor. Sens Actuators B Chem 93:463–467
5. Lee C‑Y, Chiang C‑M, Wang Y‑H, Ma R‑H (2007) A self‑heating gas sensor with integrated NiO thin‑film for formaldehyde detection. Sens Actuators B Chem 122:503–510
6. Barsan N, Koziej D, Weimar U (2007) Metal oxide‑based gas sensor research: how to? Sens Actuators B Chem 121:18–35
7. Barsan N, Weimar U (2001) Conduction model of metal oxide gas sensors. J Electroceram 7:143–167
8. Briand D, Krauss A, Van der Schoot B, Weimar U, Barsan N, Göpel W et al (2000) Design and fabrication of high‑temperature micro‑hotplates for drop‑coated gas sensors. Sens Actuators B Chem 68:223–233 9. Briand D, van der Schoot B, de Rooij NF, Sundgren H, Lundstrom I (2000)
A low‑power micromachined MOSFET gas sensor. J Microelectromech Syst 9:303–308
10. Králík T, Musilová V, Hanzelka P, Frolec J (2016) Method for measurement of emissivity and absorptivity of highly reflective surfaces from 20 K to room temperatures. Metrologia 53:743–753
11. Choi K‑Y, Park J‑S, Park K‑B, Kim HJ, Park H‑D, Kim S‑D (2010) Low power micro‑gas sensors using mixed SnO2 nanoparticles and MWCNTs to detect NO2, NH3, and xylene gases for ubiquitous sensor network appli‑ cations. Sens Actuators B Chem 150:65–72
Fig. 6 Gas response (Ra/Rg) results to 25 ppm CO and 1 ppm HCHO gases with the working temperature obtained from the electrical resistance of the Pt T sensor
Table 1 Gas response results of SnO2 gas sensor with Pt T sensor to 25 ppm CO and 1 ppm HCHO gases
R (Ω) T (°C) mW Gas response
CO 25 ppm
132 210 17.6 1.13
142 275 24.3 1.24
152 340 32 2.10
160 391 39.6 2.68
HCHO 1 ppm
132 210 17.6 1.26
142 275 24.3 1.69
152 340 32 4.72