R E S E A R C H
Open Access
A comparative analysis of the relationship
between learning styles and mathematics
performance
Vania J Ma
1and Xin Ma
2*Abstract
Background:As an effort to account for disparities in mathematics performance between American and East Asian middle school students, the present research aims to compare the relationship between learning styles
(competitive and cooperative) and mathematics performance among middle school students between the USA and the three top-performing East Asian countries (Hong Kong, Japan, and Korea) in 2003 Programme for International Student Assessment (PISA).
Results:Results from hierarchical linear model (HLM) with students nested within schools demonstrated three key findings: (a) competitive learning had a statistically significant positive though small relationship with mathematics performance in all four countries, (b) cooperative learning had a statistically significant positive though small relationship with mathematics performance in the three East Asian countries but not in the USA, and (c) the
relationship between competitive learning and mathematics performance was as strong as the relationship between cooperative learning and mathematics performance across the three East Asian countries.
Conclusions:Although American students are stronger competitive and cooperative learners than their East Asian peers, they are not effective users of either learning style for the improvement of mathematics performance likely because of the way that both learning styles are practiced in American mathematics classrooms. Teacher education may hold the key to improve the educational practice of different learning styles as a strategy to improve mathematics performance of students in the USA and beyond.
Keywords:Competitive learning; Cooperative learning; Mathematics performance
Background
One of the most enduring concerns among mathematics educators in the USA is the enhancement of students in mathematics performance. Since the 1960s, international comparative studies have consistently demonstrated that students in the USA lag behind students in other developed countries in mathematics performance (e.g., Programme for International Student Assessment or PISA and Third International Mathematics and Science Study or TIMSS). According to The Journal (December 3, 2013), Education Secretary, Arne Duncan, called the latest PISA results ‘a picture of educational stagnation,' Average mathematics performance of students in the USA dropped to 481 in the
2012 assessment compared to 487 in the 2009 assessment. Such performance was below international average among 65 participating countries and resulted in the ranking of the USA to fall from 24th to 29th in mathematics. Duncan added that‘the brutal truth, that urgent reality, must serve as a wake-up call against educational complacency and low expectations. The problem is not that our 15-year-olds are performing worse today than before. The problem is that they’re simply not making progress. Students in many other nations are advancing instead of standing still. In a knowledge-based global economy where education is more important than ever before, both to individual success and collective prosperity, our students are basically losing ground. We’re running in place as other high-performing countries start to lap us’.
In order to foment better mathematics performance, mathematics educators in the USA have long sought for * Correspondence:[email protected]
2
Department of Educational, School, and Counseling Psychology, University of Kentucky, Lexington, 40506, USA
Full list of author information is available at the end of the article
educational reforms to promote the learning and reten-tion of knowledge and skills in mathematics.
One of the most consistent significant conclusions reached by those comparative studies is that students in the USA have been far outperformed in mathematics by their East Asian counterparts that have kept a steady worldwide lead in mathematics performance for many years. The question has been circulated for a long time concerning what the USA can learn from East Asian countries in terms of education and beyond (e.g., Lee and Bremmer 2012). Part of this effort, in particular in mathematics education, involves the discernment of spe-cific disparities between American and East Asian stu-dents and schools that may be correlated with the performance gap (see Ma et al. 2013). The present re-search joins this effort by investigating whether learning styles in mathematics may correlate with mathematics performance in a substantially different manner between American and East Asian students.
The purpose of the present research is to compare the relationship between learning styles and mathematics performance among middle school students in the USA and in the three top-performing East Asian countries (regions) (Hong Kong, Japan, and Korea), applying a two-level hierarchical linear model (HLM) with students nested within schools to a set of PISA data. It seeks to elucidate the performance gap in mathematics by ad-dressing its relevance with respect to the use of learning styles. Specifically, the principal research questions in-clude the following:
1. Are there any differences in utilization of learning styles in mathematics among students between the four countries?
2. What is the relationship between utilization of learning styles in mathematics and mathematics performance among students within each of the four countries?
Review of literature Learning styles
In our ever-evolving society, it has become increasingly apparent that ‘each student plays an integral role in his individual learning experience’ (Weinstein and Hume 1998, p. 6). While teachers prepare lessons and present information, it is ultimately the student who interprets, understands, and retains such information in a way that permits facile retrieval and recall for application. In order to perform these tasks, students employ different preferences for and habits of sense making. A learning style is defined as the way in which a person‘begins to con-centrate on, process, internalize, and remember new and dif-ficult academic information’ (Hall 2008, p. 6). Learning styles therefore indicate how the student ‘perceives,
interacts with, and responds to the learning environ-ment’(Hall 2008, p. 6).
Although the concept of learning styles appeared as late as the 1970s, there have been many different ways to approach this concept. Nevertheless, it is fairly rea-sonable to classify learning styles from two main perspec-tives. One pertains to individual processing of information (e.g., auditory, visual, and kinesthetic; see Pashler et al. 2009); the other pertains to individual relationship with other learners (i.e., competitive and cooperative; see Johnson and Johnson 1989). Competitive and cooperative as learning styles are the focus of the present research.
In a classroom setting, the competitive learner imple-ments an individualistic personal learning plan and em-ploys learning strategies that enable the learner to achieve learning goals (Johnson and Johnson 1989). Competitive learners often see all students in the class as working to-wards the same goal of learning. However, the competitive learner wants to not only become the first in achieving that goal but also achieve that goal in a more outstanding manner than the peers (Montgomery and Groat 1998). Consequently, competitive learners often see academic performance as a system of few winners and many losers. The chief benefit of the competitive learning style is the motivation that stimulates great learning ef-fort (e.g., Burguillo 2010). On the other hand, some educational psychologists have argued that competitive learning may not be desirable because it produces high stress, low self-concept (in the case of failure), cheat-ing, and aggression in the classroom (Johnson and Johnson 1989).
A composite variable was constructed in PISA that measures competitive learning style. The composition of the competitive learning variable includes the following: (a) I would like to be the best in my class in mathemat-ics; (b) I try very hard in mathematics because I want to do better on the exams than the other students; (c) I make a real effort in mathematics because I want to be one of the best; (d) in mathematics, I always try to do better than the other students in my class; and (e) I do my best work in mathematics when I try to do better than others. This composite appears to sufficiently catch the es-sence of the competitive learning style (see Montgomery and Groat 1998).
significant emphasis on the group dynamic and on the progress of the group as a whole. Many educational psy-chologists have praised the enhanced exchange of informa-tion, knowledge, and skills as well as the interdependence and individual accountability, all forged and fostered by a cooperative learning environment (e.g., Slavin 1980; Weinstein and Hume 1998). As its chief disadvan-tage, the cooperative learning environment is difficult to establish and many teachers struggle with the implemen-tation in their classrooms (e.g., Gillies and Boyle 2010).
A composite variable was constructed in PISA that measures cooperative learning style. The composition of the cooperative learning variable includes the following: (a) in mathematics, I enjoy working with other students in groups; (b) when we work on a project in mathemat-ics, I think that it is a good idea to combine the ideas of all the students in the group; (c) I do my best work in mathematics when I work with other students; (d) in mathematics, I enjoy helping others to work well in a group; and (e) in mathematics, I learn most when I work with other students in my class. Arguably, these vari-ables are sound indicators of the cooperative learning style (see Murphy and Alexander 2006).
In general, cooperation is more effective for higher-order tasks (e.g., problem solving), whereas competi-tion is more effective for lower-order tasks (e.g., rote learning) (e.g., Johnson et al. 1981; Johnson et al. 1980). These researchers concluded in their meta-analyses that students completing academic tasks under cooperative conditions tend to outperform students completing academic tasks under competitive conditions. Later on, another meta-analysis replicated this conclusion (Qin et al. 1995).
Johnston (1997) argued that, to promote academic success, educators need to understand how students dif-fer in their approaches to learning tasks and use that un-derstanding to create strategies for learning. Johnson et al. (2000) examined eight cooperative learning methods and found that all of them indicate significantly positive effects on academic achievement. Specific to mathematics educa-tion, Bell (1989) asserted that, to increase mathematics performance, how students learn in mathematics must be analyzed. Hall (2008) also asserted that learning styles are a significant determinant of mathematics performance. In general, review of educational research has indicated a positive relationship between learning styles and mathem-atics achievement (Middleton and Spanias 1999). Overall, it is important to investigate learning styles as a critical variable in explaining mathematics performance.
People are not born to share a genetic predisposition in terms of the learning approach; instead, they learn how to conduct learning through a socialization process that is unique to each culture (Nelson 1995). Of course, some learning styles can be common to students around
the world. For example, if tests require students mainly to reproduce knowledge, then memorization dominates their learning styles (Au and Entwistle 1999). But, other learning styles can be very culturally specific. Singleton (1991) stated that every culture has unstated assump-tions about people and how they learn and these as-sumptions invisibly guide the educational process in that culture. According to Ma et al. (2013), the research lit-erature that attempts to explain East Asian academic success is comprehensive, but with one weakness that speaks to the lack of attention to the way that East Asian students manage their learning in relation to their aca-demic success. They argued that how students learn may hold important clues to the superior academic perform-ance of East Asian students. Therefore, investigating learning styles in an international context has important implications for improving mathematics education in the USA.
East Asian success
Many researchers have attempted to examine student, family, teacher, and school factors salient in contributing to academic achievement in East Asia (see Ma et al. 2013). One popular perception is the amount of emphasis on effort over ability in East Asian cultures (Stevenson and Stigler 1992). Meanwhile, other researchers have at-tributed ability to academic success in East Asia (Eccles and Wigfield 1995). More recent studies have primarily focused on attitudes rather than behaviors, showing that students in East Asian countries have a significantly higher level of interest and motivation in learning than students in other highly developed countries (Bybee and McCrae 2011; Liu et al. 2006). Based on results from PISA and TIMSS, Watkins (2000) cautioned about the use of affective factors to explain disparities in mathematics per-formance between the USA and East Asia because stu-dents in some of the best-performing East Asian countries indicate low self-esteem and negative attitudes towards mathematics. Studies of mathematics performance among East Asian students also indicate parental education and expectation as primary determinants correlating positively to mathematics performance (Leung 2010).
East Asian countries has also been attributed to high na-tional standards and expectations (Valverde and Schmidt 2000) and mathematics content that emphasizes depth ra-ther than breadth (Kaya and Rice 2010). Some researchers noticed that East Asian students are very respectful to-ward teachers and maintaining an excellent relationship with teachers can be critical to learning (Stevenson and Stigler 1992), whereas other researchers warned that such an elevated level of respect can interfere with learning when students do not feel comfortable questioning what teachers say (Jeynes 2008).
In addition, a high societal expectation is always placed on teachers to be highly skillful in curriculum and instruction to help students learn and succeed in East Asian countries. Ma's (1999) influential study indi-cated that Chinese teachers have a much deeper under-standing of mathematics content than American teachers. Other studies based on classroom videos have also shown that East Asian teachers present clearer lessons and en-gage students more in the learning process (Jacobs and Morita 2002; Leung 2005). Professional development may have played a central role in East Asian teachers' success (Fernandez et al. 2003).
The quality of instruction is considered as another prime contributor to the superior mathematics performance of East Asian students. Mathematics curriculum established by East Asian countries mandates that teachers do not simply place emphasis on the development of lower-level cognitive skills; instead of instructing students through the medium of rote memorization, East Asian mathematics teachers are expected to promote higher level critical and analytical thinking in their classes (Liu et al. 2006). This en-couragement of higher-order thinking skills in East Asian mathematics classes may enable students to gain a more in-depth understanding of mathematics and apply their knowledge in more novel ways. East Asian mathematics teachers are also much more group-oriented than math-ematics educators in other countries. In East Asian coun-tries, it is not uncommon for a mathematics teacher from one school to observe and critique the teaching practice of a mathematics teacher from a different school, and this group teaching dynamic may have enabled East Asian mathematics educators to better refine their teaching prac-tices and further tailor their teaching to the individual needs of their students (Watkins 2000). In the research lit-erature, there are other accounts for East Asian success as the result of high levels of pressure to perform well on exit exams, additional outside schooling, and strong family sup-port (e.g., Bray 2010; Cave 2001; Watanabe 2000).
According to Ma et al. (2013), the research literature on East Asian academic success, even though compre-hensive, lacks attention to whether academic success of East Asian students correlates with how they manage their learning process. They began this important line of
inquiry by exploring the success of six top-performing East Asian countries (regions) in PISA 2009 (Hong Kong, Japan, Korea, Shanghai, Singapore, and Taipei). Their search for reasons for success concerned about student academic behaviors such as the use of learning strategies and meta-cognitive skills among students and school climatic attributes such as disciplinary climate among schools. They found striking total consistencies across all academic areas (reading, mathematics, and sci-ence) and across all countries (regions) that highly suc-cessful students were skillful users of advanced learning strategies in their learning and knew how to utilize meta-cognitive skills in the process of their learning. They reported that these positive effects are not only comprehensive but also the strongest among all statisti-cally significant student academic behaviors. In line with Ma et al. (2013), the present research aims to examine the relationship between learning styles, another import-ant aspect of how students manage their learning, and mathematics performance among American and East Asian students.
Methods Samples
Data used to answer the research questions were obtained from the 2003 PISA database. As one of the latest data-bases accessible for data analysis of secondary education, PISA has been appraised as a valuable means to examine student literacy in reading, mathematics, and science. PISA shifts its focus from one subject to another, allotting specific student evaluation to one subject for each cycle of assessment. When the present research was conducted, PISA 2003 was the most recent source of comprehensive (student) data concerning mathematics performance. To fulfill the comparative perspective, the present research in-corporated PISA samples from Hong Kong (4,478 stu-dents from 145 schools), Japan (4,707 stustu-dents from 144 schools), Korea (5,444 students from 149 schools), and the USA (5,456 students from 274 schools) to generate statis-tical models.
Variables
literacy covers quantity, space and shape, change and relationships, and uncertainty.
Independent variables came from students and schools (principals). At the student level, the independent variables included gender (coded as 1 = male and 0 = female), age (a continuous variable in years), father socioeconomic status (SES) (a continuous composite variable), and mother SES (a continuous composite variable). The key independent variables were competitive and cooperative learning styles at the student level1. Both were continuous composite variables as discussed earlier. In PISA, each composite variable is standardized based on data from all participating countries (regions). Therefore, each value de-scriptive of, say, competitive learning is a score in refer-ence to the grand average value of using competitive learning worldwide.
At the school level, some independent variables measured school context, including student-teacher ratio (a continu-ous variable), school mean father SES (a continucontinu-ous variable aggregated from father SES of students within a school), school mean mother SES (see school mean father SES), pro-portion of certified teachers (a continuous variable), and quality of school educational resources (a continuous com-posite variable)2. Other independent variables measured school climate, including school disciplinary climate (a con-tinuous composite variable), teacher-student relationship (a continuous composite variable), student behaviors (a con-tinuous composite variable), teacher behaviors (a continu-ous composite variable), school autonomy (a continucontinu-ous composite variable), teacher participation (a continuous composite variable), and ability grouping (for all core school subjects) (coded as 1 = yes and 0 = no). Additional file 1 shows the construction of school-level composite variables.
The present research, with variables descriptive of both students and schools to model the relationship be-tween learning styles and mathematics performance, falls into the research field of school effects; thus, the selec-tion of variables at both student and school levels was based on the theoretical framework of school effects that emphasizes characteristics of student background as well as school context and school climate (see Ma et al. 2008). These categories were captured sufficiently with the above student-level and school-level variables (see Additional file 2 for descriptive statistics).
Analyses
To answer our first research question that concerns about differences in students' use of learning styles across countries, we produced descriptive statistics to in-dicate the average use of each learning style among stu-dents in different countries. To test whether the observed difference across countries is statistically significant, we performed one-way ANOVA. When one-way ANOVA
indicated statistically significant results, we applied post hoc analysis (Scheffe) to‘rank order’the countries in stu-dents' use of a learning style.
To answer our second research question that concerns about the relationship between learning styles and math-ematics performance in different countries, we applied a two-level hierarchical linear model (HLM) as the pri-mary statistical technique (see Raudenbush and Bryk 2002) because data at hand were hierarchically struc-tured with students nested within schools. For each country, the HLM model can be expressed at the stu-dent level as:
Yij¼β0jþ X4
n¼1
βnjStudent Backgroundnij
þβ5jLearning Style5ijþεij
where Yij is the score in mathematics for student i in schooljandεijis the error term at the student level. Coef-ficientsβnj(n= 1, 2, 3, 4) are associated with student back-ground variables, and the coefficient β5j represents the
relationship between a particular student learning style (competitive or cooperative) and mathematics perform-ance. Therefore, the level 1 model examined this relation-ship with control for student background characteristics. Coefficient β0j is then the average score in mathematics
for school j after adjustment over both student back-ground variables and student learning style, and it be-comes the dependent variable at the school level. The HLM model can be expressed at the school level as:
β0j¼γ00þ X12
p¼1
γ0pSchool Backgroundpjþu0j
where γ00 is the grand national mean score in
math-ematics and u0j is the error term at the school level.
Coefficients γ0p (p= 1, 2,…12) are associated with
school-level variables. Therefore, the level 2 model functioned to control for school context and climate characteristics in the present research.
were in response to Thum and Bryk (1997) who suggested that, for example, if gender differences (across schools) are not a research question, it is appropriate to fix the gender variable. In addition, student-level and school-level vari-ables were centered around their grand means for inter-pretative and analytical benefits (see Raudenbush and Bryk 2002). Finally, to determine statistical significance of a coefficient, the alpha level of 0.05 was used in the present research.
Results
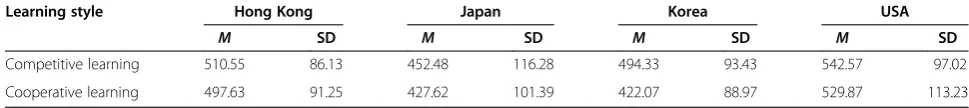
Table 1 presents descriptive statistics on students' use of learning styles across the four countries (see Additional file 2 for descriptive information on other variables at both student and school levels). We re-scaled learning styles based on data from the four countries to have a mean of 500 and a standard deviation of 1004. This table indicates variation in the use of each learning style among students across countries. We performed one-way ANOVA with post hoc analysis to test whether stu-dents across the four countries applied each learning style differently (not reported in table).
Results of one-way ANOVA indicate that the extent to which competitive learning was applied to the study of mathematics was statistically significantly different across the four countries, F(3, 19,891) = 713.45, p< 0.05. Stu-dents' use of competitive learning followed the order of the USA, Hong Kong, Korea, and Japan, with each statisti-cally significantly different from all others either (statisti-cally significantly) more or (statisti(statisti-cally significantly) less. Approximately 10% of the variance in students' use of competitive learning was attributable to countries.
Similarly, results of one-way ANOVA indicate that the extent to which cooperative learning was applied to the study of mathematics was statistically significantly different across the four countries, F(3, 19,880) = 1,462.58,p< 0.05. Cooperative learning was practiced the most in the study of mathematics by students in the USA and the least by students in both Japan and Korea that were not statistically significantly different in students' use of cooperative learn-ing. Hong Kong was sandwiched in between (statistically significantly less than the USA but statistically significantly more than both Japan and Korea). Approximately 18% of the variance in students' use of cooperative learning was at-tributable to countries.
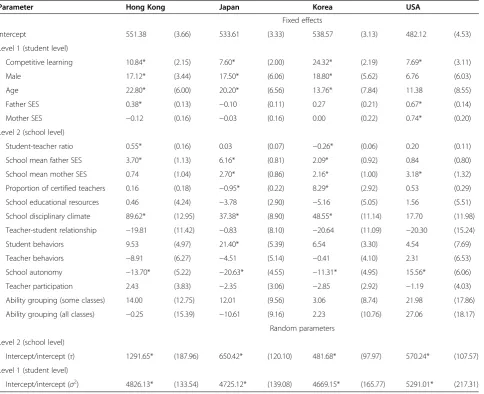
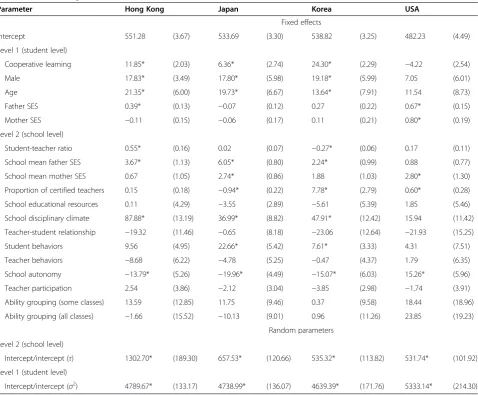
Tables 2 and 3 present the HLM estimates of the rela-tionships between learning styles (i.e., competitive and cooperative) and mathematics performance across the four countries. First of all, variance in mathematics per-formance as the dependent variable can be partitioned into components for which students and schools are re-sponsible. Intra-class correlation (ICC) refers to the pro-portion of variance at the school level. ICC was 0.48 for Hong Kong, 0.57 for Japan, 0.35 for Korea, and 0.34 for the USA (e.g., 34% of the variance in mathematics per-formance was attributable to schools in the USA)5. The interpretations of Tables 2 and 3 would focus on the two types of learning styles (competitive and cooperative) so as to highlight the key issues given that the large number of variables at the student and school levels were used mainly as control variables to purify the relationship between learning styles and mathematics performance (i.e., these vari-ables were not a part of the research questions)6.
Competitive learning was statistically significantly and positively associated with mathematics perform-ance across all four countries7. Specifically, one SD in-crease in the use of competitive learning would be associated with an increase in mathematics perform-ance by about 11 points in Hong Kong, about 8 points in Japan, about 24 points in Korea, and about 8 points in the USA. Because PISA mathematics performance was measured on a scale with a mean of 500 and a standard deviation of 100, these magnitudes across countries, with their SD measures, can be easily trans-lated into a common metric (i.e., effect size) (Hox 2002). According to Cohen (1988), effect size of 0.50 is large, 0.30 is moderate, and 0.10 is small. Therefore, the magnitude of the relationship between competitive learning and mathematics performance was small (0.09 in Hong Kong, 0.09 in Japan, 0.23 in Korea, and 0.07 in the USA).
Although cooperative learning was statistically signifi-cantly and positively associated with mathematics per-formance in Hong Kong, Japan, and Korea, cooperative learning did not have any statistically significant rela-tionship with mathematics performance in the USA8. Specifically, one SD increase in the use of cooperative learning would be associated with an increase in mathematics performance by about 12 points in Hong Kong (effect size = 0.11), about 6 points in Japan
Table 1 Descriptive statistics on the use of leaning styles in the learning of mathematics across countries (regions)
Learning style Hong Kong Japan Korea USA
M SD M SD M SD M SD
Competitive learning 510.55 86.13 452.48 116.28 494.33 93.43 542.57 97.02
Cooperative learning 497.63 91.25 427.62 101.39 422.07 88.97 529.87 113.23
(effect size = 0.06), and about 24 points in Korea (effect size = 0.22). Therefore, the magnitude of the relationship between cooperative learning and mathematics perform-ance were either small or none.
We note that if American students who were stronger cooperative learners than their East Asian peers (Table 1) did not differ much in their use of cooperative learning, a lack of the relationship between cooperative learning and mathematics performance could occur in the USA. Obviously, this is not the case in Table 1. In fact, American students demonstrated the largest SD among students across the four countries. Therefore, the lack of the rela-tionship between cooperative learning and mathematics performance in the USA was not a result of data artifact.
Finally, Table 4 presents the estimates on proportion of variance explained9. The goal of this table is to evalu-ate model-data-fit concerning the eight HLM models10.
Results indicate that the level 2 HLM model was speci-fied with great success with the vast majority of variance in mathematics performance explained at the school level. For example, 90% of the variance in mathematics per-formance that was attributable to schools was accounted for by both the competitive learning model and the cooperative learning model in Japan. Therefore, variables that we se-lected to measure school context and climate were indeed on target to account for the vast majority of variance in mathematics performance for which schools were respon-sible. Proportion of variance explained was much smaller at the student level. Nonetheless, it is not un-common with education data to observe small propor-tions at the student level (see Ma et al. 2008), and these proportions of variance explained, according to Gaur and Gaur (2006), were adequate in capturing variance in mathematics performance.
Table 2 HLM results estimating the relationship between competitive learning style and mathematics performance across countries (regions)
Parameter Hong Kong Japan Korea USA
Fixed effects
Intercept 551.38 (3.66) 533.61 (3.33) 538.57 (3.13) 482.12 (4.53)
Level 1 (student level)
Competitive learning 10.84* (2.15) 7.60* (2.00) 24.32* (2.19) 7.69* (3.11)
Male 17.12* (3.44) 17.50* (6.06) 18.80* (5.62) 6.76 (6.03)
Age 22.80* (6.00) 20.20* (6.56) 13.76* (7.84) 11.38 (8.55)
Father SES 0.38* (0.13) −0.10 (0.11) 0.27 (0.21) 0.67* (0.14)
Mother SES −0.12 (0.16) −0.03 (0.16) 0.00 (0.22) 0.74* (0.20)
Level 2 (school level)
Student-teacher ratio 0.55* (0.16) 0.03 (0.07) −0.26* (0.06) 0.20 (0.11)
School mean father SES 3.70* (1.13) 6.16* (0.81) 2.09* (0.92) 0.84 (0.80)
School mean mother SES 0.74 (1.04) 2.70* (0.86) 2.16* (1.00) 3.18* (1.32)
Proportion of certified teachers 0.16 (0.18) −0.95* (0.22) 8.29* (2.92) 0.53 (0.29)
School educational resources 0.46 (4.24) −3.78 (2.90) −5.16 (5.05) 1.56 (5.51)
School disciplinary climate 89.62* (12.95) 37.38* (8.90) 48.55* (11.14) 17.70 (11.98)
Teacher-student relationship −19.81 (11.42) −0.83 (8.10) −20.64 (11.09) −20.30 (15.24)
Student behaviors 9.53 (4.97) 21.40* (5.39) 6.54 (3.30) 4.54 (7.69)
Teacher behaviors −8.91 (6.27) −4.51 (5.14) −0.41 (4.10) 2.31 (6.53)
School autonomy −13.70* (5.22) −20.63* (4.55) −11.31* (4.95) 15.56* (6.06)
Teacher participation 2.43 (3.83) −2.35 (3.06) −2.85 (2.92) −1.19 (4.03)
Ability grouping (some classes) 14.00 (12.75) 12.01 (9.56) 3.06 (8.74) 21.98 (17.86)
Ability grouping (all classes) −0.25 (15.39) −10.61 (9.16) 2.23 (10.76) 27.06 (18.17)
Random parameters
Level 2 (school level)
Intercept/intercept (τ) 1291.65* (187.96) 650.42* (120.10) 481.68* (97.97) 570.24* (107.57)
Level 1 (student level)
Intercept/intercept (σ2) 4826.13* (133.54) 4725.12* (139.08) 4669.15* (165.77) 5291.01* (217.31)
More importantly, competitive and cooperative learn-ing styles individually accounted for 3% of the student-level variance in mathematics performance in Hong Kong and Japan, 10 and 9% in Korea, and 3 and 1% in the USA. Compared with corresponding proportions of variance explained at the student level when all variables (including the powerful predictors of mathematics per-formance such as SES at the student level) were present,
learning styles were relatively important among student-level variables across countries particularly in Japan and Korea. In Korea, for example, proportion of variance ex-plained at the student level was 12% with all variables in the model and 10% with competitive learning as the only variable, and proportion of variance explained at the stu-dent level was 13% with all variables in the model and 9% with cooperative learning as the only variable. Table 3 HLM results estimating the relationship between cooperative learning style and mathematics performance across countries (regions)
Parameter Hong Kong Japan Korea USA
Fixed effects
Intercept 551.28 (3.67) 533.69 (3.30) 538.82 (3.25) 482.23 (4.49)
Level 1 (student level)
Cooperative learning 11.85* (2.03) 6.36* (2.74) 24.30* (2.29) −4.22 (2.54)
Male 17.83* (3.49) 17.80* (5.98) 19.18* (5.99) 7.05 (6.01)
Age 21.35* (6.00) 19.73* (6.67) 13.64* (7.91) 11.54 (8.73)
Father SES 0.39* (0.13) −0.07 (0.12) 0.27 (0.22) 0.67* (0.15)
Mother SES −0.11 (0.15) −0.06 (0.17) 0.11 (0.21) 0.80* (0.19)
Level 2 (school level)
Student-teacher ratio 0.55* (0.16) 0.02 (0.07) −0.27* (0.06) 0.17 (0.11)
School mean father SES 3.67* (1.13) 6.05* (0.80) 2.24* (0.99) 0.88 (0.77)
School mean mother SES 0.67 (1.05) 2.74* (0.86) 1.88 (1.03) 2.80* (1.30)
Proportion of certified teachers 0.15 (0.18) −0.94* (0.22) 7.78* (2.79) 0.60* (0.28)
School educational resources 0.11 (4.29) −3.55 (2.89) −5.61 (5.39) 1.85 (5.46)
School disciplinary climate 87.88* (13.19) 36.99* (8.82) 47.91* (12.42) 15.94 (11.42)
Teacher-student relationship −19.32 (11.46) −0.65 (8.18) −23.06 (12.64) −21.93 (15.25)
Student behaviors 9.56 (4.95) 22.66* (5.42) 7.61* (3.33) 4.31 (7.51)
Teacher behaviors −8.68 (6.22) −4.78 (5.25) −0.47 (4.37) 1.79 (6.35)
School autonomy −13.79* (5.26) −19.96* (4.49) −15.07* (6.03) 15.26* (5.96)
Teacher participation 2.54 (3.86) −2.12 (3.04) −3.85 (2.98) −1.74 (3.91)
Ability grouping (some classes) 13.59 (12.85) 11.75 (9.46) 0.37 (9.58) 18.44 (18.96)
Ability grouping (all classes) −1.66 (15.52) −10.13 (9.01) 0.96 (11.26) 23.85 (19.23)
Random parameters
Level 2 (school level)
Intercept/intercept (τ) 1302.70* (189.30) 657.53* (120.66) 535.32* (113.82) 531.74* (101.92)
Level 1 (student level)
Intercept/intercept (σ2) 4789.67* (133.17) 4738.99* (136.07) 4639.39* (171.76) 5333.14* (214.30)
Standard errors are in parentheses. *p< 0.05.
Table 4 Proportion of variance among students and schools explained by HLM models estimating relationship between learning styles and mathematics performance
Learning style Hong Kong Japan Korea USA
Students Schools Students Schools Students Schools Students Schools
Competitive learning 0.10 (0.03) 0.74 0.05 (0.03) 0.90 0.12 (0.10) 0.83 0.09 (0.03) 0.81
Cooperative learning 0.11 (0.03) 0.74 0.05 (0.03) 0.90 0.13 (0.09) 0.81 0.09 (0.01) 0.83
Discussion
Summary of principal findings
The present research aimed to elucidate the mathemat-ics performance disparities between American and East Asian students in terms of their use of learning styles. The findings are all situated in the backdrop that Ameri-can students championed the use of both competitive learning and cooperative learning. The HLM models created for the USA, Hong Kong, Japan, and Korea all indicated that the competitive learning style was signifi-cantly and positively associated with mathematics per-formance. Students' drive to compete against one another to become the best thus mattered to mathematics per-formance among American and East Asian students. The point of difference between the USA and East Asia (Hong Kong, Japan, and Korea) was in the relationship between cooperative learning and mathematics performance. For East Asian students, increased use of cooperative learning was significantly associated with improved mathematics performance; while for American students, increased use of cooperative learning was not significantly associated with improved mathematics performance.
Common effects in using competitive learning
Table 2 indicates two important patterns concerning competitive learning. The first pattern pertains to the common effects of using competitive learning: competi-tive learning was significantly and posicompeti-tively associated with mathematics performance across all countries ex-amined in the present research (the USA, Hong Kong, Japan, and Korea). Therefore, for students across the countries, increased use of competitive learning was as-sociated with improved mathematics performance, even though effect sizes were small. The second pattern per-tains to the ineffectiveness of competitive learning in the USA: competitive learning had a stronger positive rela-tionship with mathematics performance in both Hong Kong (0.11 SD) and Korea (0.24 SD) than in the USA who had very similar positive results to those of Japan (0.08 SD for both countries). Therefore, from the educa-tional perspective of improving their mathematics performance, East Asian students were able to use competitive learning either more effectively than or (at least) as effectively as American students.
In spite of the often negative views towards competi-tive learning in the USA (see Bergin and Cooks 2000; Good and Brophy 2008), this learning style demon-strated a consistent positive relationship with mathemat-ics performance across countries. The USA has an inherently individualistic culture in which all individuals aspire to rise to the top. Such competitive spirit is clearly manifested in the learning of mathematics as American students championed the use of competitive learning among all students in the four countries (Table 1). If the
pattern is that American students lead the way in com-petitive learning of mathematics but fall behind in using competitive learning for improved mathematics perform-ance, American students may have applied competitive learning in an ineffective way as far as the improvement of their mathematics performance is concerned. We suspect that the support for American students to engage in com-petitive learning is inadequate even though they demon-strate the strongest determination to apply competitive learning. Most American educators endorse competition in a very limited way (see Good and Brophy 2008). Mean-while, although the East Asian cultures do not explicitly promote individual excellence and achievement, the strong pressure to perform well so as to get into top colleges makes intensive academic competition among East Asian students nevertheless inevitable according to USA Today (August 4, 2013). Most East Asian edu-cators recognize this reality and actually endorse com-petitive learning among students.
Unique East Asian advantage in using cooperative learning
Table 3 illustrates a striking pattern concerning coopera-tive learning. The pattern speaks to the unique finding of using cooperative learning among East Asian stu-dents: cooperative learning had a significant positive re-lationship with mathematics performance across all East Asian countries examined in the present research (Hong Kong, Japan, and Korea) but not in the USA. Therefore, for students in the East Asian countries, increased use of cooperative learning was associated with improved mathematics performance, even though effect sizes were small. Ironically, for American students who were stron-ger cooperative learners than their East Asian counter-parts, increased use of cooperative learning was not associated with improved mathematics performance in the USA.
Similar to the case of competitive learning, a pattern occurs in which American students lead the way in cooperative learning of mathematics but fall behind in using cooperative learning for improved mathematics performance. This seemingly paradoxical phenomenon may indicate a flaw in the practice of cooperative learning in the USA. We suspect that two things are possible in re-gard to cooperative learning in the USA. First, many edu-cators consider cooperative learning difficult to develop and implement (see Gillies and Boyle 2010). Students therefore may not have sufficient opportunities to apply cooperative learning to the study of mathematics, even though many students are in favor of this learning style.
classrooms in the USA. In both cases, the teaching is labeled as cooperative learning by the mathematics teachers. In one scenario, the teacher demonstrated as an example how to solve a mathematics problem on the board, and then assigned students a practice prob-lem very similar to the one demonstrated but with dif-ferent numbers. Students were instructed to work in groups of three to discuss and solve the problem. The discussion among students in each group encompassed whether the approach of problem solving demon-strated by the teacher was followed correctly and whether the numerical answer to the problem was cor-rect. In the other scenario, the teacher prepared a stack of review packets that did not contain any new mate-rials (they were basic problems over matemate-rials that stu-dents already learned). Stustu-dents were told to work in groups to finish the review packets collaboratively. The discussion among students in each group concerned mainly about answers to problems and occasionally brief explanations of how certain answers were obtained.
In striking contrast, Cheng (2011) described the Chinese concept of cooperative learning in mathematics that em-phasizes the‘analysis and problem solving of complicated issues and knowledge that is of the nature of extensive coverage of the interconnected reasoning path’ (p. 75). Chinese mathematics educators see cooperative learning in mathematics as‘suitable for topics involving large-scale conceptualization and multi-tiered reasoning’ (Cheng 2011, p. 79). To Chinese mathematics educators,‘what is meant by ‘cooperativeness’ is the cooperativeness in the sense of mental activity rather than cooperation which is superficially just a form like people gathering’ (Cheng 2011, p. 81). We suspect that this difference in the practice of cooperative learning between East Asia and the USA is exactly what has produced the unique ad-vantageous East Asian relationship between cooperative learning and mathematics performance that we have observed in the present research.
Competitive versus cooperative learning: which is more important?
Another notable pattern in Tables 2 and 3 is that where both competitive and cooperative learning showed sig-nificant results (i.e., in Hong Kong, Japan, and Korea), the relationship between competitive learning and math-ematics performance was as strong as the relationship between cooperative learning and mathematics perform-ance. Therefore, students in Hong Kong, Japan, and Korea employed both competitive and cooperative learn-ing to the same advantage for the improvement of their mathematics performance. The East Asian experience is that to promote learning in mathematics, both individual excellence and group collaboration should be empha-sized, as Cheng (2011) stated that even ‘under the
circumstances of cooperative learning, thinking inde-pendently and cooperative communication intermingle and nurture each other’ (p. 80). Among other reasons, East Asian students outperform American students likely because East Asian students are encouraged and facili-tated by educational practices that emphasize both types of learning styles.
Implications
The neat patterns concerning competitive and coopera-tive learning revealed in the present research can mean-ingfully inform American mathematics educators to think about the optimal balance between competitive and cooperative learning in the study of mathematics. We offer some implications to American mathematics education. First, as far as the improvement of their mathematics performance is concerned, even though the American culture honors individualist, it appears that American students have not been able to effectively translate this cultural advantage into competitive learn-ing. It appears that the mainly negative attitudes of American educators towards competitive learning may need to be revisited. This suggestion may well be provoca-tive to American educators, but the East Asian experience is so consistent: the drive for individual excellence turns out to be as important as the emphasis on collaborative effort as far as mathematics performance is concerned. American mathematics educators may need to encourage and more importantly facilitate individual efforts to aim higher, learn more, and perform better in mathematics.
Even in light of high pressure to perform and strong competition for success, East Asian students employed cooperative learning to the same results that they used competitive learning, in regard to their mathematics per-formance. American mathematics educators may need to change the way that cooperative learning is practiced in the study of mathematics. On this issue, American ed-ucators can learn from their East Asian counterparts. In-tellectual depth and vigor may be lacking in cooperative learning in American mathematics classrooms but are pursued in cooperative learning in East Asian mathemat-ics classrooms (see Cheng 2011). We suggest that profes-sional development is an effective strategy for teachers to study and promote effective cooperative learning.
intellectual work involved in cooperative learning. Ma (1999) also considered the understanding of fundamen-tal mathematical concepts as the basis for any effective teaching and learning of mathematics. Therefore, it may not be adequate just to train teachers to use learning styles more effectively but also to understand the sub-stantive mathematical intellectual work that they hope their students to gain from either individual or group learning.
Conclusions
Overall, as stronger competitive and cooperative learners than their East Asian peers, American students have demonstrated great potentials in using both competitive and cooperative learning styles as learning strategies to promote mathematics performance. Unfortunately, they are not effective users of either learning style for the im-provement of mathematics performance likely because of the way that both learning styles are practiced in American mathematics classrooms. We believe that teacher education holds the key to improve the educa-tional practice of different learning styles as a strategy to improve mathematics performance of students in the USA and beyond.
Endnotes
1
Because one of the important goals of education is to develop competencies beyond school subjects in most countries, PISA developed indicators of Cross Curricular Competencies. Part of this effort was the PISA construc-tion of scales measuring learning styles. Included in the PISA data, these constructs (composite variables) are meaningful entities both theoretically and psychometric-ally (OECD, 2010). By nature, these constructs measure (experience-based) preferences, and PISA contains no data on actual practices of learning styles on the part of either students or teachers. Nonetheless, OECD (2010) considers these preferences as valid and reliable indica-tors of practices (when opportunities occur).
2
There is no questionnaire specifically designed for teachers in PISA. Information about teachers (as a whole) is collected indirectly through either students or principals. In the present research, variables descriptive of teachers (as a whole) were classified into school con-text (i.e., proportion of certified teachers) and school cli-mate (i.e., teacher-student relationship, teacher behaviors, and teacher participation). For the same reason, statistical analysis omitted teachers (as a level) in the present research.
3
Analytically, ANOVA directly compared countries in one analysis, while the HLM analyses were performed country by country. Although this practice was necessary to address our research questions, there was a change of analytical approaches. Nonetheless, our emphasis as an
international comparative study was always variation and comparison across countries. In fact, the relationship of interest could be compared across countries in an ANOVA-like analysis using confidence intervals (see Glass and Hopkins 2008). We met our analytical goals without that analysis. Also, in the ANOVA case, it is appropriate to consider the four countries members of a common population for comparative purposes (see Robitaille and Travers 1992).
4
PISA transformed standardized mathematics achieve-ment scores into a scale with a mean of 500 and a stand-ard deviation of 100. One of the purposes of this transformation was to make comparison neater to present and easier to understand. For the same reason, we transformed learning styles that were originally standardized (composite) variables (e.g., 0.11 and−0.02 for competitive and cooperative learning respectively in the case of Hong Kong).
5
The ICC for the USA (0.34) is much larger than that in Hedges and Hedberg (2007) who reported an ICC for mathematics performance of less than 0.20 across sev-eral large American datasets. Under the PISA definition of mathematics performance, there appears to be a lot of variance among schools in mathematics performance to be explained.
6
Because grand mean centering does not alter coeffi-cients of independent variables, the relationship between learning styles and mathematics performance was not af-fected. The intercept was altered. Intercepts in Tables 2 and 3 indicate mathematics performance of a typical stu-dent with nationally representative characteristics (in terms of variables at the student and school levels) (see Raudenbush and Bryk 2002).
7
The relationship between competitive learning and mathematics performance was tested multiple times across countries. The What Works Clearinghouse (2011) ‘does not have specific guidelines for studies that use multiple groups [on a single outcome],’ asking for the discretion of the researcher(s) (p. G.5). WWC does rec-ommend a procedure similar to one group on multiple outcomes. Among the four statistically significant results concerning competitive learning, the largestpvalue was 0.014 (others were all marked as <0.001 in the HLM outputs). Therefore, after the WWC-recommended ad-justment, the relationship remained significant in all countries.
8
Among the three statistically significant results con-cerning cooperative learning, the largest p value was 0.023 (others were both marked as <0.001 in the HLM outputs). Therefore, after the WWC-recommended ad-justment, the relationship remained significant in these three countries.
9
variables. Adequacy of performance pertains to a HLM model as a while. Table 4 implies that the learning con-text (environment) that variables at the student and school levels established was adequate in which learning styles became statistically significant (student-level) pre-dictors of mathematics performance.
10
In measuring mathematics performance, PISA em-ploys plausible values that are not score points. Each student has five plausible values that need to be statisti-cally integrated properly for use as a measure of mathem-atics performance for that student. The current computer software that performs HLM is capable of handling plaus-ible values, but model-data-fit statistics are not available at this time for HLM models that involve plausible values (Raudenbush et al. 2011). We applied proportion of vari-ance explained (equivalent to R2) to cope with this lack. Some researchers may consider R2 a measure of model performance rather than model-data-fit as a function of the extent to which underlying assumptions of HLM are met.
Additional files
Additional file 1:Description of school-level composite variables.
Additional file 2:Descriptive statistics on student and school characteristics across countries (regions).
Competing interests
The authors declare that they have no competing interests.
Authors’contributions
VM carried out literature review, conducted data management, performed data analysis, and drafted the manuscript. XM supervised and enhanced literature review, supervised data management and data analysis, and supervised and revised the manuscript. Both authors read and approved the final manuscript.
Author details
1Trinity College, Duke University, Durham, 27708, USA.2Department of
Educational, School, and Counseling Psychology, University of Kentucky, Lexington, 40506, USA.
Received: 30 January 2014 Accepted: 1 April 2014 Published: 27 August 2014
References
Au, C, & Entwistle, N. (1999).Memorisation with understanding in approaches to studying: cultural variant or response to assessment demands?Paper presented at the biennial conference of the European Association for Research on Learning and Instruction. Sweden: Gothenburg.
Bell, A. (1989). Testing for the test.London Times Supplement, 27.
Bergin, DA, & Cooks, HC. (2000). Academic competition among students of color: an interview story.Urban Education, 35, 442–472.
Bray, M. (2010). Researching shadow education: methodological challenges and directions.Asia Pacific Education Review, 11, 3–13.
Burguillo, JC. (2010). Using game theory and competition-based learning to stimulate student motivation and performance.Computers and Education, 55, 566–575.
Bybee, R, & McCrae, B. (2011). Scientific literacy and student attitudes: perspectives from PISA 2006 science.International Journal of Science Education, 33, 7–26.
Cave, P. (2001). Educational reform in Japan in the 1990s:‘individuality’and other uncertainties.Comparative Education, 37, 173–191.
Cheng, H. (2011). A case study of cooperative learning in mathematics: middle school course design.Journal of Mathematics Education, 4, 75–88. Cohen, J. (1988).Statistical power analysis for the behavioral sciences(2nd ed.).
Hillsdale, NJ: Erlbaum.
Eccles, J, & Wigfield, A. (1995). In the mind of the actor: the structure of adolescents’achievement task values and expectancy-related beliefs. Personality and Social Psychology Bulletin, 21, 215–225.
Fernandez, C, Joanna, C, & Chokshi, S. (2003). A U.S.-Japan lesson study collaboration reveals critical lenses for examining practice.Teaching and Teacher Education, 19, 171–185.
Gaur, AS, & Gaur, SS. (2006).Statistical methods for practice and research: a guide to data analysis using SPSS. Thousand Oaks, CA: Sage.
Gillies, RM, & Boyle, M. (2010). Teachers’reflections on cooperative learning: issues of implementation.Teaching and Teacher Education, 26,933-940.
Glass, GV, & Hopkins, KD. (2008).Statistical methods in education and psychology (3rd ed.). Needham Height, MA: Allyn & Bacon.
Good, TL, & Brophy, JE. (2008).Looking in classrooms(10th ed.). Boston, MA: Pearson Education.
Hall, M. (2008).The effect of cooperative learning groups and competitive strategies on math facts fluency of boys and girls. Retrieved from https://commons.kennesaw. edu/gpc/sites/commons.kennesaw.edu.gpc/files/Paper%20Hall_0.pdf. Hedges, LV, & Hedberg, EC. (2007). Intraclass correlation values for planning
group-randomized trials in education.Educational Evaluation and Policy Analysis, 29, 60–87.
Hox, J. (2002).Multilevel analysis: Techniques and applications. Mahwah, NJ: Erlbaum.
Jacobs, JK, & Morita, E. (2002). Japanese and American teachers’evaluations of videotaped mathematics lessons.Journal for Research in Mathematics Education, 33, 154–175.
Jeynes, W. (2008). What we should and should not learn from the Japanese and other East Asian educational systems.Educational Policy, 22, 900–927. Johnson, DW, & Johnson, RT. (1989).Cooperation and competition: theory and
research. Edina, MN: Interaction Book.
Johnson, DW, Johnson, RT, & Stanne, MB. (2000).Cooperative learning methods: a meta-analysis. Retrieved from http://www.ccsstl.com/sites/default/files/ Cooperative%20Learning%20Research%20.pdf.
Johnson, DW, Maruyama, G, Johnson, R, Nelson, D, & Skon, L. (1981). Effects of cooperative, competitive, and individualistic goal structures on achievement: a meta-analysis.Psychological Bulletin, 89, 47–62.
Johnson, DW, Skon, L, & Johnson, R. (1980). Effects of cooperative, competitive, and individualistic conditions on children’s problem-solving performance. American Educational Research Journal, 17, 83–93.
Johnston, C. (1997). Using the learning combination inventory.Educational Leadership, 55, 78–82.
Kaya, S, & Rice, DC. (2010). Multilevel effects of student and classroom factors on elementary science achievement in five countries.International Journal of Science Education, 32, 1337–1363.
Lee, A, & Bremmer, I. (2012).What the U.S. can learn from China. San Francisco, CA: Berett-Koehler.
Leung, FK. (2005). Some characteristics of East Asian mathematics classrooms based on data from the TIMSS 1999 video study.Educational Studies in Mathematics, 60, 199–215.
Leung, FK. (2010). Behind the high achievement of East Asian students. Educational Research and Evaluation, 8, 87–108.
Liu, Y, Wu, AD, & Zumbo, BD. (2006). The relation between outside of school factors and mathematics achievement: a cross-country study among the U.S. and five top- performing Asian countries.Normes, 6, 1–35.
Ma, L. (1999).Knowing and teaching elementary mathematics. Mahwah, NJ: Erlbaum.
Ma, X, Jong, C, & Yuan, J. (2013). Exploring reasons for the East Asian success in PISA. In H Meyer & A Benavot (Eds.),PISA, power, and policy: the emergence of global educational governance(pp. 225–246). Oxford, United Kingdom: Symposium Books.
Ma, X, Ma, L, & Bradley, K. (2008). Using multilevel modeling to investigate school effects. In AA O’Connell & DB McCoach (Eds.),Multilevel modeling of educational data(pp. 59–110). Charlotte, NC: Information Age.
Middleton, JA, & Spanias, PA. (1999). Motivation for achievement in mathematics: Findings, generalizations, and criticisms of the research.Journal for Research in Mathematics Education, 30, 65–88.
Murphy, PK, & Alexander, PA. (2006). Contextualizing the learner-centered principles for teachers and teaching.Keys to School Improvement, 2, 13–32.
Nelson, GL. (1995). Cultural differences in learning styles. In JM Reid (Ed.),Learning styles in the ESL/EFL classroom. New York: Newbury House.
Organization for Economic Co-operation and Development. (2006).Where immigrant students succeed. A comparative review of performance and engagement in PISA 2003. Paris: Organization for Economic Co-operation and Development. Organization for Economic Co-operation and Development. (2010).Mathematics
teaching and learning strategies in PISA. Paris: Organization for Economic Co-operation and Development.
Pashler, H, McDaniel, M, Rohrer, D, & Bjork, R. (2009). Learning styles: concepts and evidence.Psychological Science in the Public Interest, 9, 105–119. Qin, Z, Johnson, DW, & Johnson, RT. (1995). Cooperative versus competitive
efforts and problem solving.Review of Educational Research, 65, 129–143. Raudenbush, SW, & Bryk, AS. (2002).Hierarchical linear models(2nd ed.). Newbury
Park, CA: Sage.
Raudenbush, SW, Bryk, AS, & Congdon, R. (2011).HLM 7 for Windows. Skokie, IL: Scientific Software International, Inc.
Robitaille, DF, & Travers, KJ. (1992). International studies of achievement in mathematics. In DA Grouws (Ed.),Handbook of research on mathematics teaching and learning(pp. 687–709). New York: Macmillan.
Singleton, J. (1991). The spirit of gamburu. In AE Finkelstein, AE Imamura, & JJ Tobin (Eds.),Transcending stereotypes: discovering Japanese culture and education. Yarmouth, ME: Intercultural Press.
Slavin, RE. (1980). Cooperative learning.Review of Educational Research, 50, 315-342.
Stevenson, H, & Stigler, JW. (1992).The learning gap. New York: Summit Books. Thum, YM, & Bryk, AS. (1997). Value-added productivity indicators: The Dallas system. In J Millman (Ed.),Grading teachers, grading schools: is student achievement a valid evaluation measure?(pp. 100–109). Thousand Oaks, CA: Corwin.
Valverde, GA, & Schmidt, WH. (2000). Greater expectations: learning from other nations in the quest for‘world-class standards’in US school mathematics and science.Journal of Curriculum Studies, 32, 651–687.
Watanabe, T. (2000). Japanese high school entrance examinations.Mathematics Teacher, 93(January), 30–35.
Watkins, D. (2000). Learning and teaching: a cross-cultural perspective.School Leadership and Management, 20, 161–173.
Weinstein, CE, & Hume, LM. (1998).Study strategies for lifelong learning. Washington, DC: American Psychological Association.
Clearinghouse, WW. (2011).WWC procedures and standards handbook (version 3.0). Washington, DC: Institute of Education Sciences.
Woodward, J, & Ono, Y. (2004). Mathematics and academic diversity in Japan. Journal of Learning Disabilities, 37, 74–82.
doi:10.1186/2196-7822-1-3
Cite this article as:Ma and Ma:A comparative analysis of the
relationship between learning styles and mathematics performance. International Journal of STEM Education20141:3.
Submit your manuscript to a
journal and benefi t from:
7Convenient online submission 7Rigorous peer review
7Immediate publication on acceptance 7Open access: articles freely available online 7High visibility within the fi eld
7Retaining the copyright to your article