73 4, XIX, 2016
DOI: 10.15240/tul/001/2016-4-006
Introduction
The socio-political changes which started in the late 90’s and the Polish accession to the European Union in 2004 fundamentally determined the direction of structural changes of the national economy. These changes resulted in the beginning of the privatization processes, consolidation and concentration, which, together with the accession to the EU and the intensifi cation of the globalization processes, increased their dynamics. Moreover, there was a confrontation with foreign markets, mainly those of the EU, resulting in changes in prices relations, consumer preferences and implementation of legal regulations. These processes covered all sectors, including the food industry – one of the largest and most dynamically developing sectors of the Polish economy, which resulted from the following:
in 2005-2011 the real value of output increased in this sector by 28.8%, and in 2011 constitute 17.2% of the global output of industrial processing,
the value added of the food industry increased in real terms in 2005-2011 to 37.5% and in 2011 accounted for 15.7% of the value added of industrial processing, the food industry in Poland contributes
signifi cantly to GDP; in 2005-2011 the share of the value added of this sector in GDP was in the range of 2.4-3.0%,
manufacture of food products and
beverages is an important place of employment; in 2011 in the food sector in Poland there were 435 thousand people employed, representing 17.7% of the employed in industrial processing,
the food sector to a large extent dynamises and determines the domestic exports; in 2005-2011 the nominal value of exports in this sector increased by 100.1%, and its
share in the industrial processing export in 2011 reached the level of 9.1%,
the food industry successfully competes in foreign markets; for 9 years it has been generating a positive balance of foreign trade of food products, which increased from 0.56 billion PLN (2003) to 7 billion PLN (2011), i.e. more than 12.5 times.
The aforementioned economic indicators do not cover, naturally, all areas of the changes which have occurred in the Polish food industry in recent years. They do not include in their scope the achievements of fi nancial nature, which in the long term, are essential for the development of the food sector. The basic and at the same time the most important measures of fi nancial performance include profi tability ratios, which are generally perceived in three aspects, namely: return on sales (ROS), return on assets (ROA) and return on equity (ROE). The profi tability ratios are widely used in evaluating fi nancial performance of enterprises and the benefi ts to their owners. However, in practice their usefulness is largely limited due to the synthetic nature and the consequent limited scope of the information content. Hence, in research practice, more broadly are used procedures for disaggregation of fi nancial ratios and their inclusion in indicator systems, which enables a multi-dimensional and cause-and-effect analysis of various fi nancial issues (see e.g. Bednarski, 2007; Bieniasz et al., 2009; Burns et al., 2008; Dudycz, 2001; 2011; Gołaś, 2008; Gołaś & Paszkowski, 2009; Hawawini & Viallet, 2010; Liesz, 2002; Sierpińska & Jachna, 2011; Sierpińska & Niedbała, 2013; Wędzki, 2006).
The main objective of this paper is a multi-dimensional analysis of variation in profi tability in the Polish food industry. The analysis has been conducted on the basis of the proposed procedure of decomposition of return on sales combined with the system of indicators
PROFITABILITY OF THE FOOD INDUSTRY
IN POLAND – AN ORDERED LOGIT MODEL
APPROACH
74 2016, XIX, 4
combining the return on sales with the return on assets and the return on equity. Moreover, to determine the signifi cance (the strength and direction of impact) of the individual components of the indicator system the authors applied ordered logit models.
1. Source Materials and Research
Methods
This study uses unpublished statistical data of the Central Statistical Offi ce in Warsaw from the years 2006-2011, which enables the analysis of profi tability arranged in sections, groups and classes of the food industry and according to the size of enterprises. The food industry includes the manufacture of food products (Section C, Division 10) and the production of beverages (Section C, Division 11). According to the Polish Classifi cation of Activities 2007, which is in conformity with NACE Rev. 2, the manufacture of food products distinguishes 25 sectors (classes 10.11-10.92), and in the manufacture of beverages there are 7 sectors (classes 11.01-11.07). This paper presents the results of a descriptive analysis of profi tability at the level of sections and classes and the results of a logit analysis at the level of classes, with the consideration of the size of enterprises. The basis for the analysis has been the decomposition of the rates of return, in which as the starting point there has been adopted the equation of Du Pont model, in which the return on equity (ROE) is recognised as the product of the return on assets (ROA) and equity multiplier (MK) or, more broadly, in the form of the product of the return on sales (ROS), the total asset turnover (ROT) and the equity multiplier (MK):
ROE = ROA × MK = ROS × ROT × MK
(1)where:
ROE = netprofi t (ZN) equity (KW)
,
R
OA =netprofi t (ZN) assets (A)
,
R
OS = netprofi t (ZN) revenues (P),
MK
=total assets (A) equity (KW)
,
ROT
= net revenues (P) assets (A).
The paper presents an original proposal to modify the above equations by the decomposition of the return on sales (ROS). This proposal translates into the following system of ratios:
WVAB – gross value added ratio:
WVAB
= gross value added (VAB)net revenues (P) (2)
WAM – rate of depreciation costs:
WAM
= net value added (VAN)gross value added (VAB) (3)
WKP – labour cost index:
WKP
= profi t on sales (ZS)net value added (VAN) (4)
WPPKO – rate of other operating revenues and expenses:
WPPKO
= profi t on operating activities (ZOP) profi t on sales (ZS)(5)
WPKF – rate of financial revenues and expenses:
WPKF
= profi t on business activities (ZDG) profi t on operating activities (ZOP)(6) WZSN – rate of extraordinary events:
WZSN
= gross profi t (ZB) profi t on business activities (ZDG)(7) WEP – tax effect ratio:
WEP
= net profi t (ZN)gross profi t (ZB) . (8)
These indicators allow expressing the return on equity (ROE) as the following equations:
ROE = ZN KW = WVAB × WAM × WKP × × WPPKO WPKF × WZSN × WEP × ROT × MK
(9)
The structure of the above equation indicates that as the starting point in the procedure of decomposition there has been adopted the value added ratio (WVAB) in the form of gross value added (VAB) to the revenues (P), informing about the ability to generate value contributed by the enterprise in relation to the external costs arising from contacts with the environment (Bednarski, 2007; Wędzki, 2006). This indicator is also considered to be the primary determinant of technical and technological advancement (Rachwał, Wiederman, & Kilar, 2009; Wędzki, 2006). To the value added also relate the following two indicators (WAM, WKP), which inform about the impact of the depreciation costs (VAN/VAB) and labour costs
EM_4_2016.indd 74
75 4, XIX, 2016
(ZS/VAN) on the level of profi tability. The next two indicators (WPPKO, WPKF) determine the impact of other operating activities (ZOP/ ZS) and fi nancial activities (ZDG/ZOP) on the increase or deceleration of profi t, as a result of positive or negative balance of other operating revenues and expenses and the balance of fi nancial revenues and expenses. The third area of analysis is the extraordinary level. In the proposed model of the decomposition of profi tability this has been included in the WZSN ratio (ZB/ZDG), which informs about the impact of extraordinary gains and losses on profi tability. The last indicator (WEP = ZN/ZB), the so-called effective tax rate is related to the distribution of profi t and informs about the scale of the gross profi t deceleration due to corporate taxation. The presented above indicators have been integrated with the ROA and ROE profi tability system. As a result, there have been achieved significantly developed analytical systems, which, except for the total asset turnover (ROT = P/A) and equity multiplier (MK = A/KW), allow to model profi tability (ROA, ROE) in the context of additional circumstances.
For modelling the return on equity there has been used the multinomial logit model of ordered categories (i.e. ordered logit model which models the cumulative probabilities). In this model the dependent variable is discrete and takes the values from a countable and fi nite set of values (categories) with a specifi c hierarchy. It shall be assumed that the i-th unit (in this case a sector of the food industry) is characterised by one of J levels of fi nancial condition (1–very low, 2–low, 3–medium, 4– high). Subject to modelling in this case are the so-called cumulative logits, i.e. the logarithms of the probability quotients of belonging the i-th sector to a category of not more than j-th (pij) and the opposite likelihood (1 – pij). The category of fi nancial condition of the industry sector (in this case ROE) is determined by k – a set of exogenous variables (a set of indicators of the ROE system) and a random component. In the case of J categories a J-1 logit equations are received (Borooah, 2001; Hilbe, 2009):
(10) e.g.:
To identify factors affecting the fi nancial condition of the sectors of the food industry, measured with the return on equity (ROE), there have been applied the ordered logit model of the form (Cameron & Trivedi, 2005; Greene, 2008; Greene & Hensher, 2008; Winkelman & Boes, 2006):
(11)
where:
– unobservable variable relating to the i-th observation (ROE for an industry sector), associated with its discrete counterparts (Borooah, 2001; Liao, 1994):
1 – ROE level for i-th sector, 2 – ROE level for i-th sector,
J – ROE level for i-th sector, – cut-points, wherein
– parameter vector,
– vector of exogenous variables (explanatory) for the i-th observation,
– random component for the i-th observation, i = 1, 2, ..., N – number of observations.
After estimating the parameters of the model, the predicted probability of membership of the i-th unit (sector to the j-th category of fi nancial condition – ROE class) can be described as:
(12)
76 2016, XIX, 4
that in the estimated model the parameters of the explanatory variables are the same for each category j (ROE classes), the so-called proportional odds assumption – parallel regression. It means that the ratio between each pair of the compared groups of categories (ROE classes) is the same, i.e. the coeffi cients describing the relationship between the variables at the lowest, as compared to all of the higher categories (comparison of Class 1 to other higher ones) of the explained variable are the same as those which describe the relationship between the following higher level of the category and the other higher categories (comparison of class 1 and 2 to other higher ones), etc. If the relationship between all pairs of categories within the same group of comparisons is proportional, then there is only one set of estimated parameters with the explanatory variables. If the assumption of proportionality of odds ratios would not be met, there should be estimated the so-called generalised ordered logit model, which leads to estimating different sets of parameters with explanatory variables between each compared pair of compared categories – ROE classes (Greene & Hensher, 2008; Williams, 2006). In order to verify this assumption the Brant test and the Wolfe-Gould test have been used (Brant, 1990; Greene & Hensher, 2008; Gruszczyński, 2010; Long & Freese, 2006; Wolfe & Gould, 1998). The idea of using these tests for this purpose is based on verifying whether the model without the condition of the parallel regressions assumption would be a more suitable than the model supporting this limitation. The basis of the test is to estimate the J-1 binomial regressions. For the Brant test the explained variables in these regressions are defi ned as follows:
The null hypothesis of the Brant test expresses equality of relevant parameters in all binomial regressions for all explanatory variables. The rejection of this hypothesis means that for at least one variable parameters differ in at least two binomial models, i.e. the proportional odds assumption is not met. In contrast, individual tests allow determining for which variables parameters in the binomial regressions differ.
In the case of the Wolfe and Gould test the explained variables in binomial regressions are defi ned contrary to the previous test:
The aforementioned test allows comparing the fi t of a set of binominal models with the fi t of the standard ordered model. Rejection of the null hypothesis on equal fi t of both models means that the parallel regression assumption is not met and forcing it on the model signifi cantly worsens its fi t. If the ordered logit model does not meet the assumption of proportional odds there ought to be estimated a generalised ordered model, which considers the variability of the β parameters, depending on the category (in this case the ROE class).
To assess the quality of the estimated ordered logit models of the return on equity the following characteristics have been used:
1. The test of the entire signifi cance of all the explanatory variables (model signifi cance) based on the likelihood ratio test on the basis of statistics, LR = 2(InL – InL0), which has a chi-square distribution with degrees of freedom p – equal to the number of estimated parameters (excluding the estimated cut-points), L – the likelihood function value of the tested model, L0 – the value of the likelihood function of the model including only a constant. This test may also be applied to compare any nested models, i.e. such models where one is formed from the other by reducing the number of explanatory variables (e.g. it may be investigated whether the generalised ordered model is better than the standard ordered logit model). In this case in the aforementioned formula for the test statistic instead of L0 there should be used the likelihood function of a model with a fewer number of estimated parameters. The number of degrees of freedom is the difference between the number of parameters from the compared models.
2. Wald test – the test for the signifi cance of parameter estimates (the null hypothesis assumes no signifi cance of each parameter of the model separately):
EM_4_2016.indd 76
77 4, XIX, 2016
where – estimated parameter, D( ) – standard error of estimated parameter.
3. McFadden’s pseudo R-square (Maddala, 1977; McFadden, 1974):
(13)
The values of this measure theoretically are from the [0;1] range; however, it cannot be interpreted as the coeffi cient of determination of the classical linear regression. The higher the value of this measure, the better the estimated model.
4. Count R-square, defi ned in the context of the proportion of accurate forecasts:
(14)
The higher the value of the measure, the better the model.
5. McKelvey & Zavoina Pseudo R-square (Gruszczyński, 2010; Mckelvey & Zavoina, 1975):
(15)
where: – variance, exact
value in the logistic model.
This measure is most similar to the classical R2; the higher the value the better the model fi t.
6. Akaike and Bayes-Schwartz Information Criteria – these criteria do not have a fi xed range of values; they are used to compare the estimated models. The lower value of these criteria is, the better the model.
2. Diversity of Structure and Level
of Pro
fi
tability in the Polish Food
Industry
Table 1 lists the values of individual profi tability ratios and the rate of return (ROS, ROA, ROE) arranged in sections and in total in the food industry in three sub-periods of 2006-2011. Their analysis demonstrates that the sections of manufacture of food and beverages vary considerably in terms of return on sales (from 3.0% to 3.5% and from 4.5% to 6.3%), and the reasons for this should be primarily sought in the differences in the level of the value added ratio (WVAB), labour costs (WKP), other operating
revenues and expenses (WPPKO) and fi nancial revenues and expenses (WPKF). Among these the greatest relative differences are in the value of the labour cost index (WKP). In the food production this indicator in the examined sub-periods was in the range of 29.1% to 31.3%, while in the manufacture of beverages – from 33.5% to 41.6 %. This situation is due to signifi cant differences in work performance and is confi rmed in the value added ratio (WVAB), which in the food manufacture ranges from 17.1% to 17.7%, and in the manufacture of beverages from 19.7% to 23.7%. These fi gures indicate that, in relative terms, the value added ratio was in the production of beverages, in relation to the food manufacture, higher by over 20%. In the analysed sub-periods labour productivity measured with the net value added in the production of beverages was 2.5-3 times higher than in the food production. Moreover, a higher evaluation of the production of beverages in terms of labour productivity and labour cost index corresponded to signifi cantly higher labour costs of 1 employee. In the analysed sub-periods the average labour costs per 1 employee (remuneration + derivatives) amounted to respectively: 32-46 thousand PLN (food production) and 53-73 thousand PLN (manufacture of beverages).
78 2016, XIX, 4
the manufacture of food products was interest constituting respectively: 65% (2006-2007), 40% (2008-2009) and 59% (2010-2011) of the total fi nancial expenses. A signifi cant decrease in the share of interest in fi nancial expenses in the period 2008-2009 was caused by a strong increase in other fi nancial expenses, mainly due to foreign exchange losses.
Other indicators in this section were characterised by lower variability. However, taking into account their average annual rate of change, one can observe that in the period 2006-2011 the changes in ROS, with the exception of the rate of fi nancial revenues and expenses, were determined mainly by the negative direction of changes of the value added ratio (ΔWVAB = −1.3%) and extraordinary events (ΔWZSN = −0.4%), and the positive direction of changes of the labour cost index (ΔWKP = 3.2%).
The beverage industry was characterised by a much greater variability. The data presented in Table 1 show that the smallest stability characterised mainly the following rates: labour costs (5.6% ≤ VWKP ≤ 9.6%), value added (4.2% ≤ VWVAB≤ 9.1%) and fi nancial revenues and expenses (9.2% ≤ VWKPF ≤ 12.1%). Moreover, in this section higher variability in time was generally associated with a negative, from the profitability perspective, direction of changes in various indicators. This is particularly evident in the case of the value added ratio (ΔWVAB = −4.2%) and the labour cost index (ΔWKP = −5.0%).
The aforementioned conditions of the return on sales determined by the ROS system indicators point to a number of differences between the food industry and the beverage industry, both as to their level and variability. The result of these differences are lower values of ROS in the manufacture of food products (3.0 ≤ ROS ≤ 3.5%), and higher in the manufacture of beverages (4.5 ≤ ROS ≤ 6.3%). In the food manufacture the lower return on sales shall mainly be ascribed to the weaker ability to create value added, resulting in a less favourable relationship of this value to revenues and, to a relatively large degree of its deceleration due to labour costs. Generally, however, in this section the annual average rate of change of indicators was low, and the annual average increase in ROS amounting to 0.9% indicates a greater impact of positive rather than negative changes, as regarded
from the profi tability perspective. In turn, in the beverage industry better abilities to create added value, visible in the multipliers of WVAB and WPKR, noticeably weakened, which, together with changes in other factors (mainly fi nancial expenses), resulted in a strong annual average downward trend in the return on sales (ΔROS = −8.3%).
Generally, in a similar context, but taking into account the asset turnover (ROT), should be regarded the changes in return on assets. The research results indicate that in food manufacture the asset turnover ratio was relatively higher (1.8 ≤ ROS ≤ 1.9) than in the manufacture of beverages (1.5 ≤ ROS ≤ 1.7), and moreover, it was subject to slight fl uctuations (VROT= 3.2%), thus giving a weak downward trend (ΔROT = −0.8%). The resultant of these changes in the food manufacture was a relatively stable ROA (5.6% ≤ ROS ≤ 6.7%) in the analysed sub-periods with a small, within the error margin, upward trend (ΔROA = 0.1%). In this respect, less profi table seems to be the beverage industry, where a lower level of turnover in the analysed period was subject to regression (ΔROT = −3.9%) and together with the decreasing return on sales (ΔROS = −8.3%) it resulted in the depreciation of ROA (from 10.5% to 6.9%). In addition, the average annual growth rate indicates clearly that the strength of the negative impact of the direction of changes in ROS and ROA was over twice the negative impact of the decrease in the asset turnover.
Combining the return on sales and the asset turnover or only the return on assets with the equity multiplier allows estimating the rate of return on equity (ROE). The analysis of these connections leads to the conclusion that the degree of leverage (MK) of the return on equity (ROE) was in both branches of the food industry quite similar, indicating a similar structure of their capital. Furthermore, both in the manufacture of food products (ΔMK = −1.0%) and beverages (ΔMK = 1.0%) the equity multiplier was subject to weak changes, which means that on average in the analysed period it also marginally affected the changes in ROE. It also means that the variability of ROE was determined primarily by the variability of ROS and, although clearly to a lesser extent, by the variability of asset turnover.
Table 2 shows the average levels of the analysed indicators divided into classes
EM_4_2016.indd 78
79 4, XIX, 2016
(sectors) of the food industry in 2009-2011. Their analysis indicates a very strong diversifi cation of sectors, concerning both the level of individual measures of profi tability as well as their conditions determined by the levels of the considered indicators. Taking into account the return on sales (ROS) it can be noticed that its
level fl uctuated within a wide range, from −0.7% to 17.1%. The most profi table (ROS) sectors of the food industry include: 10.81 − sugar production (17.1%), 11.05 − beer production (8.6%), 10.52 – ice-cream production (7.8%), 10.71 − bread production (7.3%), and 10.73 − pasta production (7.1%). In turn, the group with Variables
Food manufacture Beverages manufacture Total food industry
2006-2007
2008-2009
2010-2011
2006-2007
2008-2009
2010-2011
2006-2007
2008-2009
2010-2011
Average level of determinants of the structure of profi tability and rates of return (in %)
WVAB 17.6 17.7 17.1 23.7 22.7 19.7 18.6 18.6 17.5
WAM 83.9 84.4 84.4 83.6 85.2 84.9 83.8 84.6 84.5
WKP 29.1 28.9 31.3 39.9 41.6 33.5 31.5 31.9 31.8
WPPKO 105.5 108.9 105.9 97.3 96.0 103.2 103.2 105.0 105.1
WPKF 93.1 75.7 87.9 100.3 88.9 93.0 95.0 79.4 88.9
WZSN 100.1 100.4 100.2 100.2 101.2 100.0 100.1 100.7 100.1
WEP 82.0 81.4 83.6 81.3 81.7 81.6 81.8 81.5 83.2
ROS 3.5 3.0 3.5 6.3 5.6 4.5 3.9 3.5 3.7
ROT 1.9 1.9 1.8 1.7 1.6 1.5 1.9 1.8 1.8
ROA 6.7 5.6 6.4 10.5 9.2 6.9 7.5 6.4 6.5
MK 2.1 2.1 2.0 2.2 2.3 2.4 2.1 2.1 2.1
ROE 14.1 11.8 13.0 23.3 21.2 16.4 15.9 13.7 13.5
Coeffi cient of variation (V) and the average annual rate of change (Δ) of determinants of the structure of profi tability and rates of return
Variables 2006-2011 2006-2011 2006-2011
V (%) Δ (%) V (%) Δ (%) V (%) Δ (%)
WVAB 4.2 −1.3 9.1 −4.2 4.6 −2.0
WAM 0.5 0.3 1.2 0.4 0.5 0.3
WKP 9.6 3.2 13.6 −5.0 5.6 1.4
WPPKO 3.1 0.1 5.1 0.9 2.2 0.2
WPKF 12.1 −1.3 9.2 −0.7 10.8 −1.3
WZSN 0.3 −0.4 0.9 −0.2 0.5 −0.3
WEP 2.9 0.4 2.3 0.4 2.6 0.5
ROS 20.4 0.9 19.9 −8.3 16.9 −1.2
ROT 3.2 −0.8 7.8 −3.9 3.1 −1.3
ROA 19.4 0.1 24.7 −11.9 17.1 −2.5
MK 1.8 −1.0 4.5 1.0 1.1 −0.7
ROE 19.4 −0.9 23.6 −11.0 17.4 −3.2
Source: own calculations based on unpublished data of CSO
80 2016, XIX, 4
the lowest ROS include: 10.85 − manufacture of prepared meals and dishes (−0.7%), 11.01 − alcohol distillation (0.0%), 10.41 − production of oils (0.9%) and 11.03 − cider production (1.0%). The data in Table 2 also show that in each of the sectors ROS is clearly conditioned by diversifi ed levels of the indicators. However, generally it can be stated that, on average, sectors with high ROS in relation to sectors with low ROS, are characterised by a high degree of value added ratio (WVAB), to a clearly lesser extent the value added is reduced there by the labour costs (WKP), the fi nancial results are marginally determined by other operating activities (WPPKO), and the fi nancial activities (WPKF) do not lead to a signifi cant deceleration of profi tability. In sectors with low ROS, these indicators are defi nitely negative. However, it seems that the strongest negative impact on ROS had high fi nancial expenses, to a low degree compensated by fi nancial revenues, which, with a relatively low added value ratio and high labour costs, led to a weak fi nancial performance of a business activity or generated losses from this activity.
In terms of sectors, strong differences are noticeable also in relation to the rate of return on assets (ROA), the average level of which in 2009-2011 was in a wide range from −0.9% to 18.3%. However, ROA classifi es the sectors of the food industry very similarly to ROS. This means that the impact of the asset turnover (ROT) on ROA was generally comparable in the analysed sectors, thus, seeking the reasons for the diversity of ROA mainly in the same factors which determine the diversity of the ROS levels. This does not mean, however, that the diversity and the impact of the asset turnover were marginal. The data in Table 2 show that the asset turnover is a very important determinant of the return on assets, which is particularly noticeable in meat processing (classes 10.11,12,13). In the case of these sectors, low ROS (1.4% ≤ ROS ≤ 2.8%) was in fact associated with a high level of turnover (2.8 ≤ ROT ≤ 3.4), indicating a short, i.e. about a 4-month cycle of asset reconstruction by revenues, allowing those sectors to obtain the ROA ratio at the level similar to the average in the food industry in total.
Combining ROA with the capital leverage (MK) enables the cause and effect analysis of the return on equity (ROE). The data in Table 2 show that the degree of leverage of the rate of
return on equity did not result in major changes in the classifi cation of the food sectors. In general, sectors with high ROA achieved also high ROE. Nevertheless, it does not apply to sectors with very low or negative return on sales and assets (10.85, 11.01). In their case the high leverage (3.4 ≤ MK ≤ 4.6) was associated with a low or negative return on equity. It is worth noting that in the domestic food industry a particularly high ROE ratio had the brewing industry (48.4%). The high fi nancial performance of this sector results from an above-average return on sales, assets turnover and, consequently, from the above-average return on assets, which, together with a relatively high leverage, leads to a very high return on equity.
3. Ordered Logit Models of Return
on Equity
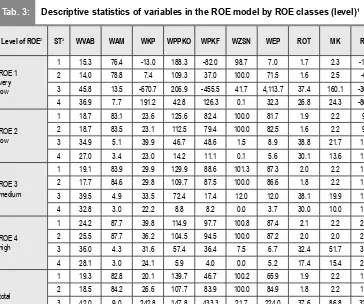
Table 3 presents, in 4 classes of the return on equity (ROE) distinguished on the basis of quartile, some basic descriptive statistics of the 432 analysed sectors of the food industry from 2005 to 2011 included (with the exception of ROE) in the construction of ordered logit model. On the basis of high values of the classic and positional coeffi cient of variation it may be concluded that in the analysed classes of profi tability there is a signifi cant diversity in majority of the variables; furthermore, these variables strongly differentiate the distinguished classes.
Considering sectors of the food industry with very low profi tability (ROE < 6.1%) it may be noted that on average they were characterised by a low added value ratio (WVABROE1 = 15.3%), relatively high labour costs resulting in generating gross loss on sales (WKPROE1 = –13.0%) and a high rate of other operating revenues and expenses (WPPKOROE1 = 188.3%). These sectors are also characterised by a high rate of fi nancial revenues and expenses (WPKFROE1 = –82.0%). The values of the aforementioned indicators on one hand clearly indicate a signifi cant compensation of loss in other operating activities, on the other hand they point to generating loss as a result of a negative balance of fi nancial revenues and expenses.
In addition, on average in this class of profitability, loss on ordinary activities was increased as a result of a negative balance of extraordinary gains and losses (WZSNROE1 = 98.7%). It corresponds to the very
EM_4_2016.indd 80
81 4, XIX, 2016
low tax effect ratio (WEPROE1 = 7.0%) resulting from a high incidence in this profi tability class of sectors with gross and net loss. As a consequence of these conditions was, associated with a relatively lower level of turnover (ROTROE1 = 1.7%) and close to the average in total of the level of equity multiplier (MKROE1 = 2.3%), a negative average level of
profi tability (ROE 1 = –14.9%). It should also be noted that the analysed indicators in the lowest profi tability class (ROE 1) are characterised by the largest, compared to other classes, diversity measured with classic and positional coeffi cient of variation. On the other hand, considering sectors classifi ed in other classes of the return on equity (ROE 2, ROE 3, ROE 4), there is
Branch1 WVAB WAM WKP WPPKO WPKF WZSN WEP ROS ROT ROA MK ROE
10.11 12.5 84.9 23.5 107.4 61.7 99.4 69.9 1.5 2.8 4.0 2.2 8.8 10.12 11.2 86.1 22.5 107.2 71.7 100.0 86.9 1.4 3.4 4.8 2.7 12.7 10.13 14.7 86.1 24.1 119.3 84.8 100.0 89.4 2.8 2.9 7.9 2.1 16.7
10.20 16.2 87.8 29.2 110.7 76.1 99.9 77.7 2.8 1.8 5.0 2.6 13.3 10.41 8.5 73.6 36.2 82.9 55.3 100.1 76.7 0.9 1.8 1.9 2.6 5.1 10.42 19.8 88.5 32.8 106.5 99.1 100.0 76.5 5.0 1.6 8.1 1.4 11.4 10.51 13.7 80.5 21.4 124.0 93.4 100.2 83.2 2.3 2.1 4.7 2.1 10.0
10.52 30.8 87.8 33.4 102.0 86.6 100.0 96.6 7.8 1.9 14.6 2.0 28.9 10.71 31.6 87.6 29.9 106.6 90.4 99.9 91.2 7.3 2.0 14.8 1.9 27.4 10.72 26.7 85.2 27.8 122.6 84.8 100.0 87.4 6.2 1.6 10.5 2.1 21.0 10.73 24.5 84.6 32.3 124.0 92.4 100.0 92.1 7.1 1.4 10.1 1.9 19.4 10.81 31.9 85.9 77.0 98.1 101.8 99.9 81.8 17.1 0.9 15.4 1.7 26.1
10.82 25.5 85.6 26.7 100.0 119.1 100.0 85.0 6.0 1.1 6.5 1.7 10.7 10.83 23.8 79.7 36.3 107.1 85.2 100.0 87.1 5.6 1.3 7.5 1.8 12.9 10.84 26.6 91.8 34.6 101.4 95.2 100.0 82.4 6.7 1.8 11.9 1.9 22.2 10.85 17.4 79.4 7.5 209.4 −55.0 101.7 120.2 −0.7 1.7 −0.9 4.6 −7.2
10.86 25.5 84.9 26.7 108.5 92.7 100.0 81.8 4.7 1.3 5.8 1.8 10.4 11.01 7.7 87.0 26.0 86.6 −27.5 100.0 104.9 0.0 1.7 1.0 3.4 3.6 11.03 12.4 79.7 12.3 328.6 39.8 100.0 121.7 1.0 1.9 1.7 2.3 3.5 11.05 25.2 85.0 43.9 100.1 104.4 100.0 89.2 8.6 2.1 18.3 2.6 48.4 11.07 28.9 83.8 26.2 100.4 94.0 100.1 81.2 5.0 1.0 5.2 1.9 9.9
Source: own calculations based on unpublished data of CSO
110.11 − Processing and preserving of meat (excluding poultry), 10.12 − Processing and preserving of poultry meat,
10.13 – Production of meat, including poultry meat products, 10.20 − Processing and preserving of fi sh, crustaceans and molluscs, 10.41 – Manufacture of oils and fats, 10.42 – Manufacture of margarine and similar edible fats, 10.51 − Operation of dairies and cheese making, 10.52 – Manufacture of ice cream, 10.71 – Manufacture of bre-ad; fresh pastry goods and cakes, 10.72 – Manufacture of rusks and biscuits; preserved pastry goods and ca-kes, 10.73 – Manufacture of macaroni, noodles, couscous and similar farinaceous products, 10.81 – Manu-facture of sugar, 10.82 – ManuManu-facture of cocoa, chocolate and sugar confectionery, 10.83 − Processing of tea and coffee, 10.84 – Manufacture of condiments and seasonings, 10.85 − Manufacture of prepared meals and dishes, 10.86 – Manufacture of homogenised food preparations and dietetic food, 11.01 − Distilling, rectifying and blending of spirits, 11.03 – Manufacture of cider and other fruit wines, 11.05 – Manufacture of beer, 11.07 – Manufacture of soft drinks, production of mineral waters and other bottled waters.
82 2016, XIX, 4
a certain regularity. It depends on the fact that the higher the ROE class, the higher the value added ratio (WVABROE2 = 18.7% < WVABROE3< < WVABROE4 = 24.2%); lower the burden of the depreciation costs (WAMROE2 = 83.1% < WAMROE3< WAMROE4 = 87.7%) and the labour costs (WKPROE2 = 23.6% < WKPROE3 < WKPROE4 = 39.8%) placed on the value added, smaller and decreasing but also of positive signifi cance to the fi nancial performance of other operating activities (WPPKOROE2 = 125.6% < WPPKOROE3< WPPKOROE4 = 114.9%); clearly weaker infl uence of fi nancial activity on profi tability (WPKFROE2 = 82.4% < WPKFROE3 < WKPFROE4 = 97.7%); marginal signifi cance of extraordinary gains and losses (WZSN oscillates around 100%); more benefi cial impact of the tax effect (WEPROE2 = 81.7% <
WEPROE3 < WEPROE4 = 87.4%), stable infl uence of the fi nancial leverage (MKROE2 = MKROE3 = MKROE4 = 2.2%), higher asset turnover (ROTROE2 = 1.9% < ROTROE3 < ROTROE4 = 2.1%), and a signifi cant increase in the rate of return on equity (ROE2 = 9.6% < ROE3 < ROE4 = 29.8%).
Table 4 presents the estimated parameters of the ordered logit model of the return on equity for the food industry sectors, the construction of which includes a set of variables of the proposed ROE system, as well as binary variables representing the categories of enterprise size (W1 – small, W2 – medium, W3 – big). As the reference level the small enterprises sector of the food industry (W1) was adopted. To estimate the parameters of ordered logit models the program STATA 12 was used.
Level of ROE2 ST3 WVAB WAM WKP WPPKO WPKF WZSN WEP ROT MK ROE
ROE 1 very low
1 15.3 76.4 -13.0 188.3 -82.0 98.7 7.0 1.7 2.3 -14.9 2 14.0 78.8 7.4 109.3 37.0 100.0 71.5 1.6 2.5 -0.9 3 45.8 13.5 -670.7 206.9 -455.5 41.7 4,113.7 37.4 160.1 -365.8 4 36.9 7.7 191.2 42.8 126.3 0.1 32.3 26.8 24.3 -862.8
ROE 2 low
1 18.7 83.1 23.6 125.6 82.4 100.0 81.7 1.9 2.2 9.6 2 18.7 83.5 23.1 112.5 79.4 100.0 82.5 1.6 2.2 9.9 3 34.9 5.1 39.9 46.7 48.6 1.5 8.9 38.8 21.7 18.8 4 27.0 3.4 23.0 14.2 11.1 0.1 5.6 30.1 13.6 14.7
ROE 3 medium
1 19.1 83.9 29.9 129.9 88.6 101.3 87.3 2.0 2.2 15.6 2 17.7 84.6 29.8 109.7 87.5 100.0 86.6 1.8 2.2 15.3 3 39.5 4.9 33.5 72.4 17.4 12.0 12.0 38.1 19.9 14.2 4 32.8 3.0 22.2 8.8 8.2 0.0 3.7 30.0 10.0 12.8
ROE 4 high
1 24.2 87.7 39.8 114.9 97.7 100.8 87.4 2.1 2.2 29.8 2 25.5 87.7 36.2 104.5 94.5 100.0 87.2 2.0 2.0 25.1 3 36.0 4.3 31.6 57.4 36.4 7.5 6.7 32.4 51.7 36.9 4 28.1 3.0 24.1 5.9 4.0 0.0 5.2 17.4 15.4 22.9
total
1 19.3 82.8 20.1 139.7 46.7 100.2 65.9 1.9 2.2 10.0 2 18.5 84.2 26.6 107.7 83.9 100.0 84.9 1.8 2.2 12.5 3 42.0 9.0 242.8 147.8 433.3 21.7 224.0 37.6 86.8 321.3 4 34.3 3.8 33.3 11.8 15.2 0.1 6.7 26.7 18.0 55.4
Source: own calculation
1All variables, with the exception of ROT and MK, in %.
2Class ROE: ROE 1 < 6.1%; 6.1% ≤ ROE 2 < 12.4%; 12.4% ≤ ROE 3 ≤ 19.9%; ROE 4 > 19.9%.
3ST – descriptive statistics: 1 – the arithmetic mean, 2 – median, 3 – Classic coeffi cient of variation based on the arithmetic
mean and standard deviation (in %), 4 – positional coeffi cient of variation based on the median and quartile deviation (in %).
Tab. 3: Descriptive statistics of variables in the ROE model by ROE classes (level)1
EM_4_2016.indd 82
83 4, XIX, 2016
On the basis of the Wald test for the signifi cance of parameter estimates there have been found a statistical signifi cance of almost all parameters for the explanatory variables at the signifi cance level of p = 0.05. Only the variables representing the impact of extraordinary gains and losses (WZNS) and the size of the enterprise (W2 – medium-sized enterprises sector) have proven to be insignifi cant (p > 0.05). It should be noted that in the estimated model parameters for the explanatory variables are the same for each j-class of the return on equity, which is due to the a priori adopted assumption of proportional odds (parallel regression assumption). In order to verify this assumption the Brant test and Wolfe and Gould test have been conducted. As indicated by the data in Table 5, the combined Brant and Wolfe and Gould tests for all the parameters are statistically signifi cant (p < 0.05), which indicates a violation of the parallel regression assumption. However, individual tests indicate that responsible for this are two variables, the rate of depreciation costs (WAM), informing about the impact of depreciation, and the labour cost index (WKP), informing about the impact of wage costs on ROE. This means therefore that the rates for these explanatory variables
differ signifi cantly between the pairs of the compared ROE classes. In turn, the parameters for other variables differ considerably less, the least for the WPPKO variable (the rate of other operating revenues and expenses) (p = 0.901), informing about the impact of the so-called other operating activities on ROE.
As a consequence of violation of the assumption of proportional odds (parallel regression, parallel lines), on the subsequent stage of the analysis there have been estimated the parameters of the generalised ordered logit model, which includes a variability of parameters with explanatory variables depending on the ROE class (level).
Presented in Table 6 the generalised ordered logit model is characterised by a very good fi t to the empirical data (McKelvey & Zavoina’s R-square = 0.994, Count R-square = 0.780; pseudo R-square = 0.655) and statistical signifi cance (p < 0.05) of majority of parameters at the explanatory variables. In the fi rst group of comparison of the level of return on equity (ROE 1 to ROE 2, 3, 4), statistically insignifi cant (p > 0.05) have been found parameters for the WAM, WPPKO, WPKF, MK as well as W2 and W3 variables. This means therefore that a very low rate of ROE (ROE 1), in relation to higher
Explanatory variables
Estimation of parameter β^
Standard
error statistics
z – Wald
Signifi cance
p
Odds ratio
exp
(β^ )WVAB 0.233 0.029 8.120 0.000 1.263
WAM 0.134 0.034 3.940 0.000 1.144
WKP 0.148 0.014 10.230 0.000 1.159
WPPKO 0.002 0.001 3.700 0.000 1.002
WPKF 0.057 0.009 6.090 0.000 1.058
WZSN −0.016 0.013 −1.250 0.210 0.984
WEP 0.109 0.017 6.450 0.000 1.115
ROT 2.062 0.272 7.570 0.000 7.860
MK 1.309 0.298 4.400 0.000 3.702
W2 0.413 0.304 1.360 0.175 1.511
W3 0.768 0.337 2.280 0.023 2.155
cut1 36.026 3.590 − − −
cut2 39.989 3.754 − − −
cut3 43.177 3.875 − − −
Source: own calculation
Tab. 4: Results of estimating the parameters of the ordered logit model of the return
84 2016, XIX, 4
rates of ROE (ROE 2, 3, 4), is not determined by the depreciation costs, the effi ciency of other operating activities, fi nancial activities, fi nancial leverage and the enterprise size. On the other hand, considering the subsequent comparison of the ROE level (ROE 1, 2 to ROE 3, 4 and ROE 1, 2, 3 to ROE 4), it may be noticed that irrelevant have proven to be only the parameters at the variables informing about the impact of extraordinary events (WZSN), the infl uence of the tax effect (WEP) and the impact of the size of enterprises (W2, W3).
Analysing the parameters of the generalised ordered logit model in table 6, it can be seen that a very low return on equity (ROE 1), compared to other higher classes (ROE 2, 3, 4), was strongly connected with the value added ratio (WVAB), labour cost index (WKP), the rate of fi nancial revenues and expenses (WPKF), the tax effect ratio (WEP) and asset turnover (ROT). These variables had a positive effect on the possibility to change the lowest class of profi tability (ROE 1) for a higher one (ROE 2, 3 or 4). For example, a unit increase (by 1 pp) of the WVAB variable increases the
chance of food industry sectors with very low profi tability (ROE 1) to move to a higher level (ROE 2, 3, 4) of profi tability (under the ceteris paribus assumption) up to 1.229 times. In contrast, a unit increase of the WKP rises this chance by 1.083 times, WPKF – 1.037 times, WEP – 1.140 times and ROT – even 9.503 times (which is connected with the unit in which the ROT variable is measured). It can therefore be concluded that the reasons for the transition from a very low return on equity should be primarily sought in: improving the ability to create value added, fi nancial expenses reduction, tax optimisation and more productive use of assets.
In turn, comparing the food industry sectors with a very low (ROE 1) and low (ROE 2) level of ROE with sectors with a medium (ROE 3) and high profi tability (ROE 4) it has been noticed that all the explanatory variables (with the exception of WZSN, W2, W3) had a signifi cantly positive effect on the chance to improve the fi nancial situation. This means that a unit increase of these variables rose the chance of transition from low (ROE 1, 2) to high (ROE 3, 4) Explanatory
variables
ROE 1 compared to
ROE 2,3,4
ROE 1 and 2 compared to
ROE 3,4
ROE 1,2,3 compared to
ROE 4
Test statistic
chi^2
Signifi cance p
WVAB 0.2565 0.2347 0.3263 2.090 0.351
WAM 0.0738 0.0612 0.2952 9.990 0.007
WKP 0.0903 0.1547 0.1990 9.400 0.009
WPPKO 0.0007 0.0032 0.0056 0.210 0.901
WPKF 0.0418 0.0413 0.0532 1.360 0.508
WZSN 0.0599 0.0786 −0.0073 1.240 0.537
WEP 0.1565 0.1641 0.0694 5.880 0.053
ROT 2.9737 2.1482 2.7255 1.370 0.503
MK 0.4864 1.4330 1.4890 3.000 0.223
W2 −0.4827 1.1166 0.5691 4.410 0.110
W3 0.7316 1.2705 0.7404 0.750 0.687
constant −39.2560 −48.2120 −60.0090
Brant overall test − − − 79.130 0.000
Wolf-Gould
overall test − − − 54.94 0.000
Source: own calculation
Tab. 5:
Results of estimating parameters of logit models for pairs of the compared groups in the return on equity (ROE) for the food industry sectors and Brant and Wolfe and Gould tests
EM_4_2016.indd 84
85 4, XIX, 2016
categories of the return on equity. Therefore, fundamental capabilities in achieving good fi nancial results measured with the rate of return on equity (ROE 3, 4) should be sought mainly in: stimulating technological progress allowing to achieve a high ratio of the value added to revenue (WVAB); rational investment in fi xed assets and rational management of these assets (WAM); labour productivity growth, reducing unit labour costs and thereby increasing the share of profi ts on sales in the added value (WKP); effective
management of other operating activities (WPPKO); rational policy of fi nancing activities reducing the scale of profi t deceleration caused by fi nancial expenses (WPKF), combined with a reasonable level of fi nancial leverage (MK) and tax optimisation (WEP) and in the increase in productivity of assets (ROT). It may also be noticed that the higher the starting class of the return on equity, the greater the chance of transition to a higher class due to the increase in the aforementioned variables.
Explanatory variables
Estimation of parameter β^
Standard
error statistics
z – Wald
Signifi cance
p
Odds ratio
exp
(β^ )Very low (ROE 1) level of ROE compared to low (ROE 2), medium (ROE 3) and high (ROE 4) ROE level
WVAB 0.206 0.067 3.080 0.002 1.229
WAM 0.117 0.063 1.850 0.064 1.124
WKP 0.080 0.022 3.680 0.000 1.083
WPPKO 0.001 0.001 0.980 0.328 1.001
WPKF 0.036 0.009 4.160 0.000 1.037
WZSN 0.050 0.060 0.830 0.407 1.051
WEP 0.131 0.028 4.610 0.000 1.140
ROT 2.252 0.775 2.910 0.004 9.503
MK 0.543 0.487 1.110 0.265 1.721
W2 −0.140 0.720 −0.190 0.846 0.869
W3 0.871 0.804 1.080 0.279 2.388
constant −37.390 9.371 −3.990 0.000 0.000
Very low (ROE 1) and low (ROE 2) level of ROE compared to medium (ROE 3) and high (ROE 4) ROE level
WVAB 0.309 0.057 5.370 0.000 1.361
WAM 0.116 0.054 2.140 0.033 1.123
WKP 0.242 0.034 7.020 0.000 1.274
WPPKO 0.017 0.003 4.900 0.000 1.017
WPKF 0.059 0.010 5.740 0.000 1.061
WZSN 0.219 0.168 1.300 0.194 1.244
WEP 0.196 0.035 5.570 0.000 1.216
ROT 2.834 0.517 5.480 0.000 17.016
MK 2.145 0.535 4.010 0.000 8.546
W2 0.440 0.506 0.870 0.385 1.553
W3 0.765 0.556 1.380 0.169 2.148
constant −78.676 19.079 −4.120 0.000 0.000
86 2016, XIX, 4
Conclusions
The socio-political transformations connected with the Polish accession to the European Union fundamentally determined the direction and dynamics of structural changes in the national economy. These processes included all sectors, also the food industry, which is one of the largest and most dynamically developing sectors of the Polish economy. The dynamics of changes in the Polish food industry in 2005-2011 is defi nitely confi rmed by a dynamic real increase in output (of over 28%) and value added (of over 37%) as well as over a 100% nominal export growth, indicating a strong competitive position of the domestic food industry on the EU market. Together with the dynamic changes of these economic categories also the determinants of fi nancial condition indicating profi tability changed in a positive way. However, the profi tability level (of sales, assets, equity) was clearly differentiated in the food industry sectors. The proposed in the paper system of decomposition of the return on equity has allowed a multidimensional analysis of profi tability determinants. Its implementation in the food industry sectors, using the logit
regression models of ordered categories, has proven that the reasons for different ROE in the food industry sectors should be primarily sought in the ability to create value added, labour costs, rational management of fi nancial expenses, effi cient use of assets as well as in more aggressive shaping the capital structure, determining the level of fi nancial leverage. In conclusion, the applied in the paper ordered logit model of the return on equity has proven to be a very good tool to assess the signifi cance of the factors affecting the level of ROE rates in the food industry sectors. In addition, the proposed model apart from its applicability also possesses a practical value. It allows to predict probable scenarios of transition from a very low level of the return on equity to more favourable fi nancial results measured with this profi tability category.
References
Bednarski, L. (2007). Analiza fi nansowa w przedsiębiorstwie. Warszawa: PWE.
Bieniasz, A., Czerwińska-Kayzer, D., & Gołaś, Z. (2009). Rentowność kapitału własnego przedsiębiorstw. Ekonomika i Organizacja Przedsiębiorstw, 8, 43-51. Explanatory
variables
Estimation of parameter β^
Standard
error statistics
z – Wald
Signifi cance
p Odds ratio
exp (
β^ )Very low (ROE 1), low (ROE 2) and medium (ROE 3) level of ROE compared to high (ROE 4) ROE level
WVAB 0.399 0.065 6.120 0.000 1.491
WAM 0.327 0.078 4.160 0.000 1.387
WKP 0.241 0.034 7.000 0.000 1.273
WPPKO 0.020 0.004 5.390 0.000 1.020
WPKF 0.104 0.025 4.160 0.000 1.110
WZSN 0.043 0.027 1.610 0.108 1.044
WEP 0.034 0.034 1.000 0.319 1.034
ROT 3.587 0.626 5.730 0.000 36.132
MK 2.396 0.813 2.950 0.003 10.979
W2 0.370 0.651 0.570 0.570 1.447
W3 1.029 0.722 1.430 0.154 2.798
constant −77.863 11.052 −7.030 0.000 0.000
McKelvey & Zavoina’s R2 = 0.994; count R2 = 0.780; pseudo R2 = 0.655
Source: own calculation
Tab. 6: Results of estimating the parameters of the generalized ordered logit model of the return on equity (ROE) for the Polish food industry sectors (Part 2)
EM_4_2016.indd 86
87 4, XIX, 2016
Borooah, V. K. (2001). Logit and probit: Ordered and multinomial models. In Sage University Paper Series on Quantitative Applications in the Social Sciences, 07-138. Thousand Oaks, CA: Sage.
Brant, R. (1990). Assessing proportionality in the proportional odds model for ordinal logistic regression. Biometrics, 46(4), 1171-1178.
Burns, D. C., Sale, T. J., & Stephan, J. A. (2008). A better way to gauge profi tability: systematic ratio analysis using the advanced DuPont model.
Journal of Accountancy, 206(2), 38-42.
Cameron, A. C., & Trivedi, P. K. (2005).
Microeconometrics: methods and applications. Cambridge: Cambridge University Press.
Dudycz, T. (2001). Pomiar efektywności przedsiębiorstwa w stosunku do zainwestowa-nego kapitału. Rachunkowość, 4, 242-248.
Dudycz, T. (2011). Analiza fi nansowa jako narzędzie zarządzania fi nansami przedsiębiorstwa. Wrocław: Indygo Zahir Media.
Gołaś, Z. (2008). Uwarunkowania rentowności kapitału własnego w rolnictwie.
Zagadnienia Ekonomiki Rolnej, 3(316), 60-67. Gołaś, Z., & Paszkowski, S. (2009). Struktura i determinanty rentowności kapitału własnego w rolnictwie krajów Europy Ś rodkowo-Wschodniej. Acta Scientiarum Polonorum, Series Oeconomia, 9(1), 61-72.
Greene, W. H. (2008). Discrete Choice Modeling (NYU Working Paper no. EC-07-07). New York: New York University, Stern School of Business.
Greene, W. H., & Hensher, D. A. (2008).
Modeling Ordered Choices: A Primer and Recent Developments (NYU Working Paper no. 08-26). New York: New York University, Stern School of Business.
Gruszczyński, M. (2010). Mikroekono-metria. Modele i metody analizy danych indywidualnych. Warszawa: Ofi cyna Wolters Kluwer Business.
Hawawini, G., & Viallet, C. (2010). Finance for Executives: Managing for Value Creation
(4th ed.). South-Western Cengage Learning. Hilbe, J. M. (2009). Logistic Regression Models. Boca Raton: Chapman & Hall/CRC Press.
Liao, T. F. (1994). Interpreting probability models: Logit, probit, and other generalized linear models. In Sage University Paper series on Quantitative Applications in the Social Sciences, 07-101. Thousand Oaks, CA: Sage.
Liesz, T. J. (2002). Really modifi ed Du Pont analysis: fi ve ways to improve return on equity.
Retrieved from http://www.sbaer.uca.edu/ research/sbida/2002/Papers/19.pdf.
Long, J. S., & Freese, J. (2006). Regression models for categorical dependent variables using Stata (2nd ed.). College Station, TX: Stata Press Publication.
Maddala, G. S. (1977). Econometrics. New York: McGraw-Hill.
McFadden, D. L. (1974). Conditional logit analysis of qualitative choice behavior. In P. Zarembka (Ed.), Frontiers in Econometrics
(pp. 105-142). Academic Press.
McKelvey, R., & Zavoina, W. A. (1975). Statistical model for the analysis of ordinal level dependent variables. Journal of Mathematical Sociology, 4(1), 103-120. doi:10.1080/002225 0X.1975.9989847.
Rachwał, T., Wiedermann, K., & Kilar, W. (2009). Rola przemysłu w gospodarce układów regionalnych Unii Europejskiej. Prace Komisji Geografi i Przemysłu, 14, 31-42.
Sierpińska, M., & Jachna, T. (2011).
Ocena przedsiębiorstwa według standardów
światowych. Warszawa: PWN.
Sierpińska, M., & Niedbała, B. (2013).
Controlling operacyjny w przedsiębiorstwie. Warszawa: PWN.
Veall, M. R., & Zimmermann, K. F. (1996). Pseudo-R2 measures for some common limited dependent variable models. Journal of Economic Surveys, 10(3), 241-259. doi:10.1111/j.1467-6419.1996.tb00013.x.
Wędzki, D. (2006). Analiza wskaźnikowa sprawozdania fi nansowego. Kraków: Ofi cyna Ekonomiczna.
Williams, R. (2006). Generalized ordered logit/partial proportional odds models for ordinal dependent variables. The Stata Journal, 6(1), 58-82.
Winkelmann, R., & Boes, S. (2006). Analysis of microdata. Berlin and Heidelberg: Springer.
Wolfe, R., & Gould, W. (1998). An approximate likelihood-ratio test for ordinal response models.
Stata Technical Bulletin, 7(42), 199-204.
dr. hab. Zbigniew Gołaś. prof. ULS Poznań University of Life Sciences Faculty of Economics and Social Sciences
zbyszekg@up.poznan.pl
88 2016, XIX, 4
Abstract
PROFITABILITY OF THE FOOD INDUSTRY IN POLAND – AN ORDERED LOGIT
MODEL APPROACH
Zbigniew Gołaś, Izabela Kurzawa
The article addresses the problem of fi nancial determinants of return on equity (ROE) in the food industry in Poland. The analysis was conducted on the basis of the decomposition of the rate of return on sales and in conjunction with the system of indicators linking the return on sales to return on assets and equity. In addition, in order to identify the signifi cance of individual components of the ROE system, ordered logit regression models were estimated.
The proposed in the paper system of decomposition of the return on equity has allowed a multidimensional analysis of profi tability determinants. Its implementation in the food industry sectors, using the logit regression models of ordered categories, has proven that the reasons for different ROE in the food industry sectors should be primarily sought in the ability to create value added, labour costs, rational management of fi nancial expenses, effi cient use of assets as well as in more aggressive shaping the capital structure, determining the level of fi nancial leverage. In conclusion, the applied in the paper ordered logit model of the return on equity has proven to be a very good tool to assess the signifi cance of the factors affecting the level of ROE rates in the food industry sectors. In addition, the proposed model apart from its applicability also possesses a practical value. It allows predicting probable scenarios of transition from a very low level of the return on equity to more favourable fi nancial results measured with this profi tability category.
Key Words: Food industry, Poland, return on equity, system of fi nancial ratios, ordinal regression.
JEL Classifi cation: L66, G3, C52.
DOI: 10.15240/tul/001/2016-4-006
EM_4_2016.indd 88