USING FIRM SURVEYS FOR POLICY
ANALYSIS IN LOW INCOME COUNTRIES
FRANCIS TEAL*
ABSTRACT
In this paper a range of issues are addressed as to how firm level surveys can inform policies to reduce poverty. In understanding how policy impacts on poverty it is necessary to understand the factors that determine the price and demand for labour of varying skills. Three factors matter - the productivity of the firm, its size and the skill composition of the workforce. Each of these factors is examined in this paper drawing on comparative evidence for manufacturing firms in Afi-ica. An overview of the data that has been collected under firm surveys is provided. It is argued that understanding why firms are not creating nearly enough jobs for unskilled workers is the central current problem in development policy in Africa. Firm surveys show the nature of the policy dilemma. Small firms are good at producing jobs per unit of investment but the amount of investment is so low that such j o b creation is far below the rate of growth of the labour force. Further, as j o b creation is concentrated in self-employment and the small firm sector, such jobs are low paid relatively to those in the large scale and public sectors.
INTRODUCTION
This paper is intended to provide a guide as to how f r m based surveys can be used to provide input to policy analysis for low income countries - particularly those in sub-Saharan Africa. In the next section we place these surveys in the context of the other information which enables a view to be formed as to how the process of growth and income generation in an economy is developing. We then focus on the countries which form the basis of the comparisons made in this paper and we outline the type of information that the surveys have sought to collect. We then use the comparative data for five African countries to examine the factors which determine the success of firms in respect to their productivity, investment and exports. A common factor across all these dimensions of firm performance is the importance of the scale on which the firm operates. The possible links between scale and success are then
* Centre for the Study of African Economies, Department of Economics, University of Oxford.
in
et
G
at
ew
ay
u
nd
er
li
ce
nc
e
gr
an
te
d
by
th
e
Pu
bl
is
he
r (
da
te
d
20
12
examined.
In understanding how firm performance links to poverty adjustment two key mechanisms are through the impact of firm growth on labour demand and the impact of the size distribution on the demand for skills. The returns to skills as measured by education are set out.
In the final part of this paper we will consider how results from firm surveys can inform our answers to a range of policy questions:
• How do firm surveys inform policies towards poverty?
• Should policy be concerned with the size distribution of firms in countries?
. How can policy foster firm growth that impacts most effectively on poverty reduction?
. What are the lessons for policy of the links between firm size, productivity, skill composition and growth?
Some of the answers provided are speculative but they are intended to provide an indication as to how firm-based data can be used to answer questions which lie at the core of a policy agenda of growth with poverty reduction.
FIRM SURVEYS IN AFRICA IN CONTEXT: WHICH QUESTIONS CAN ONLY FIRM SURVEYS ANSWER?
To answer that question it is most useful to compare them with the household expenditure data which is now a common feature of the data used in poverty analysis in African countries. From such surveys the factors correlated with differences in per capita expenditures can be identified and the location of the poor established. Some surveys measure income as well as expenditure although this is far from general.
With such data it is possible to link consumption per capita with the occupation of the household head. A comparison of this form for Ghana and Tanzania found that a common factor across both countries was that consumption per capita among the self-employed was loweTi^than that among wage employees but greater than that of farmers, Owens and Teal (2005). Such a breakdown enables us to build a direct link from employment to poverty outcomes. While very extensive use has been made of household consumption data to assess
in
et
G
at
ew
ay
u
nd
er
li
ce
nc
e
gr
an
te
d
by
th
e
Pu
bl
is
he
r (
da
te
d
20
12
both the extent and correlates of poverty, the most recent comprehensive such review being World Bank (2000), understanding these consumption outcomes requires data that enables us to explain incomes. That is where firm-level manufacturing surveys come into play. While wage employment is a small part of total employment it can be argued that the smallness of this role is one of the fundamental factors which limit the size of incomes. So understanding why wage employment is so limited is to understand one of the underlying causes of their poverty.
A recent review of the labour market evidence for sub-Saharan Africa by Kingdon, Sandefiir and Teal (2006) finds that a common pattern, where comparative data is available, is that the number of wage jobs is stagnating or in the case of public sector jobs falling. Given the rapid increase in the labour force the consequence has been either a substantial expansion of urban self-employment activities, the case for Ghana, Tanzania and Uganda, or in some cases, the most conspicuous being urban Ethiopia and South Africa, of unemployment.
Thus from a combination of the expenditure and labour force dimensions of the household expenditure data it is possible to provide an overview of relative welfare (as measured by household per capita consumption) and how occupational structure has changed over time -providing more than one survey is available. In sub-Saharan Africa this data points strongly towards a pattern of income growth by which poverty has been reduced by the shift from rural to urban based employment opportunities. The data also suggest that this shift, within urban areas, has focused on self-employment not on wage employment.
Thus the expenditure data raises a question which firm surveys are required to answer: why has the growth of firms been too slow to provide additional employment opportunities? This is a key question for the poverty reduction growth agenda and leads on to more focused questions about firm performance that can provide a guide as to what the firm surveys need to cover.
. What are the relationships between firm growth, performance and productivity?
• How can the performance of firms be compared?
. Do large firms perform better or worse than small ones and, if so.
in
et
G
at
ew
ay
u
nd
er
li
ce
nc
e
gr
an
te
d
by
th
e
Pu
bl
is
he
r (
da
te
d
20
12
why?
. Which skills are vital for firm success?
The link with policy towards poverty is through the number of jobs, their type and quality and the incomes they generate. The number of jobs will be a function of the number of firms, their size and their growth. Their type and quality will be a function in part of their size and, in part, their skill composition. The incomes that the jobs generate will also depend on the skills demanded by the firms but there is substantial evidence that other aspects of the firm, for example their profitability and their size, also affect wages. The key distinction between firm and expenditure surveys is that firm surveys provide the basis for understanding the composition of labour demand and incomes. If we wish to understand how to change poverty levels we need to understand both the factors determining labour demand and the factors that change incomes.
WHY THE MANUFACTURING SECTOR?
Most of the surveys that have been conducted are of the manufacturing sector. Why do we wish to survey this rather than other sectors? What can we learn from knowing about the activities of the firm rather than the overall performance of the sector? Why carry out detailed surveys?
While there are good reasons for not confining surveys to the manufacturing sector there are reasons why the manufacturing sector is of particular importance and why other sectors may be more difficult. It does appear to be particularly important to understand the processes of firm growth and success in the manufacturing sector. Some of the most important economic successes in the last thirty years have been associated with their ability to export manufactures. The growth in manufacturing output has been a key element in the successful transformation of most economies that have seen sustained rises in their per capita incomes. It is in this area that performance in Africa has been particularly poor. Manufacturing output has been growing slowly if at all and manufacturing exports are negligible. So the performance of the manufacturing sector needs to be understood.
Why firms rather than sectors?
What can we learn from knowing about the activities of the firm
in
et
G
at
ew
ay
u
nd
er
li
ce
nc
e
gr
an
te
d
by
th
e
Pu
bl
is
he
r (
da
te
d
20
12
rather than the overall performance of the sector? As those who have done these surveys, or analysed them, will know there is enormous diversity across the firms in the samples we survey. A sectoral average simply hides this diversity. It is also the case in Africa that most firms are small but produce a much smaller proportion of total output than their numbers so sectoral averages will be dominated by large firms which are atypical of most firms in the sector. With firm level data it is possible to compare across firms within a sector and examine how successful firms compare with unsuccessful ones.
Making comparisons across African countries possible
If we are to examine the factors that make for successful firms we need data that enables us to measure success. Three aspects of success, on which much attention has focused, has been their ability to survive, their ability to grow and their productivity. To be able to measure the first two of these aspects of firm performance requires panel data. To measure the third in a way that enables firm productivity to be compared both across other firms and over time requires firm level price deflators.
Such comparisons have been made possible by a program of work which began in the early 1990s by the World Bank entitled the Regional Program on Enterprise Development (RPED). This work was continued by the CSAE at Oxford and by UNIDO and has resulted in panels of various lengths for four African countries, Ghana, Kenya, Nigeria and Tanzania. The RPED project transmogrified into the Investment Climate Surveys (ICAs) which have been carried out by the World Bank on a very extensive scale across the developing world. While these represent a major extension in terms of coverage most are not panel and the purpose in this paper is to show what only panel data can do. For this paper we have added to the RPED data the South African survey which took place in 1999 and covered large firms (50+ employees) in the Greater Johannesburg Metropolitan Area (GJMA). This survey was undertaken by the World Bank in conjunction with the Greater Johannesburg Metropolitan Council (GJMC). One year of recall data was asked for and thus the South African data covers the period 1997-1998.
In the comparisons that follow the data for output, capital, raw material and indirect costs have been converted to 1991/92 US$ which is the initial period for the data from Ghana, Kenya and
in
et
G
at
ew
ay
u
nd
er
li
ce
nc
e
gr
an
te
d
by
th
e
Pu
bl
is
he
r (
da
te
d
20
12
Tanzania. The initial period for Nigeria is 1998 and for South Africa it is 1997. For Ghana, Kenya and Tanzania the data was first converted to constant domestic prices and then converted to US$ using for Ghana the 1991, and for Tanzania and Kenya the 1992, exchange rate. Throughout the data is for plants.
For Nigeria and South Africa only consumer prices were available to deflate the firm output figures. These were then converted to US$ for 1998 and 1997 respectively. An adjustment was then made to these US$ figures to convert them to 1992 US$ by using the US GDP deflator. The capital stock for all countries except South Africa is accumulated from the investment data.
DATA COLLECTED UNDER FIRM SURVEYS
Clearly our ability to answer any of the questions posed above depends on the data the firm surveys collect. As those who have been engaged in firm surveys know there is always a temptation to add more questions - often with a very specific objective in mind for example to find out if the firms have access to the internet or foreign technology. For a range of issues we want to know the way the firm is managed and the nature of the technology used. In this paper it is argued that such data would be more usefiil if thought is given to making firms comparable over time and to making very different types of firm comparable at a point in time. The stress which has arisen since the RPED project was undertaken on comparative cross-section data is clearly valuable but is seriously incomplete for reasons which will be outlined below.
A typical questionnaire will have the following sections or modules:
Section 1 General information Section 7 Financial Markets Section 2 Entrepreneur Section 8 Infrastructure Section 3 General Firm Section 9 Adjustment
Section 4 Investment Section 10 Investor confidence Section 5 Labour Section 11 Networks
Section6 Government „ .. ^ , . Section 12 Governance Regulation
It will be rare for all modules to be implemented for each survey. However some of the elements of the questionnaire are of key
in
et
G
at
ew
ay
u
nd
er
li
ce
nc
e
gr
an
te
d
by
th
e
Pu
bl
is
he
r (
da
te
d
20
12
importance for each round if comparative data is to be created. The key sections that allow a quantitative comparison across firms are those containing the general firm information (revenues, outputs and costs), investment, labour and finance. These sections make it possible to see how firms have changed over time in terms of productivity, size and investment if a panel is created. In this case the general firm sections need to address issues as to how firm-level prices can be created so that comparisons can distinguish between changes in real output, inflation and market power.
It was the case with the original RPED survey that a labour module was implemented at the same time as the firm questionnaire. In the case of some countries a distinction within these surveys is made between workers and apprentices. This labour market questionnaire covered the following broad areas:
• Education, Training and Work History of the worker/apprentice. • Eamings including both basic wages and allowances.
• Parental Background. • Hours of work.
• Search behaviour when unemployed.
• Preferences between employment and self-employment.
As will be shown below the existence of a labour market questionnaire carried out in parallel with a firm survey allows a range of issues related to the skill intensity of the firms and the extent of the demand for educated labour by firm size to be investigated.
USING FIRM SURVEYS TO UNDERSTAND FIRM SUCCESS AND FAILURE WITHIN AFRICA
An extensive range of comparisons has been carried out across these firm surveys and in this section a brief overview of some of the key findings will be given. More formal analysis of the data reported here can be found in studies of firm-level investment in Ganguly (2004) and in the determinants of exports in Rankin (2004). Malik, Teal and Baptist (2006) provide a detailed discussion of the Nigerian data. Bigsten and Soderbom (2006) provide a review of the main comparative studies three of which we will use extensively below, Bigsten et al, (2000, 2004) and Rankin, Soderbom and Teal (2006).
The objective is in part to provide a basis for extending these
in
et
G
at
ew
ay
u
nd
er
li
ce
nc
e
gr
an
te
d
by
th
e
Pu
bl
is
he
r (
da
te
d
20
12
comparisons. It would for example be very important if a firm survey found striking differences from those documented here as that would indicate that something was very different in the economy. As we will see across the comparisons on which this paper draws South Africa stands out as in many ways very different from the other countries.
We consider the findings of the surveys for productivity, investment and exports. A common theme across these dimensions of firm performance is the importance of scale in the activities undertaken by the firms. As we will show large firms are very different from smaller ones but that does not imply that returns to scale are of importance for understanding how these firms change as they change in size. Why scale matters and how it relates to returns to scale will be considered below.
Productivity
We now turn to look at comparative data for five African countries: Ghana, Kenya, Nigeria, South Africa and Tanzania. What are the common factors and differences both across countries and across types of firm? For the moment the answers presented will be simply descriptive.
We present comparisons across countries and those based on a size classification of firms. In most of the comparisons that will follow a large firm is defined as one with more than 75 employees, medium have from 21 to 75 and small less than 21 employees. Fig. I shows in the top part of the chart how labour productivity (gross output per employee) varies across countries and within countries by the size of firm. The bottom part of Fig. 1 shows a similar breakdown for capital per employee. Two features of the Fig. are striking. The first is the common fact across all the countries that both labour productivity and capital per employee increase as firm size increases. The second is that the labour productivity differential in South Africa is far greater that is the differential in capital per employee. This finding points to the higher measured total factor productivity (TFP) for South Africa that we will find below.
While both labour productivity and capital per employee rise with firm size this does not necessarily imply there are increasing returns to scale. We will see below if the data suggests that returns to scale are an important feature of these firms. The sample for South Africa
in
et
G
at
ew
ay
u
nd
er
li
ce
nc
e
gr
an
te
d
by
th
e
Pu
bl
is
he
r (
da
te
d
20
12
contains no small firms so we cannot know if the pattern we observe for small firms is a common one across all the countries. However for four countries what is striking about small firms is just how low are both their labour productivity and their capital per employee. In Ghana and Tanzania output per employee is only just over US $2,000 (in 1991/92 prices) and the capital per employee is well below US$ 1,000 (in 1991/92 prices).
Median Labour Productivity in US$ (1991/92 prices)
Large GHANA Medium
Small Large KENYA Medium
Small
NIGERIA Medium Small
SOUTH AFRICA Large
Medium Large TANZANIA Medium
Small
0 10,000 20,000 30,000 40,000 Note: Labour productivity is defined as Gross Output per Entpioyee.
Median Capital per Employee in US$ (1991/92 prices)
Large GHANA Medium
Small
Large KENYA Medium
Small
Large NIGERIA Medium
Small
SOUTH AFRICA Large
Medium
TANZANIA Medium Small
•mmm
1 B
5,000 10,000 15,000 20,000
Figure 1. Labour Productivity and Capital per Employee by Firm Size Note: A large firm is one with more than 75 employees, medium have from 21 to 75 and small less than 21 employees. Median figures are reported so that the results are not dominated by outliers. In fact the exponent of the mean of the logs used in the regressions reported below is close to the median figures given in this Figure.
in
et
G
at
ew
ay
u
nd
er
li
ce
nc
e
gr
an
te
d
by
th
e
Pu
bl
is
he
r (
da
te
d
20
12
Clearly to set up firms with such low amounts of capital does not require substantial investments. While large firms have many times this amount of capital their median, excluding South Africa, is US$ 10,000 (at 1991/92 prices) which again is very small by international standards. These firms are small in many dimensions.
In Figure 2 we bring together the results from Fig. 1 to show in the top part of Fig. 2 both labour productivity and capital per employee. It is the gap between these numbers which determines in large part the measure of TFP which will emerge from the data. Anticipating the results from the production ftinction estimates of Table 1 we show in the bottom part of Figure 2 the differences in TFP across countries. Possibly unsurprisingly South Africa emerges as with far the highest TFP. Possibly more surprisingly Nigeria is second and Ghana is third. The country with the lowest TFP is Tanzania. We come to the implications of these numbers below.
The empirical measure of TFP shown in the right hand side of Fig. 2 requires us to estimate a production ftinction and to do so requires that a large number of econometric problems have to be confronted. For the moment we are simply going to side-step them and treat OLS estimation as a form of descriptive statistics. Table 1 shows an OLS regression for a gross output and value-added production ftanctions, for labour productivity and firm size measured by the natural log of employment. Re-stating that these are simply descriptive statistics, what do we find?
Labour Productivity and Capital Intensity in US$ (1991/92 prices)
40,000-
30,0002 0 , 0 0 0
-
10,000-GHANA KENYA NIGERIA SOUTH AFRICA TANZANIA
I Median Output per Employee BSMtl Median Capital per Employee |
in
et
G
at
ew
ay
u
nd
er
li
ce
nc
e
gr
an
te
d
by
th
e
Pu
bl
is
he
r (
da
te
d
20
12
Figure 2. Productivity across Countries and by Firm Size
Using the gross output specification there is no evidence for returns to scale. Using the value-added specification there are mildly increasing returns to scale, some 7 percent. Both exporting and foreign ownership are associated with higher TFP although the effects are modest, about 30 percent in the value-added specification. However firms that export or are foreign owned are about 3 times larger than either those with domestic owners or those which do not export.
It is also the case that while older firms are not more productive they are bigger. How do the comparisons across countries pan out?
The result that TFP is higher in Nigeria than Ghana might seem surprising as all measures of infi-astructure that we have on a comparable basis strongly suggest that infrastructure is far worse in Nigeria than Ghana (see Malik, Teal and Baptist (2006) and Malik and Teal (2008)). Within the context of East Africa Kenyan firms appear to have higher TFP than Tanzanian ones although the difference is not great, some 7 percent in terms of gross output and about 23 percent in terms of value-added. This difference might seem small in the light of the history of the attempts to set up an East African Economic Community, attempts which have always failed on the perception that Kenyan firms will always be able to out- compete either Tanzanian or Ugandan ones.
in
et
G
at
ew
ay
u
nd
er
li
ce
nc
e
gr
an
te
d
by
th
e
Pu
bl
is
he
r (
da
te
d
20
12
Table 1. Production Functions and Productivity
k l ) (2) 3 ) (4)
Ln (Output/ Ln (Value-added/ Ln Output/ Ln
Employee) Employee) Employee) ^Employment)
Ln (Capital/ 0.045 0.257 Employee) (6.72)*» (15.31)** Ln (Raw Materials/ 0.645
Employee (36.09)** Ln (Indirect Costs/ 0.171 Employee :i4.33)*»
Ln (Employment) 0.012 0.066 (1.51) (2.63)**
Kenya -0.060 0.212 0.670 •0.058
(2.02)* (2.55)* (7.58)** (0.52)
Tanzania -0.129 -0.244 -0.068 -0.270
(5.28)** (3.05)** (0.79) (2.49)*
Nigeria 0.048 0.399 1.090 0.479
(1.17) (3.57)** (9.13)** (3.57)**
South AfHca 0.356 1.732 2.074 0.961
(8.09)** (15.68)** (19.59)** (7.53)** Dummy =1 if Firm Exports 0.071 0.229 0.560 1.174
(2.70)** (3.31)** (7.43)** (12.11)** D u m m y = l if Any Foreign 0.058 0.328 0.655 0.988 Ownership (1.99)* (3.94)** 7.66)** (8.72)**
Firm Age 0.001 0.001 0.004 0.019
(1.23) (0.25) (1.78) (6.23)**
Foods 0.017 0.239 0.652 0.241
(0.49) (2.67)** (6.42)** (1.90)
Textile -0.099 -0.472 h0.250 0.942
(2.75)** (3.93)** (2.18)* (4.81)**
Garment 0.051 -0.244 -0.796 -0.754
(1.71) (2.71)** (7.67)** (6.69)**
W o o d -0,039 -0.573 -0.645 0.258
(0.96) (5.02)** (5.11)** (1.64)
Furniture 0.025 -0.195 -0.537 0.048
(0.84) (2.24)* (6.22)** (0.45) Textile and Garment (South -0.088 -0.367 -0.800 0.050
Africa) (0.97) (2.42)* (6.60)** (0.16)
Constant 2.169 5.172 8.178 2.420
(18.26)** (28.76)** (64.48)** (17.28)**
Observations 4374 4211 4374 4374
R-squared 0.92 0.48 0.46 0.43
Robust t statistics in parentheses * significant at 5%; significant at 1%
Tig\e dummies are included in the regression but not reported
So far we have been interpreting the resuhs of Table 1 as descriptive statistics as the equations use only OLS. The well trained economist is going to object strongly to discussing such results on the
in
et
G
at
ew
ay
u
nd
er
li
ce
nc
e
gr
an
te
d
by
th
e
Pu
bl
is
he
r (
da
te
d
20
12
grounds that the bias in these estimates is likely to be serious. Such may well be the case. SOderbom and Teal (2004) investigate these issues in detail for the Ghana data which has the longest panel element of any of the comparative data sets. Their estimates which allow for endogeneity are remarkably close to the OLS estimates. In fact in their paper there is little evidence that endogeneity is a major issue when it comes to assessing the OLS results. How can that be the case? The answer to that may well be the extent of factor market fragmentation. If these firms do face very different factor prices then their choices are given by those prices and the endogeneity issues that arise in identifying production functions where they all face similar prices do not arise. That is speculation but it suggests that the OLS estimates may well be more than simply descriptive, they may well be causal.
Our discussion of TFP clearly does hinge on the validity of OLS in driving the results reported. Putting to one side this issue and, for the moment, accepting the OLS estimates should we be surprised at the TFP results. Is it possible that Nigeria has a higher TFP than Ghana? What is clear from the work on the Nigerian data is that firms adjust to the problems posed by the inadequate supply of public infrastructure by investing in their own supply. This will appear in the data as additional capital. The problem appears not as a low level of TFP but as "too much" capital. Too much relative to what it could be if public sector supply were more efficient. In the Nigerian case we may suspect large capital stocks are "bad" news for the efficiency with which firms in Nigeria can compete with other countries. In the case of Kenya it may well be that they are "good" news. It is striking in Fig. 1 above that large firms in Kenya have much higher levels of capital per employee than large firms in Tanzania, well over 50 percent more. If this is capital necessary for exporting then that Kenyan firms can outperform others is not to do with any TFP advantage but that there are more firms with the capital stock necessary to export in Kenya than the other countries. While that does, of course, raise the question as to how firms do invest and why they can export it also points to the possibility of other factors than TFP in explaining why firms in other countries cannot compete with Kenyan ones. What is the evidence for investment and exporting?
in
et
G
at
ew
ay
u
nd
er
li
ce
nc
e
gr
an
te
d
by
th
e
Pu
bl
is
he
r (
da
te
d
20
12
Investment
In Figure 3(a) we show the data for investment (Detailed analysis of this data can be found in Ganguly (2004)). A striking fact about the pattern of investment in all the firms in the sample across all the countries is that, in any year, many firms cany out no investment. Again firm scale is a key factor in this outcome. Large firms across all the countries are far more likely to invest. This pattern is reversed for most countries when we view investment as a proportion of capital, conditional on any investment. The outcome of this pattern of investment is that the actual investment to capital ratio is very similar across the size range, and of great importance for assessing success, very low. In nearly all countries, across the whole size range, investment as a proportion of capital is 10 percent or less.
Exporting
We now turn to exporting across our African countries (Detailed analysis of this data can be found in Rankin (2004)). Fig. 3(b) shows the data. We make a distinction not only by size but also by whether or not the firms exports within or outside of Africa. Some do both. We find a clear pattern by which larger firms are far more likely to export. In the case of Kenya and South Africa among large firms 60 percent or more export to other African countries. In the case of Ghana export orientation to the international market is greater than for the African market for large firms. We also show how much of output is exported if firms do enter the export market.
Again Ghana is something of an exception to the general pattern by which this percentage is generally low, below 40 percent of output. It is striking that with the exception of Ghana for all the other countries and for all size categories the average amount of output exported is 10 percent or less. It is in this area that evidence of failure seems most conclusive.
SCALE AND SUCCESS
Size and success
In summary: larger firms have higher labour productivity, are more likely to invest but given undertaking any investment they invest a smaller proportion of their capital stock and they are much more likely to export. Some of these attributes, in particular higher labour productivity and a greater propensity to export, might well be thought
in
et
G
at
ew
ay
u
nd
er
li
ce
nc
e
gr
an
te
d
by
th
e
Pu
bl
is
he
r (
da
te
d
20
12
part of "good" performance.
P e r c e n t a g e of F i r m s I n v e s t i n g
Large GHANA Medium
Small Large KENYA Medium
Small L a r g e NIGERIA Medium
Small
SOUTH AFRICA Large
Large TANZANIA Medium
Small
I n v e s t m e n t t o C a p i t a l R a t i o : C o n d i t i o n a l o n I n v e s t i n g
Large GHANA Medium
Small Large KENYA Medium
Small Large NIGERIA Medium
Small
SOUTH AFRICA Large
Large TANZANIA Medium
Small
I n v e s t m e n t t o C a p i t a l R a t i o Large
GHANA Medium Small Large KENYA Medium
Small Large NIGERIA Medium
Small
SOUTH AFRICA Large
Large TANZANIA Medium
Small
Figure 3(a) Investment across Countries and by Firm Size
in
et
G
at
ew
ay
u
nd
er
li
ce
nc
e
gr
an
te
d
by
th
e
Pu
bl
is
he
r (
da
te
d
20
12
Percentage of Firms Exporting to Africa and Outside of Africa
Large G H A N A M e d i u m
Small L a r ^ e K E N Y A M e d i u m
S m a l l Large NIGERIA Medium
Small S O U T H A F R I C A
Large T A N Z A N I A M e d i u m
Small
I To Africa ] T o Outside of Africa
Percentage of Output Exported, Conditonal on Any Exporting
Large G H A N A Medium
Small
K E N Y A Medium Small Large N I G E R I A Medium
Small S O U T H A F R I C A
Large T A N Z A N I A Medium
Small
Percentage of Output Exported
Large G H A N A M e d i u m
Small Large K E N Y A Medium
Small Large N I G E R I A Medium
Small
S O U T H A F R I C A Large
Medium Large T A N Z A N I A Medium
Small
To Outside of Africa
Figure 3(b). Exporting across Countries and by Firm Size
Note: A large firm is one with more than 75 employees, medium have from 21 to 75 and small less than 21 employees. Median figures are reported so that the results are not dominated by outliers.
in
et
G
at
ew
ay
u
nd
er
li
ce
nc
e
gr
an
te
d
by
th
e
Pu
bl
is
he
r (
da
te
d
20
12
We need however to be careful when interpreting these attributes as indicators of firm success.
Higher labour productivity can result from more capital intensity and it is far from obvious that that is desirable. Exporting may be an extension to regional markets as firms grow in size rather than indicative of an ability to compete successfully in a global economy. Alternatively firms may be subsidised to enter export markets by policies which give them inputs at below the world price. That is not to deny that policies which promote growth and exports may not be beneficial it is simply to caution that having higher labour productivity or exporting more is not necessarily indicative of a successful firm.
What do the findings imply about how policies which promote small firms will impact on outcomes? To answer that question we need to assume that the newly created small firms will be like those that already exist. If we are ready to assume that then we know that more small firms means:
• (Much) higher returns to capital. • Lower wages.
• More jobs per unit of investment.
• Lower demand for relatively educated labour.
These four dimensions of firm outcomes which are correlated with size are shown in Fig. 4 and 5. We consider each in turn.
Firm size and returns to capital
As Fig. 4 shows the median return to capital is much larger in small than large firms. The data imputes the return to capital based on the profits and the value of the capital stock derived from the surveys. The return to capital is simply profits divided by the value of the capital stock. The implication of the data shown in Fig. 4 is that these profit rates for small firms range from 50 to over 100 percent per annum. What can account for this finding? One explanation is that the constraints on these firms in the capital market ensure that they face very high capital costs. What the data is showing is that these constraints in the lending market are turning up as very high return on what little capital small firms have been able to invest.
in
et
G
at
ew
ay
u
nd
er
li
ce
nc
e
gr
an
te
d
by
th
e
Pu
bl
is
he
r (
da
te
d
20
12
Rates of Return on Capital by Firm Size Across Countries
Large
Medium
Small
GHANA KENYA NIGERIA TANZANIA SOUTH AFRICA GHANA KENYA NIGERIA TANZANIA SOUTH AFRICA
GHANA KENYA NIGERIA TANZANIA
0 .5 1 Median Rate of Return on Capital Note: a small firm is on employing less lhan 20 people, a medium firm has from 20 to 75 and a large lirm employs more than 76.
Wages for Production Workers for Firms of 5, 50 and 200 Employees
NIGERIA
TANZANIA 50
40 60 80 US$ per month
Note: These wagea are imputed from en eaatings funcfnti wrtf\ cotitrola tot geiMtet, eflucalion, ape and lanure.
F i g u r e 4. R e t u r n s o n Capital a n d W a g e s b y F i r m Size
Lower wages
The mirror image of the inverse relationship between the cost of capital and firm size is the rise in wages with firm size shown in the right of Fig. 4. The wages shown in the Figure are imputed from an earnings function which controls for the human capital characteristics of the workers, in particular their age, education and tenure in the firm. The sample used in the figure is confined to production and support workers so the rise in wage shown across firm size for all the countries for which we have comparative data is not a function of differences in either observed skills or occupational structure.
More jobs per unit of investment
The finding that capital per employee rises with firm size which
in
et
G
at
ew
ay
u
nd
er
li
ce
nc
e
gr
an
te
d
by
th
e
Pu
bl
is
he
r (
da
te
d
20
12
was shown in Fig. 1 implies that any given amount of investment will generate more jobs in smaller firms. In the top part of Fig. 5 we illustrate how important this effect is using Nigeria as an example, although Fig. 1 implies the pattern will be the same for all our countries in this sample. Malik, Teal and Baptist (2006) provide a detailed discussion of this issue of job creation in the Nigerian context.
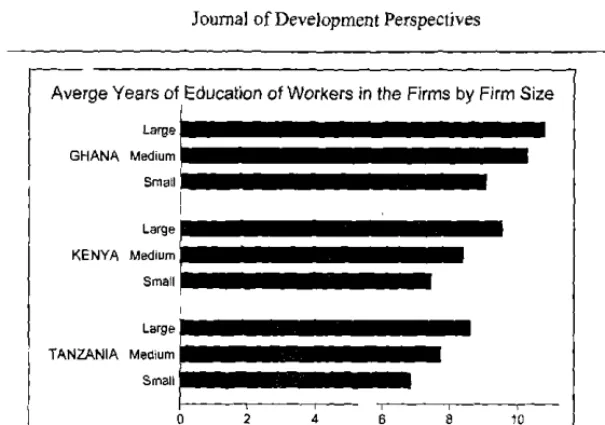
Lower demand for educated labour
The bottom part of Fig. 5 shows the final implication of changes in the size structure of firms. This is our first example where the ability to link labour market questionnaires with firm surveys can be shown to be informative.
The human capital stock of the firm is difficult to measure. The measure shown in Fig. 5 uses the answers to the labour market questionnaire to obtain a measure of the total years of education of the worker. This is then averaged across occupations and scaled up to a firm level based on information as to the percentages of workers by occupation. As can be seen across the three countries for which this information is available - Ghana, Kenya and Tanzania - there is a uniform pattern by which the average level of education of the workforce increases with firm size.
Number of Jobs Created for US$100,000 by Firm Size
1 0 0 1
80-60 H
40-
20-Micro Small Medium Large Very Large
Note: A micro firm is one employing less than six worlters. small is from 6 to 20. medium is from 21 to 75, large is from 76 to 1&9,and very large is greater that 200
in
et
G
at
ew
ay
u
nd
er
li
ce
nc
e
gr
an
te
d
by
th
e
Pu
bl
is
he
r (
da
te
d
20
12
Averge Years of Education of Workers in the Firms by Firm Size
Large I
GHANA Medium 1 Small I
Large | KENYA Medium j Small
Large I
TANZANIA Medium I Small I
10
Figure 5. Jobs and Skills by Firm Size.
What are the links from scale to success?
Our focus has been on the links because scale and outcomes. Surely, it will be argued, size cannot be causal. Size is simply correlated with some variable which we should be concerned with -unobserved skill in the case of wages, constraints in the credit market in the case of the costs of capital, capital-skill complementarity in the case of skills, efficiency in the case of exports. Focusing on scale is to confuse the outcome with the cause.
Table 2. Eamin gs Function Estimates: No Controls for Fixed Effects
Ghana Kenya
(1) (2) (3) W
Education (years) 0.083 0.067 0.104 0.086
( 1 6 . 6 4 ) " (15.57)** (11.60)** (9.86)* *
Tenure / 1 0 0.031 0.015 0.001 -0.024
(0.94) (0.S7) (0.02) (0.71)
Age 0.066 0.040 0.047 0.030
( 7 . 5 4 ) " (4.SS)" (4.08)** (2.85)**
A g e V l O O -0.056 -0.030 -0.030 -0.011
( 5 . 1 5 ) " ( 2 . 8 9 ) " (2.06)* (0.78)
Male 0.193 0.155 0.087 0.090
( 3 . 8 6 ) " ( 3 . 4 5 ) " (1.77)" (1.91)"
Jn Employment 0.212 0.101
(9.88)** (4.87)**
Observations 5074 5074 2656 2656
R-squared 0.38 0.47 0.32 0.35
in
et
G
at
ew
ay
u
nd
er
li
ce
nc
e
gr
an
te
d
by
th
e
Pu
bl
is
he
r (
da
te
d
20
12
Note: The dependent variable is the logarithm of monthly earnings, expressed in USD. The estimation method is OLS. A constant and dummy variables for time and location in the capital city are included in all regressions. The numbers in ( ) are ^-statistics based on standard errors robust to heteroskedasticity and intra-firm correlation. Significance at the 1 percent, 5 percent and 10 percent level is indicated by *, ** and respectively.
While it is clear that size cannot be causal in a policy relevant sense (except possibly where governments hire or fire their workers) what size is proxying is important both to understand why firms of different scale perform so differently and what are the implications of trying to intervene in the market. We are now going to consider two examples where panel data enables us to narrow down the source of this correlation between size and outcomes. The first investigates the link between firm size and wages, the second the links between exporting and firm size.
Firm size and wages
The finding that earnings rise with firm size is open to a very wide range of interpretations. If large firms hire more productive individuals than small firms and individual ability is imperfectly captured by the observable controls of education and work experience then the size-wage result is consistent with a human capital model, where human capital is now interpreted to include the unobservable skills of the workers, and competitive labour markets. In this case, with appropriate controls for such unobserved skills, the size effect will be insignificant. In contrast, if there are "structural" reasons for the size-wage relation, e.g. higher monitoring costs in large firms or job matching with search costs there will be a significant size effect
conditional on unobserved skills.
Testing for a size effect on earnings whilst conditioning on the full set of labour skills is difficult, especially with cross-section data. Progress on the matter can be made with panel data on employees and firms, as this enables researchers to control for all time invariant unobserved characteristics. Tables 2 and 3 are taken from Soderbom, Teal and Wambugu, (2005) to show how it is possible to go beyond the cross-section, shown in Table 2, to using the panel to investigate if the size effect can be explained by the time-invariant unobservables.
21
in
et
G
at
ew
ay
u
nd
er
li
ce
nc
e
gr
an
te
d
by
th
e
Pu
bl
is
he
r (
da
te
d
20
12
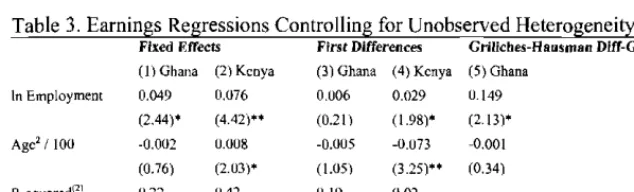
While it appears that the cross-section does over-state the importance of size there remains an effect once we do allow for the fixed effects. For Ghana, where we can allow for measurement error once the data is differenced, we find that the effect of log employment on log earnings goes from 0.21 in the cross section (Table 2, column (2)) to 0.15 in the panel (Table 3 column (5). Thus this effect remains quite large.
Table 3. Earnings Regressions Controlling for Unobserved Heterogeneity Fixed Effects First Differences Griliches-Hausman Diff-GMM'"
(1) Ghana (2) Kenya (3) Ghana (4) Kenya (5) Ghana In Employment 0.049 0.076 0.006 0.029 0.149
(2.44)* (4.42)** (0.21) (1.98)* (2.13)* A g e V l O O -0.002 0.008 -0.005 -0.073 -0.001 (0.76) (2.03)* (1.05) (3.25)** (0.34) R-squared"' 0.22 0.42 0.19 0.02
J-test (p-value)P' 0.60
Note: The dependent variable is the logarithm of earnings. The numbers in () are absolute values of t-statistics. Significance at the 1 percent, 5 percent and 10 percent level is indicated by **, * and respectively. Time dummies are included in all regressions.
These are one-step G M M estimates. Age squared is treated as an exogenous variable, while the instruments for differenced firm size
ifijt - fij,i-T^ = 1 , 2 , - , 5 . See paper for details.
For (1) and (2) this is the within R-squared.
This is the Sargan-Hansen test for the validity of the overidentifying restrictions. The test statistic is equal to 15.90 and there are 18 degrees of freedom.
Firm size and exporting
There is a finding across virtually all micro firm-level data sets that exporting and efficiency are positively correlated. Much work has focused on how this correlation is to be interpreted. Work on countries outside of Africa has found more evidence that causation runs from efficiency to exporting - there is self-selectivity into exporting - rather than from exporting to efficiency - implying firms learn from exporting. For sub-Saharan Africa Bigsten et al, (2004) present evidence for sub-Saharan Africa firms of learning by exporting.
While the focus of much of the literature to date has been on
22
in
et
G
at
ew
ay
u
nd
er
li
ce
nc
e
gr
an
te
d
by
th
e
Pu
bl
is
he
r (
da
te
d
20
12
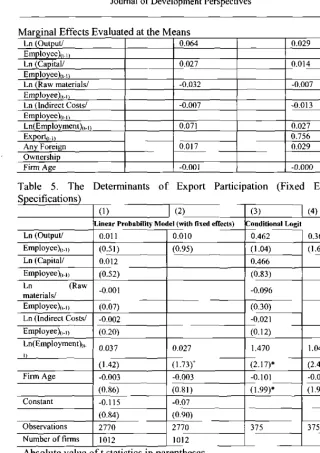
distinguishing learning from exporting and self-selection into exporting a common finding across all the work on African firms has been a strong correlation between firm size and exporting, Bigsten et ai, (2004), and van Biesebroeck (2005). The finding in Bigsten et al, (2004, page 128) is that firm size is a robust determinant of export participation across specifications which allow for certain forms of firm heterogeneity and dynamics. In Rankin, Soderbom and Teal (2006) the data set which has been summarised in this paper has been used to assess the relative importance of self-selection based on efficiency and firm size as determinants of export participation.
Tables 4 and 5 are taken from that paper (see also Rankin (2004)). As they show, once we allow for fixed effects the relationship between size and exporting is relatively clear in the data while the relationship between exporting and efficiency is not.
Table 4. The Determinants of Export Participation (the LPM and Probit
(1) (2) (3) (4)
Linear Probability
Model (LPM) Probit
Random Effects
Probit Dynamic Probit
Ln (Output/ 0.066 0.303 0.425 0.185
Employee),,.,, ( 3 . 1 7 ) " ( 2 . 9 9 ) " ( 2 . 7 5 ) " (1.58)
Ln (Capital/ 0.017 0.129 0.211 0.088
Employee),,.,) (2.40)* (3.06)** ( 3 . 6 3 ) " (2.57)*
Ln (Raw materials/ -0.033 -0.154 -0.129 -0.046
Employee),,.,) (2.08)* (2.06)' (1.11) (0.56)
Ln (Indirect Costs/ -0.011 -0.035 -0.083 -0.083
Employee),,.,) (1.17) (0.69) (1.17) (1.63)
Ln(Employment)(,.,) 0.076 0.336 0.652 0.170
( 8 . 4 1 ) " ( 7 . 6 6 ) " (9.47)** ( 3 . 6 7 ) "
Export,,.,) 2.729
( 2 6 . 1 4 ) "
Any Foreign 0.032 0.079 0.307 0.171
Ownership (0.91) (0.61) (1.47) (1.44)
Firm Age -0.001 -0.003 -0.003 -0.002
(0.76) (0.77) (0.50) (0.68)
Constant -0.410 -4.843 -8.729 -4.825
(5.01)*» ( 9 . 3 2 ) " ( 8 . 4 4 ) " (8.28)**
Observations 2770 2770 2770 2770
R-squared 0.36
Number of firms 1012
Robust t statistics in parentheses " significant at 5%; • • significant at 1%
in
et
G
at
ew
ay
u
nd
er
li
ce
nc
e
gr
an
te
d
by
th
e
Pu
bl
is
he
r (
da
te
d
20
12
Marginal Effects Evaluated at the Means
Ln (Output/ 0.064 0.029
Employee)!,. 1)
Ln (Capital/ 0.027 0.014
Employee),,-!)
Ln (Raw materials/ -0.032 -0.007
Employee),,.,)
Ln (Indirect Costs/ -0.007 -0.013
Employee),,.,)
Ln(Employment)„.i) 0.071 0.027
Export,,.,) 0.756
Any Foreign 0.017 0.029
Ownership
Firm Age -0.001 -0.000
Table 5. The Determinants of Export Participation (Fixed Effects
(1) (2) (3) (4)
Linear Probability Model (with fixed effects) Conditional Logit
Ln (Output/ 0.011 0.010 0.462 0.362
Employee),,.,) (0.51) (0.95) (1.04) (1.66)
Ln (Capital/ 0.012 0.466
Employee),,.,) (0.52) (0.83)
Ln (Raw
materials/ -0.001 -0.096
Employee),,.,) (0.07) (0.30)
Ln (Indirect Costs/ -0.002 -0.021
Employee),,.,) (0.20) (0.12)
Ln(Employment)(,.
11 0.037 0.027 1.470 1.049
(1.42) (1.73)" (2.17)* (2.44)*
Firm Age -0.003 -0.003 -0.101 -0.088
(0.86) (0.81) (1.99)* (1.94)
Constant -0.115 -0.07
(0.84) (0.90)
Observations 2770 2770 375 375
Number of firms 1012 1012 Absolute value of t statistics in parentheses
+ significant at 10%, * significant at 5%; ** significant at 1%
The standard errors underlying the t statistics reported in columns (1) and (2) are robust to heteroscedasticity and clustering at the firm level.
The relative importance of these factors is of importance for understanding the factors that determine the export behaviour of
in
et
G
at
ew
ay
u
nd
er
li
ce
nc
e
gr
an
te
d
by
th
e
Pu
bl
is
he
r (
da
te
d
20
12
African firms. African firms are in general very small and the focus of small firms on the domestic market ensures that, in aggregate, their growth is limited by the growth of domestic incomes. If size is related to a firm's participation in the export market this may reflect a strategy of successfiil growth - limited domestic demand ensures that the only way for firms to expand is for them to grow into the export market. The finding in the paper that changes in firm size, measured
as the log of employment, change the probability of a firm
participating in the export market in the fiiture is clearly consistent with that interpretation.
WAGES AND EDUCATION
So far we have only used the labour market data to provide a measure of the total human capital in the firm. In this section we show how it can be used to assess how far the returns to education differ depending on its level. Fig. 6 uses the individual labour market data across four countries - Ghana, Kenya, Nigeria and Tanzania - to show how wages are related to education.
There is a remarkable common pattern across all these countries by which the returns to education rise with its level. What does this imply about education and wages? We see across all the four countries that the increase in wages with education up to junior high school (ie from 0 to 10 years) is very modest. After this point wages rise steeply particularly in Ghana and Kenya. In Ghana they more than triple while in Kenya they more than double. The Figure controls for other aspects of human capital so this Figure seeks to isolate the effect of education on wages. The pattern shown in the Figure appears to contradict the frequently expressed view that the returns to education are concave (see Psacharopoulos. (1994)). Do they and, if they do, what are the implications for policy?
The data in Fig. 6 implicitly reports on the Mincerian return to education in which the only cost to education at any level is the forgone wage. Thus it is implicitly assumed that the cost of attending primary school is the wage with no education. It can be argued that in fact this cost is much less so even if the rise in earnings with primary education is low the rate of return can be high as the costs in terms of foregone wages for 6-12 year olds are very low. In very poor economies where much of the population is rural, as is the case in
in
et
G
at
ew
ay
u
nd
er
li
ce
nc
e
gr
an
te
d
by
th
e
Pu
bl
is
he
r (
da
te
d
20
12
Tanzania, this argument is can be questioned (see the discussion in Kahyarara and Teal (forthcoming)). However an objection to the use of the Mincerian return to measure even the monetary benefits from education is that it abstracts from the other costs of schooling and these clearly rise with the level so a steep earnings fiinction with post secondary education does not imply high returns once the costs of such education are factored into the calculation.
the costs may matter for social policy it is true in all these countries that education is heavily subsidised so the pattern of return shown, if causal, would imply a high demand for post-secondary education. Indeed the figure throws light on an apparent paradox about the pattern of demand for education in Africa. We have evidence that for most young people who leave school after 10-12 years of education that this is seen to be of httle value as it is both difficult to get a job and even the jobs available do not pay well. However we also know that making primary education free is a very popular policy.
If the pattern of returns shown in Fig. 6 is causal that would explain why parents want education very badly even if for most it is going to yield very low returns.
But is it causal? The earning fijnctions on which Fig. 6 draws are all OLS. For these to be unbiased estimates we need that it is education that is driving earnings and not something else, unobserved ability being the one that has featured most prominently in discussions of this issue.
A paper by Soderbom, Teal, Wambugu, and Kahyarara (2006) investigates in detail this pattern of returns to education for Kenya and Tanzania and asks if the pattern observed in the returns can be explained by some such problem. They can find no evidence that this does explain the outcome. If that is correct (and that is a big if) then we do indeed have an explanation as to why there is such high demand for education while education for most yields very little.
in
et
G
at
ew
ay
u
nd
er
li
ce
nc
e
gr
an
te
d
by
th
e
Pu
bl
is
he
r (
da
te
d
20
12
people leaving school. The time when a secondary qualification could guarantee a formal sector job has passed.
Should policy be concerned with the size distribution of firms in countries?
This question is rarely asked in this form. The more usual form of the question is: Should policies be in place to promote small and medium scale enterprises? The most common answer to that question is yes. Virtually every African government has policies which are designed to promote the small scale. The analysis presented here shows that such a policy requires reconsideration. While it is true that small firms create larger numbers of jobs per unit of investment, such jobs are relatively poorly paid and, given current rates of investment, even the number of such jobs is limited. If poverty reduction requires firm growth to be linked to the export market then the promotion of small firms will limit, not accelerate, poverty reduction.
How can policy foster firm growth that impacts most effectively on poverty reduction?
Policies that will impact on poverty reduction require, as already noted, a rapid increase in the demand for unskilled labour. It is only through the export market that rapid growth is possible and such firms will be, by African standards, relatively large. The policy problem is that capital intensity rises with firm size so as firms become able to enter the export market by reaching a critical minimum size they become more capital intensive thus loosing the potential advantage of lower cost labour. Policies are required which will enable larger firms to be both more labour intensive and more efficient.
One of the objectives of policies in this area needs to be to shift up the return to education among those with 10 years or less of education. At present the pattern of returns to education is encouraging a rapid growth in the demand for post-secondary education driven in part by the lack of jobs for those with only junior secondary or less.
What are the implications for policy of links between firm size, productivity, skill composition and growth?
That larger more export oriented firms require higher levels of
in
et
G
at
ew
ay
u
nd
er
li
ce
nc
e
gr
an
te
d
by
th
e
Pu
bl
is
he
r (
da
te
d
20
12
skills is quite clear from the data. What is much less clear is which types of skills is required or that the problem lies on the supply rather than demand side of the market. Questions about skills are often posed in terms of productivity with the presumption that skills which improve productivity will be a source of firm success. However higher labour productivity, as we have seen, does not seem to be working to generate exporting in Africa. If the central argument developed above is accepted that this failure in the export market is the key policy failure in Africa then it is necessary to refocus the question on the links between skills and exporting.
While firm surveys which enable a link to be made between labour market outcomes and firm performance are vital for enabling all these questions to be addressed it is apparent from this survey that much still needs to be known.
ACKNOWLEDGEMENT
It is usual when writing acknowledgements to thank all those who have assisted the author. In the case of this paper this is much more than a formality. 1 am very heavily indebted to specific individuals whose hard work in the often difficult and time consuming tasks of data collection, cleaning, assembling and analysing the data from firm level surveys has enabled researchers at the CSAE to assemble an extensive panel data set across African countries. So without wishing to implicate in the argument 1 would like to thank Simon Baptist, Gaurav Ganguly, Alan Harding, Godius Kahyarara, Neil Rankin, Justin Sandefur, Pieter Semeels and Marcella Vigneri. The person from whom 1 have learnt a lot in understanding this data has been Mans Soderbom who has also assisted in the more mundane, but necessary, task of finding out what these firms do. To all 1 am very grateful and none must be assumed to think as 1 do. A briefer version of this paper was presented at an ERSA workshop on Firm Level Data Analysis, sponsored by the IDRC (Canada) at the University of the Witwatersrand, February 2008. This paper also formed the basis for a presentation given at the World Bank, Washington in February 2007. 1 am indebted to Johannes Fedderke for encouraging me to write up the paper in a more accessible form and to a referee who greatly assisted that process.
in
et
G
at
ew
ay
u
nd
er
li
ce
nc
e
gr
an
te
d
by
th
e
Pu
bl
is
he
r (
da
te
d
20
12