OGSSim: Open Generic data Storage systems Simulation
tool
Sebastien Gougeaud
University of Versailles45 ave. des etats unis Versailles, France
Soraya Zertal
University of Versailles45 ave. des etats unis Versailles, France
Jacques-Charles
Lafoucriere
CEA-DAM Ile de France, France
Philippe Deniel
CEA-DAM Ile de France, FranceABSTRACT
In this paper, an open and generic storage simulator is proposed. It simulates with accuracy multi-tiered storage systems based on heterogeneous devices including HDDs, SSDs and the connecting buses. The target simulated sys-tem is constructed from the hardware configuration input, then sent to the simulator modules along with the trace file and the appropriate simulator functions are selected and executed. Each module of the simulator is executed by a thread, and communicates with the others via ZeroMQ, a message transmission API using sockets for the information transfer. The result is an accurate behavior of the simulated system submitted to a specific workload and represented by performance and reliability metrics. No restriction is put on the input hardware configuration which can handle differ-ent levels of details and makes this simulator generic. The diversity of the supported devices, regardless to their na-ture: disks, buses, ..etc and organisation: JBOD, RAID, ..etc makes the simulator open to many technologies. The modularity of its design and the independence of its exe-cution functions, makes it open to handle any additional mapping, access, maintenance or reconstruction strategies. The conducted tests using OLTP and scientific workloads show accurate results, obtained in a competitive runtime.
Keywords
Simulation tools, event-driven simulation, modularity, Ze-roMQ, storage systems, HDD, SSD, OLTP and scientific workloads.
1.
INTRODUCTION
Studies based on modeling and simulation techniques have always been capital to understand the inside behaviors of any system, to evaluate its design trade-offs, to narrow down its design spaces, and to reduce the prototyping efforts. Simulators of data storage systems are mainly used to eval-uate the impact of specific workloads and hardware devices on the delivered performance and reliability. They are used in diverse situations, regardless of the workload type: real traces or generated synthetic ones, regardless of the char-acteristics of the hardware devices: real or factitious. The reason is the need to understand and quantify how a system performs with yet-to-come storage device, submitted to any profile access from any application.
Simulators are considered as strong tools, particularly in data storage area. This lies on the critical data manipula-tion which can lead to data corrupmanipula-tions making any related calculations or decisions, totally erroneous. Thus, the use of simulators is capital to evaluate and validate any architec-ture design choice, any data layout scheme, any access strat-egy and any data reconstruction and device maintenance al-gorithm. It is important that every aspect of the storage system, can it be software or hardware, can be meticulously and thoroughly examined, tested and validated before sub-mission to a final decision.
Having at one’s disposal, accurate, highly configurable, gene-ric and open tools to model, then access and evaluate a target data storage system becomes a first concern in this data era, where the personnel data volume are counted in TeraBytes, the enterprise data volume in Petabytes and the data centers data volume in Exabytes.1
The data storage simulators as any other simulators in dif-ferent areas, should follow the market and the use trends otherwise they are useless and become obsolete. During the last decade and the wide-spreading of SSDs at the three level of the use hierarchy (personal, enterprise, data center), a new kind of storage systems, composed of both HDDs
1
Source: IDC’s Digital universe Study.
SIMUTOOLS 2015, August 24-26, Athens, Greece Copyright © 2015 ICST
(Hard Disk Drives) and SSDs (Solid state Disks) appeared. Both devices have to be kept because they have different characteristics and are used accordingly. Thus, both have their place in the data storage system. However, the exist-ing simulators can simulate configurations based on one or the other type of these devices. Consequently, they cannot be used to model and simulate such systems.
In this paper, we propose OGSSim: an Open Generic data Storage systems Simulator, which aim to satisfy the storage systems requirements in term of:
• hardware heterogeneity: various storage devices as HDDs, SSDs, DRAM, ...etc.
• diverse architecture configurations and design choice: multi-tiered architecture to provide the hierarchical scheme and at each tier, many organisations/volumes can coexist as JBOD (Just a Bunch Of Disks) and RAID (n+p) : a Redundant Arrays of Independent Disks with n disks of data and p disks of parity,
• modularity and software evolution: all functions to run the devices according to their technologies. All func-tions of FTL (Flash Translation Layer) for the SSDs and defragmentation for HDDs as examples.
In the rest of the paper, section 2 presents related works with their contributions and their limits, section 3 describes the simulator design and implementation in detail, it goes through all its modules and their functions and parameters. Section 4 presents the experimentation settings and covers both the workload and the hardware environments consid-ered in the conducted tests. In section 5, the obtained results are presented and discussed. Finally, section 6 concludes the paper and gives the future extensions of this tool.
2.
RELATED WORKS
A certain number of data storage system simulators exist in the literature, going from the HDD-based to the SSD-based systems. The pioneer in the area is DiskSim, initially devel-oped by Ganger et al. [6] and subject to many improvements via additional contributions, as the one by Bucy et al. [4]. It is dedicated to the HDD-based storage system simulation and reports only on the performance aspects. It is composed of modules representing the storage system main compo-nents: buses, controllers and disk drives. It accepts external I/O traces and integrates an internal trace generator to pro-duce synthetic I/O traces -if needed- according to different probability distributions. The last release DiskSim 4.0 [4] includes the MEMS-based storage device but it is still has limitation on the shape of the storage system toplogy which limits the simulation possibilities using this tool.
Two extensions of DiskSim were proposed to handle the non-volatile devices (SSDs). The first one was proposed by Agrawal et al. [3] and consists of adding a module in charge of the wear levelling and the block erasure. The sec-ond extension, called FlashSim [12] is an object oriented version which encapsulates three FTL (Flash Translation Layer) controllers implementing both the wear levelling and the garbage collection. FlashSim adds detailed performance evaluation capabilities up to the NAND channel level. How-ever, this does not push the limitation on the storage system
topology. Nevertheless, it is true that using these event or trace driven simulators, the internal behavior of the system can be observed and evaluated in its fine details with accu-racy.
More recently, simulators dedicated to SSDs were developed, motivated by the increasing interest and use of this technol-ogy. We can cite NAND FlashSim by Jung et al. [11] provid-ing a detailed disk model up to the plane level and SSDsim by Hu et al. [8] allowing advanced command execution as copyback, multiplane and interleave commands.
There are also the virtual devices simulators for Flash-based storage systems [5] [10] which implement very basic FTL functions, use analytical models for delays and propose very simple topologies without the device’s internal detail. Thus, they are inappropriate for simulating accurately large and heterogeneous storage systems.
Emulators are another kind of storage systems evaluation tools. They are more realistic tools but totally inflexible without any possibility to adjust hardware design parame-ters as OpenSSD [1] and BlueSSD [13]. Also, there is an SSD simulator based on a virtual machine to allow the hardware evaluation in real time and uses a software on the top of the virtual machine to provide multiple design choice for the em-ulated SSD. This tool is VSSIM [16], developed by Yoo et al. and operating on top of QEMU/KVM. It combines the flexibility of a trace driven simulator and the accuracy of the hardware based emulator. However, emulators are very time consuming, also it is absolutely impossible to develop all FTL functions using them. As far as we know, existing evaluation tools cannot manage complex systems.
Finally, all the previous simulators and/or emulators with their different characteristics, capabilities and functions can-not be used to model or simulate a generic data storage sys-tem based on both HDDs and SSDs with various possible configurations and a flexible connectivity.
However, the cohabitation of such devices according to mul-tiple design topologies can be found and will be common in the very near future. Consequently, there is no tool actually able to give the possibility to model and simulate such sys-tems. We propose in this paper, a simulation tool for this purpose and make it open for any extensions to new hard-ware technologies and related configurations and operations, as well as mapping, access, maintenance and reconstruction strategies.
3.
SIMULATOR DESIGN AND
IMPLEMEN-TATION
3.1
Global overview
The proposed simulator is composed of several modules and submodules with a defined and specific role each. We have seven modules: the workload (WKLD), the hardware config-uration (HWC), the pre-processing (PP), the volume driver (VDRV), the device driver (DDRV), the execution (EXEC) and finally the performance (PERF). OGSSim is developed in C++, for its speed and its modularity. This choice allows an easy expansion of any module if needed, for adding a new feature for example.
Hardware con guration
Pre-processing Volume
driver
Execution Performance
evaluation
Device driver
Results Visualization
Trace
Arch.
Times
Subrequest index Request
index
Subrequest index Request
array
Hardware
Workload
Figure 1: OGSSim design
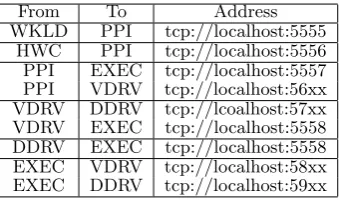
an IP address, a port and a queue type. In our context, we used the API with the TCP protocol and only in local and we define for every queue, a port and an identifier. For ex-ample, the ZeroMQ between the workload module and the pre-processing interface has the identifier 5555. There are many types of ZeroMQ but we use only the push/pull ones, running as producer/consumer queues. A thread sends mes-sages to a queue and another one receives them via the same queue. Table 1 describes the parameters given to the differ-ent ZeroMQ in OGSSim (57xx means ports between 5700 and 5799).
From To Address
WKLD PPI tcp://localhost:5555
HWC PPI tcp://localhost:5556
PPI EXEC tcp://localhost:5557
PPI VDRV tcp://localhost:56xx
VDRV DDRV tcp://lcoalhost:57xx
VDRV EXEC tcp://localhost:5558
DDRV EXEC tcp://localhost:5558
EXEC VDRV tcp://localhost:58xx
EXEC DDRV tcp://localhost:59xx
Table 1: ZeroMQ parameters
Figure 1 shows the actual design of OGSSim and the infor-mation flow between the different modules. The simulator needs the trace and the hardware configuration files as in-puts and generate the result file and related performance graphs at its output.
The description of the different modules is given below:
3.2
Workload
The workload module (WKLD) constructs the request array structure from an input trace file. This one contains raw data describing request parameters. OGSSim supports three types of request format:
• Basic: timestamp, type (read or write), address and size;
• Advanced A: basic format and a group color or iden-tifier;
• Advanced B: basic format and both the generating host and the process identifiers.
The WKLD module creates a request array, a shared mem-ory structure and initialises it with the trace parameters. The request execution times and other intermediate values used by the simulator -such as the target device and the address on the device- are added to fill the rest of the struc-ture during the simulation process. Because a request can be subdivided into subrequests, this array contains also a field for the parent index.
Once the trace is parsed and the request array created and initialised, the shared memory pointer is sent to the pre-processing module (PP).
3.3
Hardware Configuration
The hardware configuration module (HWC) creates the hard-ware structure in a shared memory from the XML input files. The first or global file describes the architecture and the bus configurations. Then, the device files indicated in the global one, describe the internal details of the hardware devices (disks, buses, ...etc).
3.4
Pre-processing
The pre-processing module (PP) has two roles. The first one is to instantiate the volume driver modules after receiving the pointer on the hardware configuration structure. It cre-ates one thread per volume driver, and then sends them the shared memory address.
Its second role is to launch the simulation process. The mod-ule cycles through the request array, determines the target volume for each request and sends the request index to it.
3.5
Volume Driver
The volume driver module (VDRV) also has two roles. The first one is to create the layout model submodule correspond-ing to the volume type. Then, it instantiates the device driver module after receiving the hardware configuration structure.
OGSSim handles different types of volumes: JBOD, RAID1, RAID-01 and RAID (n+p). JBOD is just a bunch of disks, RAID1 is a RAID with mirroring, RAID-01 is a RAID with mirroring and striping and RAID (n+p) represents a RAID with n data and p parity disks. OGSSim can also handle different types of declustering: none/no declustering, parity declustering or data declustering. No declustering means that each disk contains only data or only parity. Parity declustering means that each parity block is affected to disks in a round robin manner. Data declustering is the same as parity declustering apart the first data block of a stripe which is allocated to the disk beside the one holding the parity block, and not the first disk by default.
Its second role is to redirect the requests sent by the pre-processing module (PP) to the target device. To do so, first, the request index is sent to the layout model submodule. Second, it is decomposed into a set of subrequests taking into account that every subrequest is destinated to a unique disk. Third, the subrequest index is sent to the target disk device driver to be executed.
The subrequests are stored in a secondary array located in the shared memory space. The size of this array is defined by the user in the configuration file of OGSSim. Each element of this array contains a boolean to indicate the subrequest status: True, for the living subrequest (to execute/execution in progress), False for the totally executed subrequest. A False status makes the array element a candidate to be used for a new subrequest to execute.
If the submodule does not find any subrequest with a True status, thus there is no free space, it sends a message to the execution module (EXEC) and waits for a reply from it before retrying its search procedure.
3.6
Device Driver
The disk device driver module (DDRV) is composed of a set of maintenance submodules which are device-specific such as the garbage collection, the wear levelling or the defrag-mentation. Each submodule can be implemented with an algorithm defined by the user. Those submodules generate maintenance subrequests which are sent to the execution module. A new submodule can also easily be added to the simulator.
Some technologies or data layout schemes necessitate syn-chronisation mechanisms to be achieved efficiently and guar-antee that the simulation process will complete within a competitive time. The first synchronisation mechanism in OGSSim is related to the implementation of the RAID (n+p)
Figure 2: Barrier utility
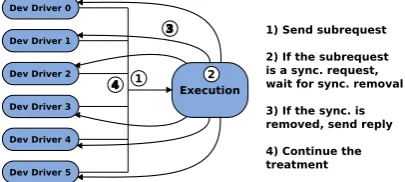
volumes. It refers to figure 2. For small and large writes2, a user write request generates pre-read subrequests and a parity calculation before being executed. So, all write sub-requests need the pre-work to be done before starting. The followed procedure is presented on figure 3.
Execution
Dev Driver 0
Dev Driver 1
Dev Driver 2
Dev Driver 3
Dev Driver 4
Dev Driver 5
1 3
2 4
1) Send subrequest 2) If the subrequest is a sync. request, wait for sync. removal 3) If the sync. is removed, send reply 4) Continue the treatment
Figure 3: Synchronisation mechanism
This mechanism uses special subrequests to indicate that a disk device needs to be synchronised with some others which are waiting for the new parity. After sending this special subrequest to the execution module (1), the disk de-vice driver waits for a reply from the execution. When all the concerned disk devices reach this synchronisation barrier (2), the execution module sends the reply to the disk device (3) which will continue the simulation process (4).
3.7
Execution
The execution module (EXEC) function is to execute the re-quests and determine the request response time as the user critical performance metric.
The service time is computed according to the device pa-rameters and the transfer time based on the bus bandwidth. The waiting time is determined by request arrival time and the disk device’s clock when the device becomes available for this request execution. If a request is decomposed into sub-requests, the request service time is the highest subrequest service time and the request waiting time is the lowest sub-request waiting time.
These calculated times are then reported on an output file, which contains also the request index, the timestamp, the target volume and the target device as mentioned in subsec-tion 3.1
2
3.8
Performance
The performance module (PERF) is composed of scripts written in python which generate visualisation tools (graphs, histograms, ...etc) based on the collected data in the results files. These visualisation tools are plotted using a python plotting library named matplotlib [9]. They can represent the workload per disk, the request decomposition or the mean service and response time of the requests, the disk utilisation during the simulation, the simulation time with the trace file size, ...etc. Additional performance metrics can also be implemented, depending on the user needs.
4.
EXPERIMENTATION
We study and assess different aspects of our proposed sim-ulation tool OGSSim. We vary the configurations and the hardware hierarchies to highlight its generic aspect, we con-sider HDD and SSD as shown on table 4 for its heteroge-neous aspect, combined with various layout schemes (JBOD, RAID n+p) leading to different mapping and access strate-gies. In addition, we evaluate the performance of the simu-lation process itself by analysing the impact of the workload and the simulated architecture on the simulator runtime. Below, details about the considered test environments
4.1
Experimental environment
The machine used to conduct our experiments is a hyper-threaded octo-core, 800MHZ with 8 GB of memory and 750 GB of disk space. It is running using the operating system Ubuntu 14.10 64bits. OGSSim is compiled with gcc version 4.8.2 and the -O3 optimisation flag.
4.2
Experimental settings
We separate the software settings from the hardware ones. The former is about the I/O workloads submitted to the data storage system and the second is the data storage sys-tem architecture, accessed by this workload.
4.2.1
Workloads
Two types of workloads are used: OLTP and Scientific ones. Our choice is motivated by their quite different access pro-files and also being typical data-intensive applications. Thus, good candidates for the simulated storage systems. The workloads are produced by an external generator which could be easily incorporated within the simulator. They are syn-thetic but based on the characteristics of real extracted traces, then they are in accordance with the real traces and pre-serve all their key characteristics. The representativeness is ensured using HMM (Hidden Markov Model) for OLTP [7] and I/O characterization works achieved by Park et al. [15]. The workloads parameters are summarized below:
1. OLTP workload: characterized by a ratio of 0.67 of reads against 0.33 of writes with I/O request size of one page of 4KB each, randomly distributed and coming at a rate of 1600 req/s.
2. Scientific workloads: we use three traces
(a) S trace 1: collected from Los Alamos National Laboratory and represents an MPI IO test,
Trace RD/WR ratio I/O pattern
RD WR
S trace 1 0.50/0.50 Seq. Seq.
S trace 2 0.14/0.86 Rand. Rand.
S trace 3 0.67/0.33 Rand. Rand.
Table 2: I/O pattern and RD/WR ratio for Scien-tific workloads [15]
Name Hierarchy Devices Configuration
Archi 1 1 tier, 1 volume 4 HDDs JBOD
Archi 2 1 tier, 1 volume 4 SSDs JBOD
Archi 3 1 tier, 1 volume 7 HDDs RAID6
Archi 4 1 tier, 2 volumes 2 SSDs JBOD
4 HDDs RAID0-1
Archi 5 2 tier, 1 volume 4 SSDs RAID0-1
1 volume 5 HDDs JBOD
Table 3: The test bed storage systems architectures
(b) S trace 2: collected from Sandia National Labo-ratories, represents a physics problem, more pre-cisely the algebra shock and multi-physics family of codes,
(c) S trace 3: collected from Sandia National Labora-tories, represents a shock wave physics computer code.
Table 2 summarizes their I/O pattern and read/write ratios. Their request size distributions, all the granu-larities going from 1KB to 2MB are included.
We noticed regular I/O request sizes for the OLTP and less regular ones for the scientific (physics) applications.
4.2.2
Simulated Architecture
We selected different storage system architectures which can represent the main capabilities of our simulation tool OGSSim, as shown on table 3 using disks from table 4. The simulated architecture is described in an XML file, pointing the used storage devices. OGSSim builds the whole system to sim-ulate and extract the device characteristics to execute the I/O requests in the trace file. We consider here one HDD and one SSD but enriching the device library by adding the description of new ones is straightforward.
5.
RESULTS AND DISCUSSION
We address three aspects of our proposed tool validation: the simulation duration for the efficiency of OGSSim itself, then its representativess of the spatial and temporal behav-iors of various storage system configurations submitted to typical workloads.
5.1
The simulation duration
Figure 4 shows the evolution of the simulation process du-ration or the execution time of OGSSim depending on both the number of requests in the workload trace (S trace 2 here) and the hardware configuration.
Device/parameter value
HDD HUA721050KLA330
Capacity 500GB
Sector size 512B
Min. seek time (ms) 1.1
Avg. seek time (ms) 8.7
Max. seek time (ms) 15.2
Rotational speed (rpm) 7200
SSD SSDSA2CW300G3K5
Capacity 300GB
Page size 8KB
Rand. read (IOPS) 39500
Rand. program (IOPS) 23000
Seq. read (MB/s) 270
Seq. program (MB/s) 205
Erase (ms)* 1.5
Table 4: The devices characteristics
* unknown, we consider the mean actual value for current SSDs
Figure 4: Execution times of the simulator for the S trace 2
have similar simulation duration independently of the archi-tecture configuration.
The RAID (n+0) configuration needs a bit longer time, due to the request decomposition which necessitates more calcu-lation because of the striping. The main clue here is the gap between the previous configurations and the RAID (n+p) with p different from zero. This gap is related to the synchro-nisation mechanism explained in subsection 3.6 which gener-ates a waiting time for all requested pre-read subrequests to join the execution module. Finally, the RAID (n+2) needs more time to be simulated than the RAID (n+1) because more subrequests are created for the second parity.
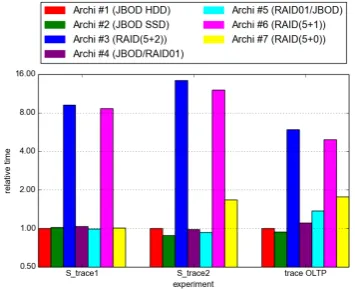
Figure 5 represents the variation of the execution time de-pending on the read/write ratio of the workload. It repre-sents the behavior of all the simulated hardware configura-tions or architectures for the rest of the workloads (S trace 1, S trace 2 and OLTP). All the simulation durations are relative times (with the HDD-based JBOD as a reference). We can observe that the simulation durations of non RAID (n+p) configurations are close to the relative time. For RAID (n+p) configurations, the simulation durations seems to be directly related to the ratio of write requests in the
Figure 5: Study of the impact of the workload be-havior over the simulator execution time
workload. The more there are write requests, the longer is the simulation time. This is, as previously, due to the syn-chronisation mechanism which is more requested because of the high number of writes and the associated parity calcu-lation.
5.2
OGSSim temporal behavior
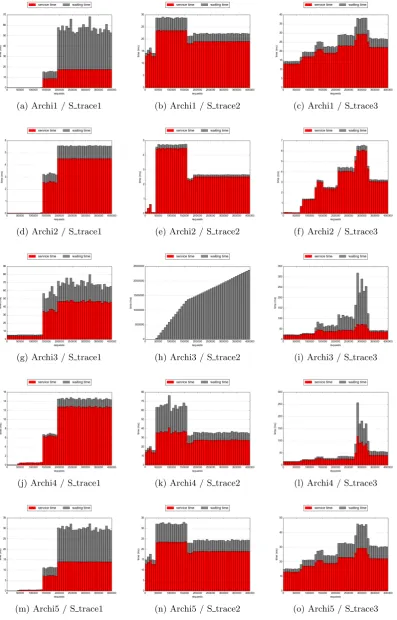
For the following, we need to give some precisions about the temporal profile of the workloads and their sizes. We con-sider a unit equal to one page for a SSD, and 8 sectors for a HDD. All the trace evaluations are represented on figure 6. Each graph represents, for a given workload and configura-tion, the evolution of the mean service and waiting time of the requests during the simulation.
The S trace1 (figures 6a, 6d, 6g, 6j, 6m) shows three phases. The first one covers the first 135K requests of 1-unit each. The second one covers the next 60K requests of 1-unit or 256-units each. The last phase covers the last 205K requests of 256-units each.
The S trace2 (figures 6b, 6e, 6h, 6n, 6n) shows four phases. The first one covers the first 40K requests of 1-unit each with sparse requests of 8, 32 and 256-units each. The sec-ond one covers the next 120K requests of 256-units each and sparse requests of 1-unit each. The third one covers the next 20K requests of 128-units each and sparse requests of 1-unit each. The last phase covers the last 220K requests of only 128-units each.
The S trace3 (figures 6c, 6f, 6i, 6l, 6o) is a mix of various profiles: a set of 70K requests of 1 to 16-units each, a set of 50K requests of 2-units each if write and 128-units each if read, a set of 30K requests of 256-units each if write and 128-units each if read, a set of 55K requests of 256-units each if write and 64-units each if read, a set of 70K requests of 512-units each if write and 64-units each if read, a set of 50K requests of 256-units each if read and 512-units each if write, and finally a set of 75K requests of 256-units each if read and 64-units each if write.
(a) Archi1 / S trace1 (b) Archi1 / S trace2 (c) Archi1 / S trace3
(d) Archi2 / S trace1 (e) Archi2 / S trace2 (f) Archi2 / S trace3
(g) Archi3 / S trace1 (h) Archi3 / S trace2 (i) Archi3 / S trace3
(j) Archi4 / S trace1 (k) Archi4 / S trace2 (l) Archi4 / S trace3
(m) Archi5 / S trace1 (n) Archi5 / S trace2 (o) Archi5 / S trace3
(a) Archi1 / S trace1 (b) Archi3 / S trace1 (c) Archi4 / S trace1
(d) Archi1 / S trace2 (e) Archi3 / S trace2 (f) Archi4 / S trace2
(g) Archi1 / S trace3 (h) Archi3 / S trace3 (i) Archi4 / S trace3
(j) Archi1 / OLTP (k) Archi3 / OLTP (l) Archi4 / OLTP
HDD than on a SSD. Consequently, a higher waiting time is observed. It is due to a similar request arrival rate for both traces, so a higher service time generates a more important delay for the following queueing requests.
If we compare Archi1 to Archi3 (RAID(5+2)) using S trace1 as shown on figures 6a and 6g, we can see that the mean ser-vice time is more varying during a single phase and that the mean service time is higher. Those are due to the pres-ence of the parity mechanism which imply, as explained in section 3.6, two side effects: the decomposition of a simple write request into pre-read and write subrequests and the synchronisation after the pre-read due to the parity compu-tation.
The differences between the two configurations for S trace3 are shown on figures 6c and 6i and can be summarized by a higher waiting time for the phases where requests are larger on Archi3. This is also explained by the presence of parity and the synchronisation mechanism which leads to have a request service time at least two times higher, and accumu-lates more waiting times than with the JBOD.
Running S trace2 on Archi3, represented on figure 6h, shows a mean waiting time increasing continuously until reaching 2.5 million of milliseconds. This behavior means that the hardware configuration can not bear this kind of workload. Thus, the request arrival rate and the proportion of write requests are too important for the configuration capability. However, we can observe three phases too. The first one is negligible, not visible. Then we get a high slope from 50K to 170K requests, which matches the second phase of the workload, with requests of 256-units each and finally, the slope decreases a little, corresponding to the last requests stream of 128-units each.
Considering Archi1 and the HDD-volume of Archi4 (RAID-01). The S trace1 (figures 6a, 6j) reveals that the mean service times are approximately similar for both. This is be-cause a write request is decomposed into two subrequests on RAID-01. One request for the original disk and the other for the mirror one. The mean waiting times are lower on Archi4 than on Archi1 because the read requests are distributed across the original disks or the mirror ones to balance the load on the disks.
As shown on figure 6b and 6k, S trace2 presents higher mean service and waiting times on Archi4 because it contains more write requests than read ones so the write load is almost dou-bled.
Figures 6c and 6l show the S trace3 behavior which is sim-ilar on both configurations. We can notice that, except for the highest step, the mean service times are close, but the mean waiting times on Archi4 are lower on Archi1 because of the load distribution and the dominance of reads. For the higher step, we can observe that both the mean service and waiting times are higher on Archi4. This is due to the combination of two factors: the big size of the requests and the fact that Archi4 has two data disks instead of four for Archi1. Large requests increase the service time, but there are less data disks in the configuration, so the load distribu-tion across these disks is less efficient.
Finally, we observe the comparison between the HDD-based Archi1 and the HDD-volume of Archi5 (JBOD). The two
configurations are similar and all the profiles match. The unique difference is for the S trace2 and the S trace3 (figures 6b, 6c, 6n, 6o), where the mean waiting-time on Archi5 is lower than on Archi1. This is due to the number of devices of the configurations. Archi5 has one more device, and because the workload deals with random-access requests, there is less requests per disk, so less waiting time. This phenomenon is not visible for S trace1 (figures 6a, 6m) because the access profile is sequential.
5.3
OGSSim spatial behavior
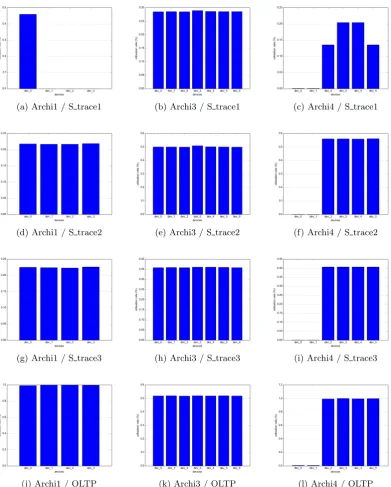
This subsection aims to assess the spatial distribution of physical requests on the disks devices. Figure 7 shows the different device utilisation for the configurations Archi1, Archi3 and Archi4, submitted to OLTP and the three scientific traces. Thus, it allows to check the load balancing on the disks depending on the hardware configuration and the ac-cess profile.
For the first configuration: Archi1 which is just a HDD-JBOD submitted to the sequential S trace1, a right behav-ior would be the utilisation of only one device as the entire trace does not cover a whole data disk or two disks (the end of one and the beginning of the next one). Also, the right and expected behavior for the random traces (S trace2 and S trace3) is a load balancing across the disks. The OGSSim results are shown on figure 7a for the S trace1 and shows that only the first device is used, as it should be. The rate is almost 45% because the first part of the workload is com-posed of small requests and do not keep the disk busy. The right behavior is also observed with S trace2 and S trace3 on figure 7d and figure 7g respectively, where the load bal-ancing is clear and every disk has a utilisation percentage of 25%.
For the second configuration: Archi3 which is a RAID (5+2) of HDDs, the expected behavior is a load balancing on the disks resulting from the striping and the parity decluster-ing. The OGSSim results, shown on figures 7b, 7e and 7h for S trace1, S trace2 and S trace3 respectively, are in ac-cordance with this behavior. We can see that disks have similar utilisation rate, which depends mainly on the write ratio of the workload. The writes increase the load by the generated pre-reads and the double parity updates whilst the read load is still unchanged.
For the third configuration: Archi4 which is composed of a JBOD of SSDs and a RAID-01 of HDDs, as volumes of the first and the second tier respectively. A right behavior would be a negligible utilisation rate for the first (JBOD) tier because of the reduced latency of the SSDs and a load balancing for the second (RAID-01) tier because of the strip-ing. The OGSSim results, shown on figures 7c, 7f and 7i for S trace1, S trace2 and S trace3 respectively, confirm these expectations. The utilisation rate for the disks of the first tier, is less than 1%. We can notice a perfect load balancing on the second tier for S trace1 and S trace3 because of the striping and the equilibrium between the write and the read ratios. Only S trace2 makes a difference in the load balanc-ing because of the disparity between the read and the write ratio (14 and 86% respectively). Writes double the physical load and target both the native and the mirror disks whilst the read load is unchanged and targets the native disks only.
behavior is a nearly perfect load balancing on the disks be-cause of the randomness and the small size of the requests. The OGSSim results are shown on figures 7j, 7k and 7l and confirm this expectation. We can notice here that for HDDs, both Archi1 (JBOD) and Archi4-vol2 (RAID-01), the utili-sation rate is almost 100% while it is above 50% for Archi3 (RAID 5+2). The first statement can be explained by the high arrival rate of the requests and the latency of HDDs. The second observation is explained by the presence of a double parity which is not accessed as the workload is mainly composed of read requests. For the SSDs (Archi4-vol1), the disk utilisation rate is negligible because of the short access time of such disks, negligible comparing to the simulation duration.
For all the conducted tests, the results obtained by OGSSim confirmed the expected storage system behavior, given by the hardware configuration and the profile access of the workload. We deduce that OGSSim reflects accurately the behavior of the storage system in its fine details.
6.
CONCLUSION AND FUTURE WORKS
In this paper, we present OGSSim, an Open and Generic Storage system Simulation tool. It enables the researchers and the practitioners to (1) examine a storage system re-gardless to its configuration and basic devices, (2) study its behavior and (3) analyse its performance in a unified framework. We validated its representativeness on both spa-tial and temporal aspects, as well as its competitive ex-ecution duration with traces of 400K I/O requests from OLTP and scientific environments using various multitiered hardware configurations based on two disks technologies. OGSSim is still very competitive because of the implementa-tion choices. It achieves the simulaimplementa-tion process in a reduced duration: about 10s for 400K req with the simplest configu-ration (JBOD) and 140s with the most complex one (RAID 5+2).
In the near future, we intend to enhance the implemented mechanisms and to add device-specific features such as the defragmentation for HDDs or the garbage collection for SSDs. We also target to include the failure mode in our simulator and the data reconstruction even after multiple failures by adding the declustered RAID mechanism[14] with the possi-bility for the user to implement his own allocation algorithm. Finally, we intend to develop the bus queueing models to handle the bus interleaving effects between storage devices, volumes and tiers with accuracy.
7.
REFERENCES
[1] The openssd project. http://openssd-project.org. [2] Zeromq website. http://zeromq.org.
[3] Nitin Agrawal, Vijayan Prabhakaran, Ted Wobber, John D. Davis, Mark Manasse, and Rina Panigrahy. Design tradeoffs for ssd performance. InUSENIX 2008 Annual Technical Conference on Annual Technical Conference, ATC’08, pages 57–70, Berkeley, CA, USA, 2008. USENIX Association.
[4] John S. Bucy, Jiri Schindler, Steven W. Schlosser, and Gregory R. Ganger. The disksim simulation
environment version 4.0 reference manual, 2008. [5] Kaoutar El Maghraoui, Gokul Kandiraju, Joefon
Jann, and Pratap Pattnaik. Modeling and simulating flash based solid-state disks for operating systems. In Proceedings of the First Joint WOSP/SIPEW International Conference on Performance
Engineering, WOSP/SIPEW ’10, pages 15–26, New York, NY, USA, 2010. ACM.
[6] Gregory R. Ganger, Bruce L. Worthington, and Yale N. Patt. The disksim simulation environment – version 1.0 reference manual, 1998.
[7] P. G. Harrison, S. K. Harrison, N. M. Patel, and S. Zertal. Storage workload modelling by hidden markov models: Application to flash memory. Perform. Eval., 69(1):17–40, January 2012.
[8] Yang Hu, Hong Jiang, Dan Feng, Lei Tian, Hao Luo, and Shuping Zhang. Performance impact and interplay of ssd parallelism through advanced commands, allocation strategy and data granularity. InProceedings of the International Conference on Supercomputing, ICS ’11, pages 96–107, New York, NY, USA, 2011. ACM.
[9] J. D. Hunter. Matplotlib: A 2d graphics environment. Computing In Science & Engineering, 9(3):90–95, 2007.
[10] Peiquan Jin, Xuan Su, Zhi Li, and Lihua Yue. A flexible simulation environment for flash-aware algorithms. InProceedings of the 18th ACM Conference on Information and Knowledge
Management, CIKM ’09, pages 2093–2094, New York, NY, USA, 2009. ACM.
[11] Myoungsoo Jung, E.H. Wilson, D. Donofrio, J. Shalf, and M.T. Kandemir. Nandflashsim: Intrinsic latency variation aware nand flash memory system modeling and simulation at microarchitecture level. InMass Storage Systems and Technologies (MSST), 2012 IEEE 28th Symposium on, pages 1–12, April 2012. [12] Youngjae Kim, B. Tauras, A. Gupta, and
B. Urgaonkar. Flashsim: A simulator for nand flash-based solid-state drives. InAdvances in System Simulation, 2009. SIMUL ’09. First International Conference on, pages 125–131, Sept 2009. [13] S. Lee, K. Fleming, J. Park, Ha K, Adrian M.
Caulfield, Steven Swanson, Arvind, and J. Kim. Bluessd: An open platform for cross-layer experiments for nand flash-based ssds. InProceedings of the 2010 Workshop on Architectural Research Prototyping, 2010.
[14] Y. Li and A. Goel. Efficient distributed hot sparing scheme in a parity declustered raid organization, January 17 2012. US Patent 8,099,623.
[15] S. Park and Kai Shen. A performance evaluation of scientific i/o workloads on flash-based ssds. InCluster Computing and Workshops, 2009. CLUSTER ’09. IEEE International Conference on, pages 1–5, Aug 2009.
![Table 2: I/O pattern and RD/WR ratio for Scien-tific workloads [15]](https://thumb-us.123doks.com/thumbv2/123dok_us/8427969.1696687/5.595.341.529.52.110/table-pattern-rd-wr-ratio-scien-tic-workloads.webp)