Forschen
Sci
O p e n H U B f o r S c i e n t i f i c R e s e a r c hJournal of Neurology and Neurobiology
Open Access
Volume:1.4Research Article
Factor Analysis of the DePaul Symptom
Questionnaire: Identifying Core Domains
Leonard A. Jason1*, Madison Sunnquist1, Abigail Brown1, Jacob Furst1, Marjoe
Cid1, Jillianna Farietta1, Bobby Kot1, Craig Bloomer1, Laura Nicholson1, Yolonda
Williams1, Rachel Jantke1, Julia L. Newton2 and Elin Bolle Strand3
1DePaul University, USA 2Newcastle University, UK 3Oslo University Hospital, Norway
Received date: 22 August 2015; Accepted date: 12 Sep 2015; Published date: 17 Sep 2015. Citation: Jason LA, Sunnquist M, Brown A, Furst J, Cid M, et al. (2015) Factor Analysis of the DePaul Symptom Questionnaire: Identifying Core Domains. J Neurol Neurobiol 1(4): doi http://dx.doi. org/10.16966/2379-7150.114
Copyright: © 2015 Jason LA, et al. This is an open-access article distributed under the terms of the Creative Commons Attribution License, which permits unrestricted use, distribution, and reproduction in any medium, provided the original author and source are credited.
*Corresponding author: Leonard A. Jason, Center for Community Research, DePaul
University, 990 W. Fullerton Ave., Chicago, IL 60614, USA, Tel: 773-325-2018; Fax: 773.325.4923; E-mail: [email protected]
Introduction
The diagnosis of chronic fatigue syndrome (CFS) relies heavily on self-reported symptom profiles, but the reliability of this illness’s case definition has been an obstacle to research since the Centers for Disease Control and Prevention’s (CDC) publication of the first diagnostic criteria for CFS [1]. The later developed Fukuda criteria [2] was also criticized as vague and clinically unhelpful [3,4], lacking specific guidelines or operationalizations. However, these criteria, with updates made by Reeves et al. [5], remain the most universally utilized criteria to date for research. The Empiric criteria [6] were an attempt to operationalize the criteria [2], but significant dissension occurred due to its broadening of the case definition [7]. The Clinical Canadian Criteria [8] required seven symptoms, including post-exertional malaise and neurocognitive impairment. Later, the Myalgic Encephalomyelitis International Consensus Criteria (ME-ICC) [9] was developed, requiring eight symptoms. Both of these more recent criteria were consensus-based rather than empirical. To reduce criterion variance and select similar samples across studies, there is a critical need to determine which symptoms in these diverse case definitions to use in both research and practice.
More empirical methods have been used to identify latent symptom domains within CFS samples. Using principal component analysis, Friedberg et al. [10] found a three principal components: ‘Cognitive Problems,’ ‘Flu-like Symptoms,’ and ‘Neurologic Symptoms;’ whereas Jason et al. [11] found a six-component solution: ‘Neurocognitive,’ ‘Vascular,’ ‘Inflammation,’ ‘Muscle/Joint,’ ‘Infectious,’ and ‘Sleep/Post-Exertional Malaise.’ Other investigators have used factor analysis, such as Arroll and Senior [12], who found a five-factor solution: ‘Fibromyalgia Syndrome-like,’ ‘Depression/Anxiety,’ ‘Fatigue/Post-Exertional Malaise,’ ‘Cognitive/ Neurological,’ and ‘Irritable Bowel Syndrome-like.’ In a factor analysis of CFS-like groups, Nisenbaum et al. [13] found a three-factor solution: ‘Fatigue-Mood-Cognition,’ ‘Flu-type’ and ‘Visual Impairment.’ In a later
ISSN 2379-7150
Abstract
The present study attempted to identify critical symptom domains of individuals with Myalgic Encephalomyelitis (ME) and chronic fatigue syndrome (CFS). Using patient and control samples collected in the United States, Great Britain, and Norway, exploratory factor analysis (EFA) was used to establish the underlying factor structure of ME and CFS symptoms. The EFA suggested a four-factor solution: post-exertional malaise, cognitive dysfunction, sleep difficulties, and a combined factor consisting of neuroendocrine, autonomic, and immune dysfunction symptoms. The use of empirical methods could help better understand the fundamental symptom domains of this illness.
Keywords:
Chronic fatigue syndrome; Myalgic encephalomyelitis; DePaul symptom questionnaire; Case definitioncommunity-based study of a chronically fatigued group, they found: ‘Musculoskeletal,’ ‘Infection,’ and ‘Cognition-Mood-Sleep’ factors [14]. Hickie et al. [15] found the following five factors: ‘Musculoskeletal Pain/ Fatigue,’ ‘Neurocognitive Difficulties,’ ‘Inflammation’, ‘Sleep Disturbance/ Fatigue,’ and ‘Mood Disturbance,’ utilizing an international sample that combined chronic fatigue and CFS. Finally, Brown and Jason [16] found a three-factor solution: Neuroendocrine, Autonomic, and Immune Dysfunction, Neurological/Cognitive Dysfunction, and Post-Exertional Malaise, using exploratory factor analysis. A confirmatory factor analysis demonstrated that the fit of this factor structure was adequate when applied to a second sample. It appears that post-exertional malaise and neurocognitive factors appear most often in these empirical efforts. These types of studies could help determine which latent symptoms domains should be included within a case definition.
Forschen
Sci
O p e n H U B f o r S c i e n t i f i c R e s e a r c hOpen Access
The current study employed factor analytic methods to investigate a large sample of both patients and controls, as well as patients alone, using a standardized self-report questionnaire. Several methodological improvements were employed in this study, including the use of a large sample and comparing a patient sample with a combined sample of patient and controls. We hypothesized that factors found in analyses of smaller samples would emerge, such as post-exertional malaise, cognitive problems, and sleep difficulties, thus providing more evidence of the critical nature of these symptom domains.
Method
Research participants
DePaul sample patients: An international convenience sample of adults self-identifying as having CFS or ME was recruited. To be eligible, an individual needed to be at least 18, capable of reading and writing English, and have a self-reported, current diagnosis of ME or CFS. Participants were given three options for completing study measures: an electronic survey, a hard-copy survey, or a verbal survey over the telephone. Of the 217 individuals who participated, 216 were included in the present study; one participant was excluded due to incomplete data. Demographically, the sample was 84.2% female and 15.8% male. This sample was predominantly (97.7%) Caucasian, while 0.5% identified as Asian and the remaining 1.9% selected ‘Other’ as their race. Only 13.5% of the sample was working full- or part-time and 56.7% of the sample was on disability. With regard to educational level, 40.5% of the sample held a graduate or professional degree; 34.4% held a standard college degree; 18.1% had attended college for at least one year; and 7.0% completed high school or had a GED. The mean age of the sample was 52.0 (SD= 11.3).
DePaul sample controls: A sample of DePaul University undergraduate students was recruited via the Introductory Psychology Research Participation Pool. Students were required to be at least 18 years old to participate. Of the 96 control participants, 70.8% were female, and the remainder male. The majority of the sample (60.0%) identified as Caucasian, 13.7% as Asian or Pacific Islander, 9.5% as Black or African American, 1.1% as American Indian or Alaskan Native, and 15.8% as another race. Almost all (88.5%) of participants selected Student when reporting their work status, but 1.0% indicated Unemployed, and 10.4% stated that they were working part time. Regarding the highest level of education achieved, 4.2% held a standard college degree; 51.0% had completed at least one year of college; and 44.8% had a high school degree. The mean age of the sample was 20.6 (SD=2.6).
SolveCFS BioBank sample patients: A separate sample of individuals was collected by the Solve ME/CFS Initiative. This patient data originated from the SolveCFS BioBank, a resource with clinical information and blood samples on a sample of individuals diagnosed by a licensed physician specializing in CFS and ME. The sample used in the present study included only those over 18. The participants studied here were recruited by the Solve ME/CFS Initiative through physician referral. All participants who met eligibility criteria completed a written informed consent process. Participants completed the study measures electronically or by hard copy. Of the 239 patients who participated, 237 were included in the current study; two participants were excluded due to missing data. The BioBank patient sample was 99.1% Caucasian and 0.9% selected ‘Other’ for their race. With regards to gender, 73.0% of the sample was female. Only 10.5% of the sample was working full- or part-time, with 65.4% on disability. Regarding education level, 24.7% of the sample held a graduate or professional degree; 43.0% had completed college; 20.9% had completed some college; and 11.5% had a high school degree or GED. The average age of the sample was 49.7 (SD = 12.9).
SolveCFS BioBank sample controls: Control participants were also recruited through the Solve ME/CFS Initiative and completed the
same written informed consent process as the patient sample. Control participants were required to be in generally good physical and mental health and could not have a substance use disorder or any disorder that could cause immunosuppression. Furthermore, controls could not have any medical condition or mental health disorder that caused fatigue. Of the 83 control participants, 80.7% were female, and 19.3% were male. Regarding race, 98.8% of the sample was Caucasian, and 1.2% was Black or African American. Most (66.3%) of the sample was working; 13.3% was retired; and the remainder was not working for other reasons. This sample was also highly educated, with 22.0% holding a graduate or professional degree and 39.0% a standard college degree; 25.6% had completed at least one year of college, and 13.4% had a high school degree. The mean age of the sample was 49.7 (SD=13.6).
Newcastle sample: Participants in the Newcastle sample had been referred for a medical assessment at the Newcastle-upon-Tyne Royal Victoria Infirmary clinic due to a suspected diagnosis of CFS. An experienced physician performed a comprehensive medical history and examination, and individuals who met eligibility criteria completed a written informed consent process. A total of one hundred participants completed study measures by hard copy, but three were excluded due to incomplete data. The Newcastle sample was 99.0% Caucasian and 1.0% multiracial, and 82.5% of participants were female. Of this sample, 37.5% of participants were working either part- or full-time and 30.2% were on disability. With regard to education level, 20.9% had a graduate or professional degree; 29.7% had a college degree; 24.2% had completed at least one year of college; 14.3% had a high school degree; and 11.0% had not completed high school. The average age of the sample was 45.6 (SD=14.0).
Norway sample 1: Individuals with CFS were invited to participate in a randomized controlled trial of a CFS self-management program. Participants were recruited from four mid-sized towns in southern Norway, two suburbs of Oslo, and some surrounding communities. Recruitment sources included: healthcare professionals, the waiting list for a patient education program, and CFS patient organizations. Participants were required to be older than 18 years of age and diagnosed with CFS by a physician or medical specialist. Of the 176 participants, 175 were included in this study; one participant was excluded due to missing data. This sample was 86.8% female and 13.2% male. Almost all participants were Caucasian (99.4%); one participant selected ‘Other’ when asked about race. Only 9.7% of participants were working, while 84.0% were on disability. Regarding education, 9.9% of participants had a graduate or professional degree, 40.1% a standard college degree, 41.9% a high school degree, and the remainder had not completed high school. The mean age of the sample was 43.4 years (SD=11.7).
Forschen
Sci
O p e n H U B f o r S c i e n t i f i c R e s e a r c hOpen Access
Measures
The DePaul symptom questionnaire: All participants completed the DePaul Symptom Questionnaire (DSQ) [20], a 54-item self-report measure of ME and CFS symptomatology, demographics, and medical, occupational and social history. Participants rate each symptom’s frequency over the past six months on a 5-point likert scale: 0=none of the time, 1=a little of the time, 2=about half the time, 3=most of the time, and 4=all of the time. Likewise, participants rate each symptom’s severity over the past six months on a 5-point likert scale: 0=symptom not present, 1=mild, 2=moderate, 3=severe, 4=very severe. Frequency and severity scores were multiplied by 25 to create 100-point scales. The 100-point frequency and severity scores for each symptom were averaged to create one composite score per symptom. The DSQ has evidenced good test-retest reliability among both patient and control groups [21]. A factor analysis of these symptoms [22] resulted in a three-factor solution, and these factors evidenced good internal consistency. The DSQ is available in the shared library of Research Electronic Data Capture (REDCap), hosted at DePaul University: https://redcap.is.depaul.edu/surveys/?s=tRxytSPVVw
Medical outcomes study 36-item short-form health survey(SF-36 or RAND Questionnaire): The SF-36 measures the impact of participants’ health on physical and mental functioning [23]. The measure results in eight subscales: Physical Functioning, Role Physical, Bodily Pain, General Health, Social Functioning, Mental Health, Role Emotional, and Vitality. Higher subscale scores indicate less impairment. The widely used SF-36 evidences strong psychometric properties [23].
Statistics
Factor analysis: IBM SPSS Statistics version 21 was used to perform exploratory factor analyses. Promax rotation (kappa = 4) was selected to allow the factors to correlate, and the principal axis factoring extraction method was used due to its relative robustness. To determine the appropriate number of factors to retain, the scree plot and parallel analysis were examined. The parallel analysis was constructed with 5,000 replications, using permutations of the raw data. Factors with eigenvalues higher than chance were retained, based on the 95% confidence interval of the parallel analysis. Symptoms that did not load onto any factor (rotated loadings <0.4) were dropped. After symptoms were dropped, the analysis was repeated until all symptoms loaded onto a factor.
Multiple exploratory factor analyses were conducted. The first analysis included both patient and control participants (“combined sample”) in order to explore factors derived from the full range of symptom scores. A second factor analysis included only patients (“patient-only sample”) in order to further examine the shared variance specific to individuals with the illness.
Methods for replacing missing values: In examining the frequency and severity ratings of the 54 DSQ symptoms, participants missing responses to 10% or more items were removed. Of the remaining participants, missing values were replaced using the following method: For the cases that had a score of 0 for either frequency or severity of a symptom and were missing the other field, the missing value was set to 0; the rationale was that a symptom should occur “none of the time” (frequency=0) if the symptom is “not present” (severity=0). Otherwise, if a subject was missing data in only one of the two fields (frequency or severity) for a symptom, then the missing field was replaced with the mode of the cases that had the same score for the non-missing field. When both fields were missing for a symptom, the values were replaced with the overall medians in those fields for that symptom. After missing values were replaced, frequency and severity scores were multiplied by 25 to create 100-point scales. The 100-point frequency and severity scores for each symptom were averaged to create one composite score per symptom.
Results
Demographic characteristics
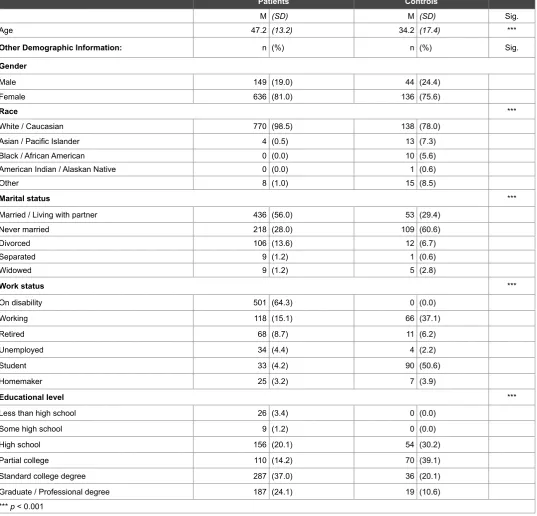
Regarding demographic characteristics of the patient and control groups (Table 1), the control sample was significantly younger than the patient sample (t(228.52)=9.42, p< .001], and also more diverse (p<0.001, two-tailed Fisher’s exact test). While most of the control sample held a high school or college degree, a larger proportion of the patient sample had not completed high school or had a graduate or professional degree (p<0.001, two-tailed Fisher’s exact test). Unsurprisingly, a larger proportion of patients were on disability, while more control participants were students (p<0.001, two-tailed Fisher’s exact test).
Assessing the adequacy of the correlation matrix
For the combined sample, Bartlett’s test of sphericity indicated that the correlation matrix was not an identity matrix (X2(1431)=34395.38,
p<.001). The Kaiser-Meyer-Olkin Measure of Sampling Adequacy (KMO=0.971) also indicated the matrix was appropriate for EFA. Similar results were found for the patient-only sample ((X2(1431) = 19294.67, p<
0.001); KMO = 0.936).
Factor interpretation: combined sample
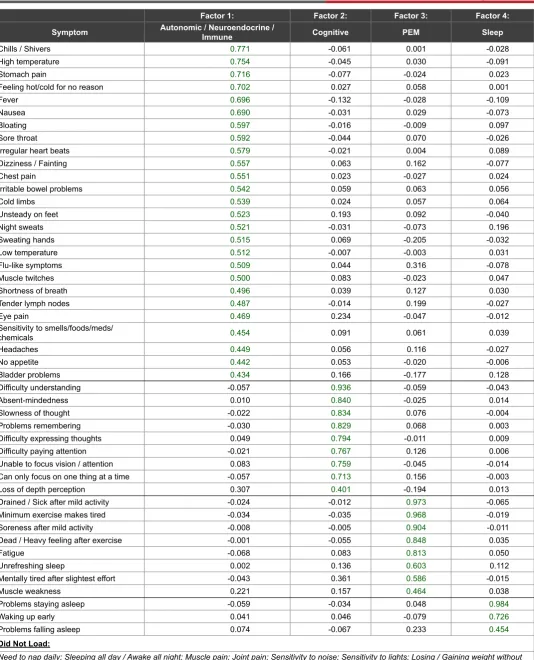
Table 2 displays the rotated loadings for the final four-factor solution from the combined sample of 969 participants. Twenty-six items loaded on the first factor; nine items loaded on the second factor; eight items loaded on third factor; and three items loaded on the fourth factor. Factor one was labeled ‘Autonomic, Neuroendocrine and Immune Dysfunction,’ as all scale-items that loaded to this factor belong to multiple symptom clusters. Factor two was labeled ‘Cognitive Dysfunction,’ as all scale-items that loaded to this factor broadly fit into this symptom cluster. Factor three was labeled ‘Post-Exertional Malaise,’ as all of the post-exertional malaise (PEM) items loaded to this factor. Factor four was labeled “Sleep” as items related to sleep dysfunction loaded onto this last factor.
Factors one, two, three and four explained 40.6%, 6.5%, 3.8% and 3.4% of the variance respectively. Cronbach’s alphas were .94, .94, .95, and .79 for factors one, two, three and four, respectively. This indicates that all factors possessed good internal consistency. There were relatively strong correlations between factors (Table 3).
Factor interpretation: patient-only sample
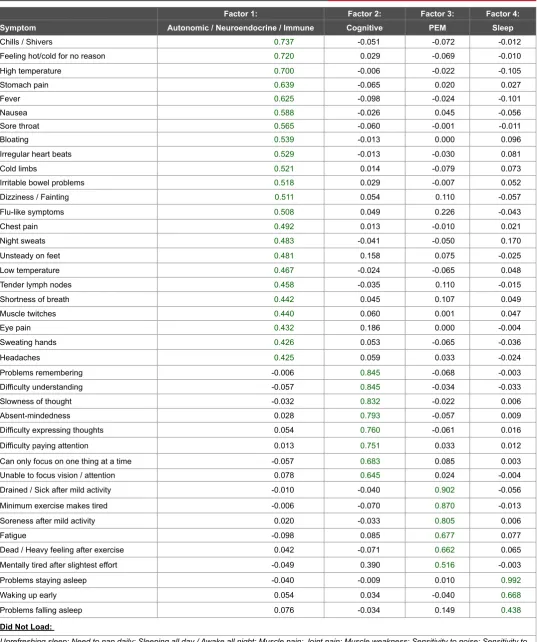
When examining the patient-only sample of 788 participants, a parallel analysis indicated that a seven-factor solution should be selected. However, the smaller size of the patient-only sample was prohibitive in extracting this number of factors; four factors was the maximum number possible to extract stably (Table 4). Similar factors were found in this analysis as were found when using the combined sample. However, several items that loaded onto factors when using the combined sample did not load when including only patients: unrefreshing sleep, muscle weakness, loss of depth perception, bladder problems, no appetite, and sensitivity to smells, foods, medications, or chemicals.
Factors one, two, three, and four explained 28.3%, 8.8%, 5.9%, and 4.5% of the variance, respectively. Cronbach’s alphas were .91, .92, .88, and .75 for factors one, two, three, and four respectively. This indicates that all factors possessed good internal consistency (Table 5).
Forschen
Sci
O p e n H U B f o r S c i e n t i f i c R e s e a r c hOpen Access
gastro-intestinal distress. Cronbach’s alphas were 0.81, 0.77, and 0.81 for factors one, two, and three, respectively, indicating good internal consistency (Table 7 to see correlations among factors).
Convergent and discriminant validity
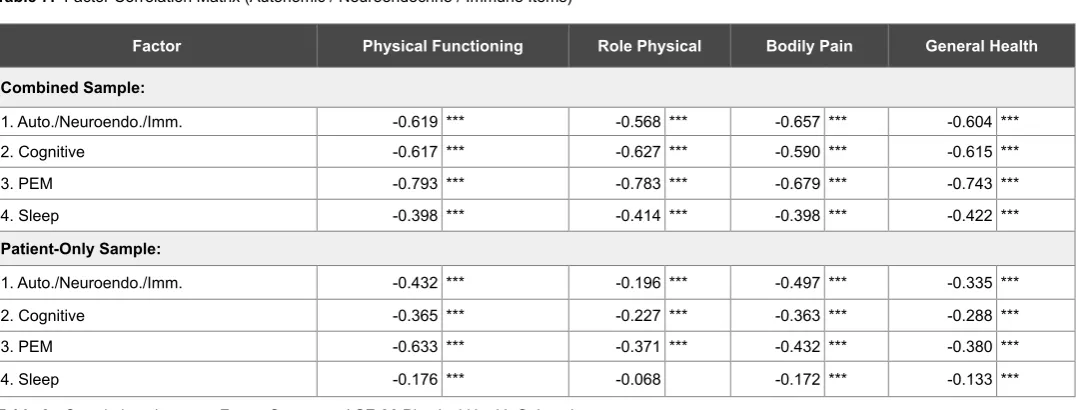
We next ran two sets of bivariate correlation analyses between factor scores (derived using the regression method) and the physical health SF-36 subscales (role physical, physical functioning, bodily pain, and general health). Factor scores from the combined patient and control sample were correlated with SF-36 subscales. Secondly, factor scores from the patient-only sample were correlated with the SF-36 subscales (Table 8). All correlations were statistically significant, with the exception of the
sleep dysfunction factor scores and role physical scores in the patient only sample. The strongest correlations were found between the post-exertional malaise factor and the SF-36 subscales in the combined sample. Correlations were weaker when examining the patient-only sample, as fewer patients had high scores on any of the physical health subscales, so the range of scores was limited.
Discussion
When analyzing both the combined and patient-only samples, the following four-factor solution was found: post-exertional malaise, cognitive dysfunction, sleep difficulties and a combined factor consisting of neuroendocrine, autonomic and immune dysfunction symptoms.
Patients Controls
M (SD) M (SD) Sig.
Age 47.2 (13.2) 34.2 (17.4) ***
Other Demographic Information: n (%) n (%) Sig.
Gender
Male 149 (19.0) 44 (24.4)
Female 636 (81.0) 136 (75.6)
Race ***
White / Caucasian 770 (98.5) 138 (78.0)
Asian / Pacific Islander 4 (0.5) 13 (7.3)
Black / African American 0 (0.0) 10 (5.6)
American Indian / Alaskan Native 0 (0.0) 1 (0.6)
Other 8 (1.0) 15 (8.5)
Marital status ***
Married / Living with partner 436 (56.0) 53 (29.4)
Never married 218 (28.0) 109 (60.6)
Divorced 106 (13.6) 12 (6.7)
Separated 9 (1.2) 1 (0.6)
Widowed 9 (1.2) 5 (2.8)
Work status ***
On disability 501 (64.3) 0 (0.0)
Working 118 (15.1) 66 (37.1)
Retired 68 (8.7) 11 (6.2)
Unemployed 34 (4.4) 4 (2.2)
Student 33 (4.2) 90 (50.6)
Homemaker 25 (3.2) 7 (3.9)
Educational level ***
Less than high school 26 (3.4) 0 (0.0)
Some high school 9 (1.2) 0 (0.0)
High school 156 (20.1) 54 (30.2)
Partial college 110 (14.2) 70 (39.1)
Standard college degree 287 (37.0) 36 (20.1)
Graduate / Professional degree 187 (24.1) 19 (10.6)
*** p < 0.001
Forschen
Sci
O p e n H U B f o r S c i e n t i f i c R e s e a r c hOpen Access
Factor 1: Factor 2: Factor 3: Factor 4:
Symptom Autonomic / Neuroendocrine / Immune Cognitive PEM Sleep
Chills / Shivers 0.771 -0.061 0.001 -0.028
High temperature 0.754 -0.045 0.030 -0.091
Stomach pain 0.716 -0.077 -0.024 0.023
Feeling hot/cold for no reason 0.702 0.027 0.058 0.001
Fever 0.696 -0.132 -0.028 -0.109
Nausea 0.690 -0.031 0.029 -0.073
Bloating 0.597 -0.016 -0.009 0.097
Sore throat 0.592 -0.044 0.070 -0.026
Irregular heart beats 0.579 -0.021 0.004 0.089
Dizziness / Fainting 0.557 0.063 0.162 -0.077
Chest pain 0.551 0.023 -0.027 0.024
Irritable bowel problems 0.542 0.059 0.063 0.056
Cold limbs 0.539 0.024 0.057 0.064
Unsteady on feet 0.523 0.193 0.092 -0.040
Night sweats 0.521 -0.031 -0.073 0.196
Sweating hands 0.515 0.069 -0.205 -0.032
Low temperature 0.512 -0.007 -0.003 0.031
Flu-like symptoms 0.509 0.044 0.316 -0.078
Muscle twitches 0.500 0.083 -0.023 0.047
Shortness of breath 0.496 0.039 0.127 0.030
Tender lymph nodes 0.487 -0.014 0.199 -0.027
Eye pain 0.469 0.234 -0.047 -0.012
Sensitivity to smells/foods/meds/
chemicals 0.454 0.091 0.061 0.039
Headaches 0.449 0.056 0.116 -0.027
No appetite 0.442 0.053 -0.020 -0.006
Bladder problems 0.434 0.166 -0.177 0.128
Difficulty understanding -0.057 0.936 -0.059 -0.043
Absent-mindedness 0.010 0.840 -0.025 0.014
Slowness of thought -0.022 0.834 0.076 -0.004
Problems remembering -0.030 0.829 0.068 0.003
Difficulty expressing thoughts 0.049 0.794 -0.011 0.009
Difficulty paying attention -0.021 0.767 0.126 0.006
Unable to focus vision / attention 0.083 0.759 -0.045 -0.014
Can only focus on one thing at a time -0.057 0.713 0.156 -0.003
Loss of depth perception 0.307 0.401 -0.194 0.013
Drained / Sick after mild activity -0.024 -0.012 0.973 -0.065
Minimum exercise makes tired -0.034 -0.035 0.968 -0.019
Soreness after mild activity -0.008 -0.005 0.904 -0.011
Dead / Heavy feeling after exercise -0.001 -0.055 0.848 0.035
Fatigue -0.068 0.083 0.813 0.050
Unrefreshing sleep 0.002 0.136 0.603 0.112
Mentally tired after slightest effort -0.043 0.361 0.586 -0.015
Muscle weakness 0.221 0.157 0.464 0.038
Problems staying asleep -0.059 -0.034 0.048 0.984
Waking up early 0.041 0.046 -0.079 0.726
Problems falling asleep 0.074 -0.067 0.233 0.454
Did Not Load:
Need to nap daily; Sleeping all day / Awake all night; Muscle pain; Joint pain; Sensitivity to noise; Sensitivity to lights; Losing / Gaining weight without trying; Alcohol intolerance
Forschen
Sci
O p e n H U B f o r S c i e n t i f i c R e s e a r c hOpen Access
Factor 1. Auto./Neuroendo./Imm. 2. Cognitive 3. PEM 4. Sleep
1. Auto./Neuroendo./Imm. 1.000
2. Cognitive .645 1.000
3. PEM .685 .725 1.000
4. Sleep .483 .457 .487 1.000
Table 3: Factor Correlation Matrix (Patient and Control Sample)
Three of these emergent factors, cognitive dysfunction, post-exertional malaise, and sleep, fit well with previous literature indicating that these are cardinal symptom clusters of ME [11]. The findings of study by Jason et al. [19] indicate that fatigue, post-exertional malaise, neurocognitive problems, and unrefreshing sleep occur in most patients, whereas other symptoms, such as pain, autonomic, immune, neuroendocrine, and gastrointestinal symptoms are not as prevalent.
The large Autonomic, Neuroendocrine and Immune Dysfunction factor incorporates many symptom clusters. The fact that a parallel analysis indicated the presence of additional factors among just the patients suggests that this group can be better differentiated. This large factor could imply that these autonomic, neuroendocrine and immune areas occur at lower rates among patients than the more core domains of post-exertional malaise, cognitive problems, and unrefreshing sleep, and thus might be better thought of as subtypes of the illness. To further explore this possibility within the constraints of this study’s sample size, the second patient-only exploratory factor analysis examined solely the items within this heterogeneous factor. The results indicate that circulatory/neuroendocrine impairment, orthostatic intolerance, and gastro-intestinal distress could be thought of as subtypes. For example, an individual could present with all four core domains, plus have severe orthostatic intolerance but no circulatory/neuroendocrine impairment or gastro-intestinal distress. The findings of these factor analyses suggest that empiric methods could help both researchers and practitioners better understand the fundamental domains within this illness.
The Canadian ME/CFS [8] and ME-ICC case definitions [9] specify a different set of symptom domains. Items within the Canadian ME/CFS [8] pain, autonomic, neuroendocrine, and immune domains appeared in different locations within this study’s empirical factors. For example, certain pain items loaded within the orthostatic intolerance and gastro-intestinal factors. This finding suggests that pain may not be a discrete latent domain, but rather these pain items might occur as a result of other system dysfunctions. In addition, regarding the Immune, Gastro-Intestinal and Genitourinary Impairments domain of Carruthers et al. [9] ME-ICC case definition, individuals must have at least one symptom from three of the following five symptom categories: “(1) flu-like symptoms, (2) susceptibility to viral infections with prolonged recovery periods (3) gastro-intestinal tract symptoms (e.g., nausea, abdominal pain), (4) genitourinary symptoms (e.g., urinary urgency), and (5) sensitivities to food, medications, odors, or chemicals.” The current factor analysis identified a gastro-intestinal factor, but did not find the remaining symptoms to be part of one latent domain, so empirical justification for requiring three of these five symptom categories was not found. Finally, some of the symptoms within the Energy Production / Ion Transportation domain of the ME-ICC [9] also emerged in the current study’s circulatory/neuroendocrine impairment and orthostatic intolerance factors. However, these items loaded onto two factors instead of the four sub-categories defined within the ME-ICC’s Energy Production / Ion Transportation domain.
The Fukuda et al. [2] CFS case definition has been extensively used by researchers for the past two decades. Unfortunately, due to its polythetic
nature, it is possible that some individuals who meet these criteria do not have core symptoms of the illness, such as post-exertional malaise, memory/concentration problems, or unrefreshing sleep. The Canadian ME/CFS [8] and ME-ICC [9] case definitions do identify a smaller subset of patients with more severe symptoms and physical functioning impairment [19].
The Institute of Medicine [24] has recently proposed a new case definition that included the following 4 symptoms: substantial reduction or impairment in the ability to engage in pre-illness levels of occupational, educational, social or personal activities; post-exertional malaise, unrefreshing sleep; and at least one of the two following symptoms: cognitive impairment or orthostatic intolerance. There are a number of possible problems with these criteria and the process by which it was formulated. First, prevalence rates of orthostatic intolerance are not as high as the other proposed core symptoms, nor is there any clear justification of having patients be required to have either cognitive impairment or orthostatic intolerance [25]. In addition, whereas the Fukuda et al. [2] CFS criteria, the ME/CFS Canadian criteria [8] and the ME-ICC criteria [9] excluded other medical and psychiatric conditions that might have produced the fatigue and other symptoms, the new criteria (IOM, 2015) had a different position, and seems to regard most other illnesses as comorbid rather than exclusionary, and this will probably have an impact on increasing prevalence rates [26].
Refining the case definition and bringing the various gate keepers (scientists, clinicians, patients, government) into the process is an important, unmet need. Such a development could result in the identification of more homogenous patient samples, which could assist in the pursuit of biomarkers and treatments for ME and CFS. In addition to dealing with issues of criterion variance, there is a need for operationally explicit structured interview schedules to ensure that all necessary information is elicited from clinical interviews. Some of the conflicting outcomes of studies in this area could be attributed to different strategies used to assess symptom domains and case definitions. Clearly, there is a need for investigators to use a similar, comprehensive self-report tool, coupled with biological measures, to aid in symptom assessment.
The current study has several limitations. Most notably, the patient samples merged were from convenience samples as well as from samples that were evaluated by a medical specialist. In addition, the samples were predominately Caucasian which differs from more community-based samples that include more ethnic minorities and individuals of low socioeconomic status. Finally, the size of the patient-only sample limited the ability to extract more than four factors. Future work should attempt to replicate this analysis with a larger sample. A larger sample might allow more factors to emerge and would then overcome the limitation of doing a second factor analysis on a smaller group of items, as was done in the current study.
Forschen
Sci
O p e n H U B f o r S c i e n t i f i c R e s e a r c hOpen Access
Factor 1: Factor 2: Factor 3: Factor 4:
Symptom Autonomic / Neuroendocrine / Immune Cognitive PEM Sleep
Chills / Shivers 0.737 -0.051 -0.072 -0.012
Feeling hot/cold for no reason 0.720 0.029 -0.069 -0.010
High temperature 0.700 -0.006 -0.022 -0.105
Stomach pain 0.639 -0.065 0.020 0.027
Fever 0.625 -0.098 -0.024 -0.101
Nausea 0.588 -0.026 0.045 -0.056
Sore throat 0.565 -0.060 -0.001 -0.011
Bloating 0.539 -0.013 0.000 0.096
Irregular heart beats 0.529 -0.013 -0.030 0.081
Cold limbs 0.521 0.014 -0.079 0.073
Irritable bowel problems 0.518 0.029 -0.007 0.052
Dizziness / Fainting 0.511 0.054 0.110 -0.057
Flu-like symptoms 0.508 0.049 0.226 -0.043
Chest pain 0.492 0.013 -0.010 0.021
Night sweats 0.483 -0.041 -0.050 0.170
Unsteady on feet 0.481 0.158 0.075 -0.025
Low temperature 0.467 -0.024 -0.065 0.048
Tender lymph nodes 0.458 -0.035 0.110 -0.015
Shortness of breath 0.442 0.045 0.107 0.049
Muscle twitches 0.440 0.060 0.001 0.047
Eye pain 0.432 0.186 0.000 -0.004
Sweating hands 0.426 0.053 -0.065 -0.036
Headaches 0.425 0.059 0.033 -0.024
Problems remembering -0.006 0.845 -0.068 -0.003
Difficulty understanding -0.057 0.845 -0.034 -0.033
Slowness of thought -0.032 0.832 -0.022 0.006
Absent-mindedness 0.028 0.793 -0.057 0.009
Difficulty expressing thoughts 0.054 0.760 -0.061 0.016
Difficulty paying attention 0.013 0.751 0.033 0.012
Can only focus on one thing at a time -0.057 0.683 0.085 0.003
Unable to focus vision / attention 0.078 0.645 0.024 -0.004
Drained / Sick after mild activity -0.010 -0.040 0.902 -0.056
Minimum exercise makes tired -0.006 -0.070 0.870 -0.013
Soreness after mild activity 0.020 -0.033 0.805 0.006
Fatigue -0.098 0.085 0.677 0.077
Dead / Heavy feeling after exercise 0.042 -0.071 0.662 0.065
Mentally tired after slightest effort -0.049 0.390 0.516 -0.003
Problems staying asleep -0.040 -0.009 0.010 0.992
Waking up early 0.054 0.034 -0.040 0.668
Problems falling asleep 0.076 -0.034 0.149 0.438
Did Not Load:
Unrefreshing sleep; Need to nap daily; Sleeping all day / Awake all night; Muscle pain; Joint pain; Muscle weakness; Sensitivity to noise; Sensitivity to lights; Loss of depth perception; Bladder problems; No appetite; Losing / Gaining weight without trying; Alcohol intolerance; Sensitivity to smells/foods/ meds/chemicals
Forschen
Sci
O p e n H U B f o r S c i e n t i f i c R e s e a r c hOpen Access
Factor 1. Auto./Neuroendo./Imm. 2. Cognitive 3. PEM 4. Sleep
1. Auto./Neuroendo./Imm. 1.000
2. Cognitive .480 1.000
3. PEM .487 .503 1.000
4. Sleep .321 .248 .226 1.000
Table 5: Factor Correlation Matrix (Patient-Only Sample)
Factor 1: Factor 2: Factor 3:
Symptom Circulatory Orthostatic Intolerance Gastro-Intestinal
Chills / Shivers .884 .006 -.022
Cold limbs .695 -.031 .013
Feeling hot/cold for no reason .628 .124 .035
Low temperature .626 -.054 .006
Unsteady on feet -.017 .770 -.075
Dizziness / Fainting .034 .725 -.088
Shortness of breath -.012 .591 .071
Irregular heart beats .035 .506 .089
Chest pain -.048 .477 .155
Stomach pain -.012 .006 .831
Irritable bowel problems -.005 .005 .730
Bloating .045 .011 .717
Did Not Load:
High temperature; Fever; Nausea; Sore throat; Flu-like symptoms; Night sweats; Tender lymph nodes; Muscle twitches; Eye pain; Sweating hands; Headaches
Table 6: Exploratory Factor Analysis of Autonomic / Neuroendocrine / Immune Items
Factor 1. Circulatory 2. Orthostatic Intolerance 3. Gasto-Intestinal
1. Circulatory 1.000
2. Orthostatic Intolerance .589 1.000
3. Gasto-Intestinal .502 .551 1.000
Table 7: Factor Correlation Matrix (Autonomic / Neuroendocrine / Immune Items)
Factor Physical Functioning Role Physical Bodily Pain General Health
Combined Sample:
1. Auto./Neuroendo./Imm. -0.619 *** -0.568 *** -0.657 *** -0.604 ***
2. Cognitive -0.617 *** -0.627 *** -0.590 *** -0.615 ***
3. PEM -0.793 *** -0.783 *** -0.679 *** -0.743 ***
4. Sleep -0.398 *** -0.414 *** -0.398 *** -0.422 ***
Patient-Only Sample:
1. Auto./Neuroendo./Imm. -0.432 *** -0.196 *** -0.497 *** -0.335 ***
2. Cognitive -0.365 *** -0.227 *** -0.363 *** -0.288 ***
3. PEM -0.633 *** -0.371 *** -0.432 *** -0.380 ***
4. Sleep -0.176 *** -0.068 -0.172 *** -0.133 ***
Forschen
Sci
O p e n H U B f o r S c i e n t i f i c R e s e a r c hOpen Access
methods of classifying patients into diagnostic categories, and this critical research activity can enable investigators to better understand etiology, pathophysiology, and treatment approaches for ME and CFS, along with other disorders.
Acknowledgement
The authors appreciate the funding provided by NIAID (grant numbers AI 49720 &AI 055735). The authors acknowledge Suzanne D. Vernon’s contribution and that of the Solve ME/CFS Initiative, which approved the use of de-identified Solve ME/CFS BioBank registry data in this analysis.
Conflicting Interests:
None to discloseReferences
1. Holmes GP, Kaplan JE, Gantz NM, Komaroff AL, Schonberger LB, et al. (1988) Chronic fatigue syndrome: a working case definition. Ann Intern Med 108: 387-389.
2. Fukuda K, Straus SE, Hickie I, Sharpe MC, Dobbins JG, et al. (1994) The chronic fatigue syndrome: A comprehensive approach to its definition and study. Ann Intern Med 121: 953-959.
3. Jason LA, Richman JA, Rademaker AW, Jordan KM, Plioplys AV, et al. (1999) A community-based study of chronic fatigue syndrome. Arch Intern Med 159: 2129-2137.
4. De Becker P, McGregor N, De Meirleir K (2001) A definition-based analysis of symptoms in a large cohort of patients with chronic fatigue syndrome. J Intern Med 250: 234-240.
5. Reeves WC, Lloyd A, Vernon SD, Klimas N, Jason LA, et al. Identification of ambiguities in the 1994 chronic fatigue syndrome research case definition and recommendations for resolution.BMC Health Serv Res 3: 25.
6. Reeves WC, Wagner D, Nisenbaum R, Jones JF, Gurbaxani B, et al. (2005) Chronic fatigue syndrome--a clinically empirical approach to its definition and study. BMC Med 3:19.
7. Jason LA, Najar N, Porter N, Reh C (2009) Evaluating the Centers for Disease Control’s Empirical Chronic Fatigue Syndrome Case Definition. J Disabil Policy Stud 20: 93-100.
8. Carruthers BM, Jain AK, De Meirleir KL, Peterson DL, Klimas NG, et al. (2003) Myalgic encephalomyelitis/chronic fatigue syndrome: Clinical working case defintion, diagnostic and treatment protocols. J Chronic Fatigue Syndr 11: 7-115.
9. Carruthers BM, van de Sande MI, De Meirleir KL, Klimas NG, Broderick G, et al. (2011) Myalgic encephalomyelitis: International consensus criteria. J Intern Med 270: 327-338.
10. Friedberg F, Dechene L, McKenzie MJ, Fontanetta R (2000) Symptom patterns in long-duration chronic fatigue syndrome. J Psychosom Res 48: 59-68.
11. Jason LA, Corradi K, Torresharding S (2007) Toward an empirical case definition of CFS. J Soc Serv Res 34: 43-54.
12. Arroll MA, Senior V (2009) Symptom typology and sub-grouping in chronic fatigue syndrome. Bulletin of the IACFS/ME 17: 39-52. 13. Nisenbaum R, Reyes M, Mawle AC, Reeves WC (1998) Factor
analysis of unexplained severe fatigue and interrelated symptoms: overlap with criteria for chronic fatigue syndrome. Am J Epidemiol 148: 72-77.
14. Nisenbaum R, Reyes M, Unger ER, Reeves WC (2004) Factor analysis of symptoms among subjects with unexplained chronic fatigue: what can we learn about chronic fatigue syndrome? J Psychosom Res 56: 171-178.
15. Hickie I, Davenport T, Vernon SD, Nisenbaum R, Reeves WC, et al. (2009) Are chronic fatigue and chronic fatigue syndrome valid clinical entities across countries and health-care settings? Aust N Z J Psychiatry 43: 25-35.
16. Brown AA, Jason LA (2014) Validating a measure of myalgic encephalomyelitis/chronic fatigue syndrome symptomatology. Fatigue 2: 132-152.
17. Jason LA, Evans M, Brown M, Porter N, Brown A, et al. (2011) Fatigue scales and chronic fatigue syndrome: Issues of sensitivity and specificity. Disabil Stud Q 31: 1375.
18. Jason LA, Skendrovic B, Furst J, Brown A, Weng A, et al. (2012) Data mining: Comparing the empiric CFS to the Canadian ME/CFS case definition. J Clin Psychol 68: 41-49.
19. Jason LA, Kot B, Sunnquist M, Brown A, Evans M, et al. (2015) Chronic fatigue Syndrome and myalgic encephalomyelitis: toward an empirical case definition. Health Psychol Behav Med 3: 82-93. 20. Jason LA, Evans M, Porter N, Brown M, Brown A, et al. (2010) The
development of a revised Canadian myalgic encephalomyelitis chronic fatigue syndrome case definition. Am J Biochem Biotechnol 6: 120-135.
21. Jason LA, So S, Brown AA, Sunnquist M, Evans M (2015) Test-retest reliability of the DePaul Symptom Questionnaire. Fatigue 3: 16-32. 22. Brown M, Kaplan C, Jason L (2012) Factor analysis of the Beck
Depression Inventory-II with patients with chronic fatigue syndrome. J Health Psychol 17: 799-808.
23. Ware JE, Sherbourne CD (1992) The MOS 36-item Short-Form health survey (SF-36). I. Conceptual framework and item selection. Med Care 30: 473-483.
24. Institute of Medicine (2015) Beyond myalgic encephalomyelitis/ chronic fatigue syndrome: Redefining an illness. The National Academies,Washington, DC.
25. Jason LA, Sunnquist M, Brown A, Newton JL, Strand EB, et al. (2015) Chronic fatigue syndrome versus Systemic Exertion Intolerance Disease. Fatigue 3: 127-141.