In Pursuit of Excellence in Science
Vol. 6, No. 1, June 2012 • ISSN : 1823-6782
ASM
Science Journal
6(1) 2012
RESEARCH ARTICLES
Female Shrouded Connector Production Process
Variability Monitoring: A Robust Approach 1
R.M. Salleh and M.A. Djauhari
Sludge-derived Fuel from Latex Products Manufacturing Industry 15
V. Devaraj and M.N. Zairossani
A Class of Estimators for Assessing the Population Mean
under Non-response Using Auxiliary Information 23
M.K. Chaudhary, R. Singh, M. Kumar, A. Kr. Singh and A.A. Adewara
Effect of High Silica Loading on Uncured Properties of
Epoxidised Natural Rubber Compounds 31
M.K. Mazlina and M.S. Che Su
Insights from the Preliminary Autocorrelation Analysis of Low
Frequency Neuronal Oscillations during Quran Listening 39
F. Reza, T. Begum, A.L. Ahmed, H. Omar, M. Muzaimi and J.M. Abdullah
Tools for Integrated River Flood Management
(Hydraulics Modeling and Logical Framework Analysis) 47
C.H.J. Bong, D.Y.S. Mah, F.J. Putuhena, S. Said and R.A. Bustami
Kinetic Modelling of Ethanol Fermentation Process Using Cassava
(Manihot esculenta) Starch as Carbon Source 61
C.Y. Low, S.L. Hii, L.K. Leong, Y.Y. Yim and H.W. Tan
Contents
ASM Sc. J. Volume 6(1), 2012
intro.indd 1
•
intro.indd 1
•
Price (2 Issues)
Malaysia: RM100 (Individual) RM200 (Institution)
Other Countries: USD50 (Individual) USD100 (Institution)
INTERNATIONAL ADVISORY BOARD
Ahmed Zewail (Nobel Laureate)
Richard R. Ernst (Nobel Laureate)
John Sheppard Mackenzie
M.S. Swaminathan
EDITORIAL BOARD
Editor-in-Chief/Chairman: Md. Ikram Mohd Said
Abdul Latiff Mohamad
Chia Swee Ping
Ibrahim Komoo
Lam Sai Kit
Lee Chnoong Kheng
Looi Lai Meng
Mashkuri Yaacob
Mazlan Othman
Mohd Ali Hashim
Francis Ng
Radin Umar Radin Sohadi
intro.indd 1
•
Cover:
Two figures are depicted―emanating from the findings of researchers from the Faculty of Engineering, University of Malaysia Sarawak in the article entitled Tools for Integrated River Flood Management (Hydraulics Modeling and Logical Framework Analysis), (pp. 47–60). In the context of the various problems attributed by climate changes, river basin management is vital in ‘achieving the protection, improvement and sustainable use of the water environment’. This article discusses how hydraulic
simulation could be used as a supporting tool in planning and developing a framework for river management such as Integrated Flood Management for a river basin. It also demonstrates how a
hydraulic model for the Sarawak River Basin was run using InfoWorks River Simulation software. The model was used as a tool to provide necessary decision parameters in developing the logical
framework which could act as a guide for planning involving various stakeholders’ participation.
The figure on the upper section of the cover (Figure 7, pp. 56) shows the simulation of the January 2004 flood event with the flood bypass channel in the lower Sarawak River. The lower image on
the cover (Figure 2, pp. 49) is a technical drawing of the flood bypass structure superimposed on a
satellite image. The flood bypass would include an 8 km long, 250 m base width, 10 m depth earth-dug (nature-like) rectangular channel (Jurutera Jasa Consulting Engineers) which is expected to be completed by 2015.
In Pursuit of E
xcellence in Scienc
e
Vol. 6, No. 1, June 2012 • ISSN : 1823-6782
© Academy of Sciences Malaysia
All rights reserved. No part of this publication may be reproduced in any form or by any means without permission in writing from the Academy of Sciences Malaysia.
The Editorial Board, in accepting contributions for publications, accepts no responsibility for the views expressed by authors.
ASM Science Journal is listed and indexed in Scopus.
Published by the Academy of Sciences Malaysia
The Academy of Sciences
Malaysia (ASM)
The Academy of Sciences Malaysia (ASM) was established, under the Academy of Sciences Act 1994
which came into force on 1 February 1995, with the ultimate aim to pursue excellence in science. Thus the mission enshrined is to pursue, encourage and enhance excellence in the field of science, engineering and technology for the development of the nation and the benefit of mankind.
The functions of the Academy are as follows:
•
To promote and foster the development of science, engineering and technology•
To provide a forum for the interchange of ideasamong scientists, engineers and technologists
•
To promote national awareness, understanding andappreciation of the role of science, engineering and technology in human progress
•
To promote creativity among scientists, engineersand technologists
•
To promote national self-reliance in the field of science, engineering and technology•
To act as a forum for maintaining awareness on thepart of the Government of the significance of the role of science, engineering and technology in the
development process of the nation and for bringing national development needs to the attention of the
scientists, engineers and technologists
•
To analyse particular national problems and identify where science, engineering and technology can contribute to their solution and accordingly tomake recommendations to the Government
•
To keep in touch with developments in science,engineering and technology and identify those
developments which are relevant to national needs to bring such developments to the attention of the Government
•
To prepare reports, papers or other documents relating to the national science, engineering and technology policy and make the necessary recommendationsto the Government
•
To initiate and sponsor multi-disciplinary studies related to and necessary for the better understanding of the social and economic implications of science, engineering and technology•
To encourage research and development andeducation and training of the appropriate scientific,
engineering and technical man power
•
To establish and maintain relations between theAcademy and overseas bodies having the same or almost similar objectives in science, engineering and technology as the Academy
•
To advise on matters related to science, engineering and technology as may be requested by the Governmentfrom time to time; and
•
To carry out such other actions that are consistent withthe 1994 Academy of Sciences Act as may be required
in order to facilitate the advancement of science, engineering and technology in Malaysia, and the well being and status of the Academy.
The Academy is governed by a Council. Various Working Committees and Task Forces are charged with developing strategies, plans and programmes in line with the Academy’s objectives and functions.
The functions of the Council are:
•
To formulate policy relating to the functions of the Academy•
To administer the affairs of the Academy•
To appoint such officers or servants of the Academy as are necessary for the due administration of the Academy•
To supervise and control its officers and servants•
To administer the Fund; and•
To convene general meetings of the Academy to decide on matters which under this Act are required to be decided by the Academy.The Academy has Fellows and Honorary Fellows. The
Fellows comprise Foundation Fellows and Elected
Fellows. The Academy Fellows are selected from the ranks of eminent Malaysian scientists, engineers and technocrats in the fields of medical sciences, engineering sciences, biological sciences, mathematical and physical sciences, chemical sciences, information technology and science and technology development and industry.
The Future
Creativity and innovation are recognised the world over as the key measure of the competitiveness of a nation. Within the context of K-Economy and the framework of National Innovation System (NIS), ASM will
continue to spearhead efforts that will take innovation
and creativity to new heights in the fields of sciences, engineering and technology and work towards making Malaysia an intellectual force to be reckoned with. intro.indd 1
•
RESEARCH ARTICLES
Female Shrouded Connector Production Process
Variability Monitoring: A Robust Approach 1
R.M. Salleh and M.A. Djauhari
Sludge-derived Fuel from Latex Products Manufacturing Industry 15
V. Devaraj and M.N. Zairossani
A Class of Estimators for Assessing the Population Mean
under Non-response Using Auxiliary Information 23
M.K. Chaudhary, R. Singh, M. Kumar, A. Kr. Singh and A.A. Adewara
Effect of High Silica Loading on Uncured Properties of
Epoxidised Natural Rubber Compounds 31
M.K. Mazlina and M.S. Che Su
Insights from the Preliminary Autocorrelation Analysis of Low
Frequency Neuronal Oscillations during Quran Listening 39
F. Reza, T. Begum, A.L. Ahmed, H. Omar, M. Muzaimi and J.M. Abdullah
Tools for Integrated River Flood Management
(Hydraulics Modeling and Logical Framework Analysis) 47
C.H.J. Bong, D.Y.S. Mah, F.J. Putuhena, S. Said and R.A. Bustami Kinetic Modelling of Ethanol Fermentation Process Using Cassava
(Manihot esculenta) Starch as Carbon Source 61
C.Y. Low, S.L. Hii, L.K. Leong, Y.Y. Yim and H.W. Tan
Contents
ASM Sc. J. Volume 6(1), 2012
COMMENTARY
The Interplay between the Civil Society and the Private Sector,
Especially for Resource Mobilization 67
Martin Abraham
NEWS FOCUS
Energy Inaction Warning—Rio+20 Report 71
Ahmad Ibrahim
Population Growth and Unsustainable Consumption—
Inter-Academy Panel Warns of Dire Consequences 72
Ahmad Ibrahim
Water Scarcity—A Growing Concern of the Power Sector 74
Ahmad Ibrahim
ANNOUNCEMENTS
World Innovation Forum Kuala Lumpur (WIF-KL) 75
Young Scientists Network—Academy of Sciences Malaysia 76
The ASM National Nobel Laureate Programme 77
Mahathir Science Award Foundation 78
1
This paper is about action research in the area of the healthcare industry, aimed to give contributions to the economic development of the country and motivated by the fact that (i) the global market requirement for industry products of high quality has become more and more complex from time to time, to fulfil this requirement, the only way is to consider quality as a multivariate entity; (ii) multivariate consideration of the manufacturing process in Malaysia is still not well developed due to the lack of expertise.
The situation is very unfortunate because the manufacturing sector is one of the principal contributors to Malaysian economic development as will be explained in the next sub-sections.
Contribution of the Manufacturing Sector
It has been recognized internationally that the history of Malaysia economic development is remarkable; from a low income country in the early period of independence, to the middle in just a few decades and now towards a high income country. One of the most principal contributors to that achievement was and is the manufacturing sector. According to the World Bank report released in 2011, the proportion of manufactured production grew from roughly 20 percent of Gross Domestic Product (GDP) in the early
1980s to 31.5 percent of GDP in the late 1990s. However, it was reported to have decreased to 26.17 percent in 2008, 25.53 percent in 2009 and was last reported at 26.11 percent in 2010. This situation has given a positive impact to the Malaysia GDP which is worth 238 billion US dollars or 0.38% of the world economy. In general, the trend was always increasing except for certain periods but then it immediately recovered. In the last decade, the manufacturing sector had made a very significant contribution of more than 25% each year to the GDP.
Due to the urgent and important role of the manufacturing sector, this research effort was conducted in order to improve the competitiveness of Malaysian manufacturing products in the global, as well as regional and local markets. Why Healthcare Industry?
Malaysia’s journey towards achieving a high income economy had gained momentum as reflected by a remarkable leap in its world competitiveness ranking from 18th position in 2009, to 10th in 2010 and 16th in 2011. It had been confirmed that the capability of Malaysian manufacturing industries was trusted worldwide. Among the top 10 exported manufacturing products, electrical and electronic products remained the most significant driver of the Malaysian economy. In general, the export-driven
Female Shrouded Connector Production Process
Variability Monitoring: A Robust Approach
R.M. Salleh1,2* and M.A. Djauhari1
A monitoring procedure was introduced for process variability in a multivariate setting based on individual observations which was a combination of (i) robust high breakdown point approach in the set-up stage to determine the reference sample and (ii) the use of Wilks chart in the mass production stage. This setting is what the Malaysian manufacturing industry is currently lacking in, especially when a robust approach must be used. The advantage of this procedure was revealed by using the case of a female shrouded connector production process in a Malaysian industry. Moreover, this procedure could also be used in any process quality monitoring and for any industry. A recommendation for quality practitioners was also addressed.
Key words: Medical devices production; robust parameter estimates; manufacturing process; multivariate statistical process control; Wilks’ statistic
ASM Sci. J., 6(1), 1–13
1Department of Mathematical Sciences, Universiti Teknologi Malaysia, Johor Bahru, Malaysia
2Department of Mathematics and Statistics, Universiti Tun Hussein Onn Malaysia, Batu Pahat, Johor, Malaysia
*Corresponding author (e-mail: [email protected]; [email protected])
ASM Science Journal, Volume 6(1), 2012
2
economy was encouraged by high technology, knowledge-based and capital-intensive, creative ICT's such as in the healthcare manufacturing industries.
For this research project we chose the healthcare manufacturing industry or more specifically medical devices manufacturing, as our focus for the following reasons:
(i) The medical devices manufacturing industry was a knowledge-based and capital-intensive industry. Driven by rapid transfer of technology, this industry had changed in the past years and would continue to do so for producing durable and non-durable tools.
(ii) Compared to other industries, the manufacture of medical devices had a higher growth rate, smaller sized products, lower production volume, tighter government regulation, rigorous testing of long-term effects, higher costs and severe penalties for mistakes in design or manufacturing.
Therefore, the medical devices manufacturing process and so many other biomedical manufacturing processes (Shih 2008), needs special attention from the government in terms of their quality.
How to monitor the quality of such a manufacturing process? This is what we want to present in this paper. As a case study, we discuss about monitoring a female shrouded connector (FSC) production process in a Malaysia industry, in Johor Bahru. Due to its confidentiality, the name of the industry is kept anonymous. In this process, the overall quality of product is defined by a number of correlated
quality characteristics. Therefore, since the correlations among characteristics must be taken into consideration, companies are not allowed to control each characteristic one by one. This means that companies cannot escape from a multivariate scheme. Consequently, the implementation of multivariate statistical process control (MSPC) is a must (Djauhari 2011) to fulfil global market requirements. See, for example, Sellick (1993), Shahian et al. (1996), Hanslik et al. (2001), Mohammed et al. (2001), and Woodall (2006) for further discussions on the role of MSPC in the healthcare industry and public health surveillances. Current Situation
Recently, Rahman et al. (2009) mentioned that, in general, Malaysian companies preferred to operate using simple control charts and manual systems using paper and pencil to monitor the quality of production process. They did not implement MSPC. This was far from global market standard (Montgomery 2005; Woodall 2006). The implementation of MSPC was really new in Malaysian companies (Talib 2011). Other problems or barriers to the implementation of MSPC techniques were due to the lack of commitment and support from top management. If those situations continuously happened, what was next for our manufacturing industry?
These situations had motivated us to conduct research on the implementation of MSPC to monitor the quality of the female shrouded connector production process. Since quality is the reciprocal of process variability, our discussion would be focused on process variability monitoring. Furthermore, since the products had an Textiles and clothings
Prosessed food
Other manufactures
Wood products
Rubber products
Optical and scientific equipments
Manufacturers of metal
Machinery, appliances and parts
Chemicals and chemical products
Electrical and electronic products
Jan – Oct 2010
Jan – Oct 2011
0 50 100
RM (Billion)
150 200 250
(Source: MITI Weekly Bulletin, Vol. 171.)
Figure 1. Top 10 exported manufacturing products.
R.M. Salleh and M.A. Djauhari: Female Shrouded Connector Production Process Variability Monitoring
3
immediate impact on human life, the quality of process manufacturing had to be monitored to be as robust as possible. This meant that the reference sample issued as from Phase I operation or equivalently the set-up operation or start-up stage was obtained by using a robust estimation method. Vargas (2003), Jensen et al. (2007) and Chenouri et al. (2009) provide further discussions on robust Phase I. For our purpose, we had used a fast minimum covariance determinant (FMCD) as the robust estimation method for the following reasons:
(i) It gives a high breakdown point estimator which ensures a high degree of robustness (Rousseeuw 1985 & Hampel 2001).
(ii) It has a bounded influence function which ensures that the presence of outliers can only have a small effect on an estimator (Hubert et al. 2008). (iii) The estimators are affine equivariants which ensure that any affine transformation does not affect the degree of its robustness (Hubert et al. 2008).
With the reference sample (RS) as the baseline, in process monitoring operation in Phase II or also called mass production process, we used the most recent technique based on Wilks’ statistic introduced by Mason et al. (2009).
The rest of the paper is organized as follows. In the following sections we briefly explain the production
process of the female shrouded connector and present the implementation of FMCD in Phase I operation to obtain the robust reference sample. The result will be compared to that issued from the non-robust method to illustrate the advantage of the implementation of Wilks chart during the Phase II operation to monitor the process. A discussion, followed by some conclusions are also shown. This paper will be closed by a recommendation in the last section.
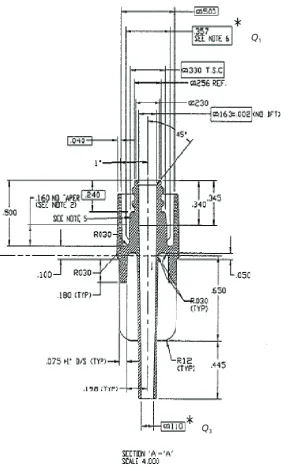
QUALITY CHARACTERISTICS OF FEMALE SHROUDED CONNECTOR
A female shrouded connector, (Figure 2) is one of the components of intravenous drip in the medical devices industry. The production of this item applies an injection plastic mould and the raw material is Lustran ABS. Injection moulding involves taking plastic in the form of pellets or granules and heating this material until a melt is obtained. Then the melt is forced into a split-die chamber where it is allowed to ‘cool’ into the desired shape. The mould is then opened and the part is ejected, at which time the cycle is repeated.
However, in the biomedical industry, the raw materials and the metal involved in injection moulding process were very specific in order to avoid chemical reactions that would affect the end users.
Textiles and clothings
Prosessed food
Other manufactures
W
ood products
Rubber products
Optical and scientific equipments
Manufacturers of metal
Machinery
, appliances and parts
Chemicals and chemical products Electrical and electronic products Jan – Oct 2010 Jan – Oct 2011
0
50
100
RM (Billion)
150
200
250
Figure 2. Two dimensional picture of female shrouded connector.
ASM Science Journal, Volume 6(1), 2012
4
The sample of final product from the mass production operation undergoes functional checks using Luer gauging test and liquid leakage test. The final product is rejected if there is formation of one air bubble that releases from the connector surface and replaces itself in ten seconds. One important way to handle this problem is to monitor the variability of the production process.
The quality of the products is measured based on the behaviour of p = 3 interrelated quality characteristics also called critical to qualities (CTQ), namely:
(i) Outer diameter of the lowest part (Q1) (ii) Length of the neck (Q2), and (iii) Diameter of the inner part (Q3).
The CTQs Q1, Q2 and Q3 refer to the important measurements of parts represented by asterisks in Figures 3 and 4. All measurements are taken on-line by using a smart scope.
PHASE I OPERATION
In the plastic industry, the term cavity represents the sampled products used in process control. There were 32 cavities available as historical data set (HDS) for Phase I operation to obtain the RS that would be used to monitor the process during mass production in Phase II. The main problem in the phase was to estimate the covariance matrix to define variability. That estimate should come from the clean data subset of HDS which were free from the presence of even one single outlier (Jensen et al. 2007). That data subset was the RS that we needed.
We selected the RS from HDS by using FMCD since it possessed commendable properties such as high breakdown point, bounded influence function and affine equivariant. The output of the phase were robust estimates of mean vector and covariance matrix. Since n > 25, and n – p > 25 to 30, as suggested by Hubele (1989) the cut-off
Figure 3. Technical drawing of FSC (side view).
Q2
R.M. Salleh and M.A. Djauhari: Female Shrouded Connector Production Process Variability Monitoring
5
value or equivalently, the upper control limit (UCL) could be determined by using chi-square approximation, χ2
a,p; the (1–a)-th quantile of chi-square distribution with p degrees of freedom.
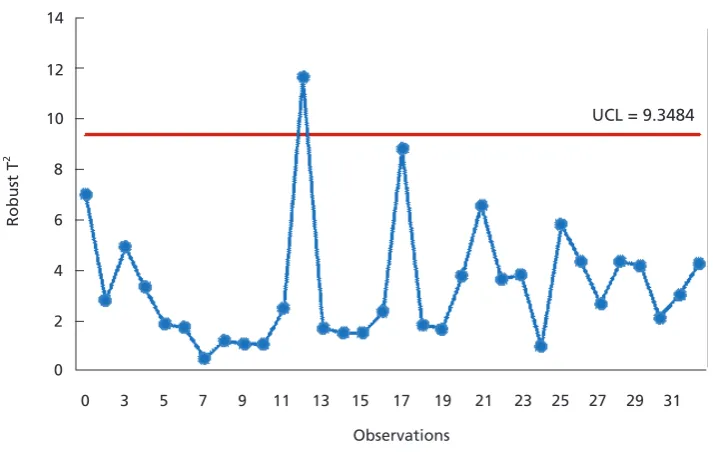
In Figure 5 we present the control chart T2
which represents the history of robust Phase I operation based on 32 cavities with a = 0.025. The horizontal axis is the cavity number and the vertical axis is the robust Mahalanobis square distance (MSD) or equivalently, Hotelling’s T2
statistic for each cavity i from 1 until 32,
(1)
Here X1, X2, ..., Xn are the HDS which are assumed to follow a 3-variate normal distribution, XFMCD and SFMCD are
the robust estimates of the mean and covariance matrix, respectively, obtained by using FMCD, while S–1
FMCD is the
inverse of SFMCD. Each observation vector Xi consists of 3 components which represent the random variable Q1, Q2
and Q3, respectively. The details of FMCD can be found
in Rousseeuw and van Driessen (1999) and for practical purpose, its algorithm can be seen in Herwindiati et al. (2007).
Figure 5 shows that sample 12 was out of control. Therefore, the RS consisted of 31 cavities after removing Figure 4. Technical drawing of FSC (cross section view).
( )
(
)
(
)
2 1
i FMCD FMCD i FMCD
T i = X −X ‘S− X −X
RS
X = SRS =
0.3557
(
(
(
)
(
)
)
)
0.1014
0.1669
3.7 06 2.1 07 6.0 08
2.1 07 6.5 07 1.8 07
6.0 08 1.8 07 3.4 06
E E E
E E E
E E E
− − − − −
− − − −
− − − − .
1 p
A
S n W
n S
− =
1 ,
2 2
n p p
Beta −
Q3
Q1
ASM Science Journal, Volume 6(1), 2012
6
that sample point from HDS. After some calculations, this RS gave us the following robust estimates of the mean vector and covariance matrix of the process,
and
These were the baselines of the parameters, mean vector and covariance matrix that would be used during Phase II operation. Before we proceed to Phase II operation, it was important to underline that based on non-robust approach, the control chart in Phase I operation gave us a different history of process variability as can be seen in Figure 6. More importantly, this approach gave HDS as RS because no out of control signal occurs in that figure. As we all know, non-robust approach is referring to the classical Hotelling’s T2 (Tracy et al. 1992 & Montgomery 2005).
PHASE II OPERATION
Wilks’s statistic is an appropriate statistical test to detect the shift in process variability based on individual observations after a reference sample has been determined. In practice, that statistic works as follows. Let X1, X2,..., Xn be the reference sample and Xn+1 be an individual sample that
will be used to conduct Phase II operation. Wilks’s statistic (Wilks 1962, 1963) is defined as:
where |S| and |SA| are the determinants of covariance matrix issued from reference sample and the augmented data set (ADS), respectively. Here ADS refers to X1, X2,..., Xn and
Xn+1 which are assumed to follow a multivariate normal distribution with mean vector μ and covariance matrix positive definite.
In Table 1, we present 32 individual observations that we used in Phase II operation collected half hourly. Based on these data, and the robust estimate of covariance matrix issued from Phase I, we calculated Wilks’ statistic for each observation. The results are presented in Table 2.
To construct a Wilks’ control chart, let us use the probability of false alarm a = 0.025 (Mason & Young 2002). In terms of hypothesis testing, a is the so called type I error. With that value of a, the lower control limit (LCL) is the a-th quantile of beta distribution, with n1 = 31, i.e. LCL = 0.7202. This LCL together with data from Table 2 are plotted in Figure 7. This figure shows that an out of control signal occurs at the fifth sample.
It is important to note that when the non-robust method is used in Phase I, the RS issued from that phase and data in Table 1 lead to the control chart in Figure 8. This figure, compared to Figure 7, tell a different history of process variability. Figure 8 shows there is no out-of control signal.
To illustrate what happened to sample 5 in Figure 7, we will compare the structure of covariance matrix issued from robust reference sample with that issued from ADS in 14
12
10
8
6
4
2
0
0 3 5 7 9 11 13 15 17
Observations
Robust T
2
19 21 23 25 27 29 31
10
8
6
4
2
0
0 3 5 7 9 11 13 15 17
Observations
Non-robust T
2
19 21 23 25 27 29 31
Figure 5. Robust Phase I operation.
UCL = 9.3484
( )
(
)
(
)
2 1
i FMCD FMCD i FMCD
T i = X −X ‘S− X −X
RS
X = SRS=
0.3557
(
(
(
)
(
)
)
)
0.1014
0.1669
3.7 06 2.1 07 6.0 08
2.1 07 6.5 07 1.8 07
6.0 08 1.8 07 3.4 06
E E E
E E E
E E E
− − − − −
− − − −
− − − − .
1 p
A
S n W
n S
− =
1 ,
2 2
n p p Beta −
( )
(
)
(
)
2 1
i FMCD FMCD i FMCD
T i = X −X ‘S− X −X
RS
X = SRS =
0.3557
(
(
(
)
(
)
)
)
0.1014
0.1669
3.7 06 2.1 07 6.0 08
2.1 07 6.5 07 1.8 07
6.0 08 1.8 07 3.4 06
E E E
E E E
E E E
− − − − −
− − − −
− − − − .
1 p
A
S n W
n S
− =
1 ,
2 2
n p p Beta −
( )
(
)
(
)
2 1
i FMCD FMCD i FMCD
T i = X −X ‘S− X −X
RS
X = SRS=
0.3557
(
(
(
)
(
)
)
)
0.1014
0.1669
3.7 06 2.1 07 6.0 08
2.1 07 6.5 07 1.8 07
6.0 08 1.8 07 3.4 06
E E E
E E E
E E E
− − − − −
− − − −
− − − − .
1 p
A
S n W
n S
− =
1 ,
2 2
n p p Beta −
( )
(
)
(
)
2 1
i FMCD FMCD i FMCD
T i = X −X ‘S− X −X
RS
X = SRS=
0.3557
(
(
(
)
(
)
)
)
0.1014
0.1669
3.7 06 2.1 07 6.0 08
2.1 07 6.5 07 1.8 07
6.0 08 1.8 07 3.4 06
E E E
E E E
E E E
− − − − −
− − − −
− − − − .
1 p
A
S n W
n S
− =
1 ,
2 2
n p p Beta −
R.M. Salleh and M.A. Djauhari: Female Shrouded Connector Production Process Variability Monitoring
7
14
12
10
8
6
4
2
0
0 3 5 7 9 11 13 15 17
Observations
Robust T
2
19 21 23 25 27 29 31
10
8
6
4
2
0
0 3 5 7 9 11 13 15 17
Observations
Non-robust T
2
19 21 23 25 27 29 31
Figure 6. Non-robust Phase I operation.
Table 1. Observations in Phase II monitoring operation.
No Q1 Q2 Q3 No Q1 Q2 Q3
1 0.3571 0.1013 0.1659 17 0.3530 0.1008 0.1698
2 0.3554 0.1020 0.1699 18 0.3554 0.1017 0.1667
3 0.3531 0.1008 0.1692 19 0.3559 0.1023 0.1683
4 0.3559 0.1002 0.1699 20 0.3551 0.1012 0.1649
5 0.3540 0.0987 0.1682 21 0.3589 0.0999 0.1684
6 0.3559 0.1013 0.1683 22 0.3540 0.1008 0.1689
7 0.3563 0.1022 0.1678 23 0.3554 0.1020 0.1649
8 0.3582 0.1010 0.1674 24 0.3574 0.1011 0.1697
9 0.3557 0.1012 0.1653 25 0.3585 0.1025 0.1653
10 0.3584 0.1008 0.1659 26 0.3534 0.1016 0.1656
11 0.3561 0.1002 0.1662 27 0.3533 0.1013 0.1669
12 0.3567 0.0987 0.1659 28 0.3549 0.1000 0.1659
13 0.3583 0.1013 0.1679 29 0.3536 0.1014 0.1643
14 0.3548 0.1022 0.1662 30 0.3562 0.1026 0.1684
15 0.3588 0.1010 0.1672 31 0.3574 0.1015 0.1643
16 0.3588 0.1012 0.1664 32 0.3560 0.1029 0.1697
Table 2. Wilks’ statistic.
No Wilks No Wilks No Wilks No Wilks
1 0.9749 9 0.9743 17 0.8441 25 0.8495
2 0.9163 10 0.9253 18 0.9951 26 0.9382
3 0.8708 11 0.9278 19 0.9513 27 0.9474
4 0.8470 12 0.7274 20 0.9575 28 0.8914
5 0.6789 13 0.9375 21 0.8232 29 0.9035
6 0.9806 14 0.9597 22 0.9115 30 0.9204
7 0.9624 15 0.9203 23 0.9418 31 0.9155
8 0.9429 16 0.9226 24 0.9051 32 0.8582
UCL = 9.3484
ASM Science Journal, Volume 6(1), 2012
8
terms of total variance shift, variance shift and correlation shift.
Total Variance Shift
The value of total variance (TV) from robust RS as in Section 3 is Tr(SRS) = 7.79318E-06. By using this value as the baseline, for each observation in Phase II, we calculated the total variance of the corresponding ADS. The shift from the baseline for each observation is visualized in Figure 9 in the form of a run chart of total variance shift.
This figure indicates that the out-of-control signal at sample 5 is not caused by the shift of total variance because according to the total variance, sample 17 is higher than sample 5 but the former is not an out of control sample. Variance Shift
The same procedure was used to visualize the shift in variance of each quality characteristic. The results are presented in Figure 10 where s11, s22, and s33 are the variance of the 1st, 2nd and 3rd characteristic, respectively. According to this figure, it seems that the signal that occurred at sample 5 was caused by the shift in variance of the second characteristic.
Correlation Shift
In order to support the finding in Figure 7, we further analyzed from the viewpoint of correlation structure. We compared the value of correlation coefficient given by ADS with that given by the robust reference sample
as the baseline. The results for each of the two different characteristics are visualized in Figure 11. In this figure, r12, r13 and r23 are the correlation coefficients of the 1st and 2nd, 1st and 3rd, and 2nd and 3rd characteristics, respectively.
This figure shows the large shift of r12 and r23 at sample 5. Therefore, the out-of-control signal showed by Figure 7 was seemingly caused by the shift of correlation of the 1st and 2nd characteristics and the correlation of the 2nd and 3rd characteristics. This indicated that more attention should be paid to the quality characteristic ‘length of the neck of female shrouded connector’ (Q2).
DISCUSSION
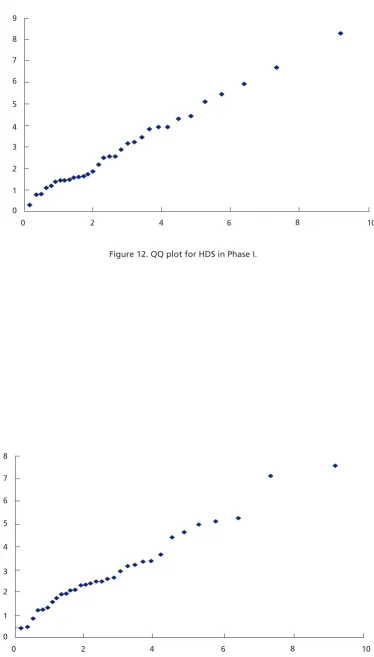
In the monitoring procedure presented above, it was assumed that HDS came from a multivariate normal distribution. It was so with data used in Phase II. Therefore, the above results depended on the appropriateness of that assumption. Thus, we need to check that assumption. In Figures 12 and 13 we present, respectively, the QQ plot of HDS used in Phase I and that of all observations used in Phase II. These figures show that the multivariate normality assumption was not violated. For HDS (Figure 12), the degree of linearity in terms of probability plot correlation coefficients (PPCC) between the theoretical and experimental quantiles is 0.9892 while for the data set during Phase II (Figure 13), it is 0.9672. See SEMATECH at <http://www.itl.nist.gov/div898/handbook/ index.htm> for details of PPCC. These correlations are extremely high. Therefore, the results presented above are valid.
1
0.75
0.50
0 3 5 7 9 11 13 15 17
Observations
W
19 21 23 25 27 29 31
1
0.75
0.50
0 3 5 7 9 11 13 15 17
Observations
W
19 21 23 25 27 29 31
Figure 7. Wilks’ chart of robust Phase 1.
LCL = 0.7202
1
0.75
0.50
0 3 5 7 9 11 13 15 17
Observations
W
19 21 23 25 27 29 31
1
0.75
0.50
0 3 5 7 9 11 13 15 17
Observations
W
19 21 23 25 27 29 31
3.00E-07
2.00E-07
1.00E-07
1.00E-21
–1.00E-07
–2.00E-07
–3.00E-07
0 3 5 7 9 11 13 15 17
Observations Baseline
TV shift
19 21 23 25 27 29 31
2.50E-07
2.00E-07
1.00E-07
5.00E-07 1.50E-07
0.00E-21
–5.00E-07
–1.00E-07
–1.50E-07
0 3 5 7 9 11 13 15 17
Observations
Baseline s33
s22 s11
V
ariance shift
19 21 23 25 27 29 31
Figure 8. Wilks chart on non-robust Phase I.
Figure 9. Run chart of total variance shift.
LCC = 0.7282
3.00E-07
2.00E-07
1.00E-07
1.00E-21
–1.00E-07
–2.00E-07
–3.00E-07
0 3 5 7 9 11 13 15 17
Observations Baseline
TV shift
19 21 23 25 27 29 31
2.50E-07
2.00E-07
1.00E-07
5.00E-07 1.50E-07
0.00E-21
–5.00E-07
–1.00E-07
–1.50E-07
0 3 5 7 9 11 13 15 17
Observations
Baseline s33
s22 s11
V
ariance shift
19 21 23 25 27 29 31
0 1 2 3 4 5 6 7 8 9
0 2 4 6 8 10
0.15
0.10
0.05
0
–0.05
–0.10
0 3 5 7 9 11 13 15 17
Observations
Baseline r23
r13 r12
Correlation shift
19 21 23 25 27 29 31
9
8
7
6
5
4
3
2
1
0
0 2 4 6 8 10
Figure 10. Run chart of variance shift.
Figure 11. Run chart of correlation coefficient shift.
0 1 2 3 4 5 6 7 8 9
0 2 4 6 8 10
0.15
0.10
0.05
0
–0.05
–0.10
0 3 5 7 9 11 13 15 17
Observations
Baseline r23
r13 r12
Correlation shift
19 21 23 25 27 29 31
9
8
7
6
5
4
3
2
1
0
0 2 4 6 8 10
0 1 2 3 4 5 6 7 8
0 2 4 6 8 10
8
7
6
5
4
3
2
1
0
0 2 4 6 8 10
Figure 12. QQ plot for HDS in Phase I.
Figure 13. QQ plot for observations in Phase II.
ASM Science Journal, Volume 6(1), 2012
12
Figures 5 and 6 which present Phase I operation using robust and non-robust approaches respectively, show the advantage of the robust approach as compared to the non-robust. It is so with Figures 7 and 8 which show the advantages of using Wilks’s statistic based robust reference sample and that based on a non-robust one.
The same analysis as in Total Variance Shift until the Correlation Shift above has been conducted for non-robust approach. The results were quite interesting. The non-robust approach was not able to detect the abnormality in terms of the shift in correlation coefficients.
The analyses show that the robust method was more effective in detecting the shift than the non-robust one.
CONCLUSIONS
The use of FMCD in Phase I operation to determine the robust reference sample followed by the use of Wilks’s statistic in Phase II, was an improved procedure of process variability monitoring based on Wilks chart which covered both the phases.
The procedure would guarantee that the estimates of all parameters of female shrouded connector production process were robust with high breakdown points. Therefore, the history of process variability, portrayed by Wilks’s statistic in Figure 7, was robust.
It was interesting to note that the non robust approach in Figure 8 gave a different signal. That showed the advantage of the robust approach and simultaneously warned us that the use of the non-robust Phase I would jeopardize the process monitoring in Phase II.
Further analysis showed that the out of control signal at sample 5 in Figure 7 was caused by:
(i) The shift in variance of the second characteristic ‘length of the neck of female shrouded connector’ (Q2).
(ii) The shift in correlation of the 1st and 2nd characteristics and the correlation of the 2nd and 3rd characteristics.
That indicated that more attention should be paid to the quality characteristic ‘length of the neck of female shrouded connector’ (Q2) in the next production.
RECOMMENDATIONS
(i) Customer requirements, especially in the global market, have become more and more complex to agree with the customer’s level of appreciation
with the product. In order to survive and be able to satisfy the customer, companies are required to ensure that their production processes are of high quality. For this purpose, companies are required to frequently and continuously monitor the quality of the process.
(ii) Since, quality involves complex production systems which statistically mean that quality is multivariate in nature, the use of robust MSPC is a must. The application of the procedure used above shows its advantages.
(iii) The company needs to stay at the frontier of process monitoring technology or risk losing a potential customer and business.
ACKNOWLEDGEMENT
This research was sponsored by the Ministry of Higher Education, Government of Malaysia, through Fundamental Research Grant Scheme vote number 4F013 and Research University Grant Q.J13000.7126.02H18. The authors would like to thank Universiti Teknologi Malaysia. The first author would like to thank Universiti Tun Hussein Onn Malaysia for the opportunity to carry out this research. Special thanks go to Ms TS Basar for the permission to use her data in this research. Special thanks must go to the reviewers for the constructive comments and suggestion.
Date of submission: January 2012 Date of acceptance: May 2012
REFERENCES
Chenouri, S, Steiner, SH & Mulayath, A 2009, ‘A multivariate robust control chart for individual observations’, Journal
of Quality Technology, vol. 41, no. 3, pp. 259–271.
Djauhari, MA 2011, ‘Strategic roles of industrial statistics in modern industry’, ASM Science Journal, vol. 5, no. 1, pp. 53–63.
Hampel, F 2001, Robust statistics: a brief introduction and
overview, Research report no. 94, Seminar of Statistics,
Zurich, Switzerland.
Hanslik, T, Boelle, P & Flahault, A 2001, ‘The control chart: an epidemiological tool for public health monitoring’,
Public Health, vol. 115, pp. 277–281.
Herwindiati, DE, Djauhari, MA & Mahsuri, M 2007, ‘Robust multivariate outlier labelling’, Journal of Communication
in Statistics — Computation and Simulation, vol. 36,
1287–1294.
Hubele, NF 1989, ‘A multivariate and stochastic framework for statistical process control’, in Statistical Process Control
in Automated Manufacturing, eds JB Keats, & NF Hubele,
no. 15, Marcel Dekker Inc. New York.
Hubert, M, Rousseeuw, PJ & van Aelst, S 2008,’High breakdown robust multivariate methods’, Statistical
Sciences, vol. 23, no. 1, pp. 92–119.
R.M. Salleh and M.A. Djauhari: Female Shrouded Connector Production Process Variability Monitoring
13
Jensen, WA, Birch, JB & Woodall, WH 2007, ‘High breakdown point estimation methods for phase I multivariate control charts’, Quality and Reliability Engineering International, vol. 23, pp. 615–629.
Mason, RL, Chou, YM, & Young, JC 2009, ‘Monitoring variation in a multivariate process when the dimension is large relative to the sample size’, Communication in
Statistics — Theory and Methods, vol. 38, pp. 939–951.
Mason, RL & Young, JC 2002, Multivariate statistical
process control with industrial applications, ASA-SIAM,
Philadelphia.
Mohammed, MA, Cheng, KK, Rouse, A & Marshall, T 2001, ‘Bristol, shipman, and clinical governance: Shewhart’s forgotten lessons’, Lancet, vol. 357, pp. 463–467.
Montgomery, DC 2005, Introduction to Statistical Quality
Control, 5th ed, John Wiley & Sons Inc., New York.
Rahman, MN, Zain, RM, Nopiah, ZM, Ghani, JA, Deros, BM, Mohamad, N & Ismail, AR 2009, ‘The implementation of SPC in Malaysian manufacturing companies’,
European Journal of Scientific Research, vol. 26, no. 3, pp.
453–464.
Rousseeuw, PJ 1985, ‘Multivariate estimation with high breakdown point’, in Mathematical Statistics and
Applications, eds BW, Grossman, G, Pflug, I Vincze, & W.
Wertz, D. Reidel Publishing Company, 283–297.
Rousseeuw, PJ, & van Driessen, K 1999, ‘A fast algorithm for the minimum covariance determinant estimator’,
Technometrics, vol. 41, no.3, pp. 212–223.
Sellick, JA 1993, ‘The use of statistical process control charts in hospital epidemiology’, Infection Control in Hospital
Epidemiology, vol. 14, pp. 649–656.
SEMATECH, USA, 2004, <www.itl.nist.gov/div898/handbook/ index.htm>, Accessed on July 2004, National Institute Science and Technology.
Shahian, DM, Williamson, WA, Svensson, LG, Restuccia, JD & d’Agostino RS 1996, ‘Applications of statistical quality control to cardiac surgery’, Annals of Thoracic Surgery, vol. 62, pp. 1351–1359.
Shih, AJ 2008, ‘Biomedical manufacturing: a new frontier of manufacturing research’, Journal of
Manufacturing Science & Engineering, vol. 130. pp.
021009-1:021009-8, <//wumrc.engin.umich.edu/shiha/ jpapers/08JMSEShihbiomedicalmfg.pdf>, accessed on December 2011.
Talib, MA 2011, 'Quality monitoring with multivariate control charts for automotive stamped parts', PhD thesis, Universiti Malaysa, Kuala Lumpur.
Tracy, ND, & Young, JC 1992, ‘Multivariate control charts for individual observations’, Journal of Quality Technology, vol. 24, pp. 88–95.
Vargas, JA 2003, ’Robust estimation in multivariate control charts for individual observations’, Journal of Quality
Technology, vol. 35, pp. 367–376.
Wilks, SS 1962, Mathematical statistics, John Wiley & Sons Inc., New York.
Wilks, SS 1963, ‘Multivariate statistical outliers’, Sankhya:
The Indian Journal of Statistics, vol. 25, no. 4, pp. 407–
426.
Woodall, WH 2006, ‘The use of control charts in healthcare and public health surveillance’, Journal of Quality
Technology, vol. 38, no. 2, pp. 104–109.
15
Rubber Products Manufacturing Industry
In 2009, the Malaysian rubber products industry was made up of more than 348 manufacturers producing latex products, tyres and tyre-related products as well as industrial and general rubber products. The industry employed more than 56 476 workers and contributed RM10.59 billion to the country's export earnings. Rubber products accounted for 1.9% of Malaysia's total exports and 1.91% of Malaysia’s exports from the manufacturing sector (Malaysian Rubber Statistics 2009).
Manufacturing of latex products. The latex products sub-sector was the largest within the rubber products industry, comprising 125 manufacturers producing medical, household and industrial gloves; catheters, latex threads, balloons, finger stalls and foam products which contributed RM9.7 billion to the country's export earnings in 2009. This sub-sector accounted for 79% of the total value of rubber exports, largely contributed by gloves, catheters and latex threads. Malaysia continues to maintain its position as the world's leading producer and exporter of catheters, latex threads and natural rubber medical gloves, supplying more than 80% of the world market for catheters, 70% for latex threads and 60% for rubber gloves (Malaysian Rubber Statistic 2009).
Environmental Concern
Manufacturing of latex products poses a potential threat to the environment due to the use of certain toxic and non-biodegradable chemicals. Thus, indiscriminate discharge of latex product manufacturing effluent can cause water pollution, resulting in the deterioration of the normal living ecosystem of the rivers and streams. The practice of using chemical flocculants to remove the potentially toxic chemicals from the effluent in the form of sludge has become the norm in the latex products manufacturing factories, which in turn necessitate chemical sludge disposal. Figure 1 show the sludge generation in the ‘activated sludge’ effluent treatment system, which is commonly used to treat rubber glove manufacturing effluent. In view of its importance to the nation and mindful with the rapid expansion of this industry, it is essential for the latex products industry to avoid creating serious environmental problems and turn eco-friendly, to project a ‘green’ image as well as to reduce the cost of disposing of the sludge by incineration (Devaraj et al. 2006).
Regulatory Requirements
The Malaysian government gazetted the Environmental Quality Act in 1974 and Environmental Quality (Sewage
Sludge-derived Fuel from Latex Products
Manufacturing Industry
V. Devaraj1* and M.N. Zairossani1
Malaysia is the world’s top manufacturer of examination and surgical natural rubber (NR) gloves, exported mainly to the USA and Europe. The glove manufacturing process yields effluent which must be treated to comply with the stringent regulatory requirements imposed by the Malaysian Department of Environment. To make glove manufacturing an eco-friendly process, efforts are geared towards minimizing and utilizing waste or converting it into raw material for making value-added products. Waste generated from the glove industry is mainly rubber sludge which is obtained from the chemical flocculation stage of the effluent treatment process and consists of mainly rubber, remnants of compounding ingredients and water. R&D work by the Malaysian Rubber Board on waste utilization and resource recovery investigations have revealed many uses for this sludge. This paper briefly outlines only one of the many options available, which is the conversion of the sludge into sludge derived fuel (SDF). Preliminary study has identified three formulations of SDF with calorific values (CV) exceeding 16 000 kJ/kg, matching a good grade coal. This was considered as promising results which warrant explorative work for further increasing the CV of SDF to turn it into a viable fuel substitute in the latex products manufacturing industry and subsequently apply for a Clean Development Mechanism status to generate income.
Key words:Eco-friendly; wastewater; chemical flocculation; latex sludge; calorific value; fuel substitute; Clean Development Mechanism
ASM Sci. J., 6(1), 15–21
1Technology and Engineering Division, RRIM Research Station, Malaysian Rubber Board, 47000 Sungei Buloh, Selangor
*Corresponding author (e-mail: [email protected])
ASM Science Journal, Volume 6(1), 2012
16
and Industrial Effluents) Regulations in 1979 to inhibit indiscriminate discharge of effluents into watercourses. As specified in the Third Schedule of the Environmental (Sewage and Industrial Effluents) Regulations 1979, the effluent from rubber products manufacturing factories had to be treated to meet the effluent regulatory standards before it could be discharged into watercourses. There were two sets of standards applicable, Standard A for factories located upstream of water intake and Standard B for factories located downstream of water intake. In addition, rubber product manufacturing factories had to comply with the Environmental Quality (Scheduled Wastes) Regulations, 2005. These regulations set out the requirements for storage, collection, packaging, labelling, treatment and disposal of scheduled waste (Department of Environment Malaysian 2005, 2007; Devaraj et al. 2003). Sludge from Latex Products Manufacturing Industries
Malaysia is the world’s top producer of examination and surgical gloves. In 2009, the gloves produced in Malaysia reached a value of 23 133 million pairs (Malaysian Rubber Board 2009). It was estimated over 50 000 metric tons of sludge were generated in 2009 by the latex products manufacturing industry in Malaysia. The sludge generated during the manufacturing process of various latex products is shown in Table 1.
Chemical flocculation was part of the effluent treatment process whereby the metallic components of the effluent were flocculated with the addition of flocculating agents such as lime or polyelectrolytes. The constituents of the sludge are as shown in Table 2. Coagulated latex made up the bulk of the total organic carbon (TOC), the nitrogen was from the latex preservation system, phosphorus was
added in the form of phosphoric acid to adjust the pH during the effluent treatment process while the rest of the metallic components were from the latex formulation (dipping polymer). The metallic components such as lead, cadmium and nickel were found only in trace amounts. The bulk of the remaining component in the sludge was moisture content (Mohd Zin 1999; Nambiar et al. 2000). High Cost of Sludge Disposal
The government had granted Kualiti Alam Sdn Bhd exclusive rights to operate an integrated scheduled waste management system for Peninsula Malaysia. The facilities available at the site for the scheduled treatment and disposable of waste included secure landfill and incineration. The costs incurred depended on the TOC levels of the sludge, which varied between RM495 per ton for direct landfill and RM2790 per ton if incineration was required (Kualiti Alam Sdn. Bhd.). The cost of RM2790 per ton for disposal of the sludge by incineration was considered high. This was a financial burden for the latex products manufacturers, as it increased the operating cost in the midst of stiff competition from neighbouring countries to capture the latex dipped products market. Some factories had to close down, as the profit margin was too low to stay in business, while others had to move to neighbouring countries where the regulatory requirements were less stringent (Nambiar et al. 2000).
R&D Programme by Malaysian Rubber Board (MRB) on Sludge Utilization
The secured land filling option was not the permanent option proposed by MRB, the more sustainable option proposed was to find ways to turn the sludge into raw material for
Figure 1. Schematic diagram showing the sludge generation using the ‘activated sludge system’ designed to treat rubber glove effluent (Devaraj and Zairossani 2010).
V. Devaraj and M.N. Zairossani: Sludge-derived Fuel from Latex Products Manufacturing Industry
17
making other value added products. This was because the latex product manufacturing sludge contained valuable ingredients but they were not in the ideal composition for making other rubber-based products directly, thus requiring pre-treatment.
In the wake of environmental conservation, waste utilization and recycling become good options for factory owners to find new uses for their sludge. From a recent report on characterization of sludge and effluent from latex product manufacturing by MRB, a good number of factories produced sludge which had useful constituents for recycling and utilizing in non-latex rubber product manufacturing industries as for rubber mats, shoe soles and carpet underlay (Nambiar et al. 2000). In industries like brick making and cement manufacture, where a lot of filler materials were required, latex product sludge could become useful material and had a great chance of improving the quality of the products (Zaid 2003; Meriam 1998). High quality raw material was readily available in the form of latex product manufacturing sludge, which by systematic R&D work, could be converted into value added products, instead of being burnt as waste in the incinerators incurring high costs. The utilization of sludge could bring about an increase in revenue and a substantial reduction in the amount of sludge that had to be disposed, thus reducing the environmental impact caused by the latex products manufacturing industries. The technology developed could also be expanded to countries like Thailand and Indonesia for a lucrative income on a franchise basis, as latex product manufacturing was one of
the important activities over there (Nambiar et al. 2000; Garber & Anderson 1990).
In view of this, MRB had embarked in carrying out R&D work using sludge from latex products manufacturing industries as raw material since 2000, for making products like carpet underlay and bricks. MRB has since assisted a number of glove factories in using their sludge for making carpet underlay (Zaid 2003). The proportion of heavy metal content has been reduced to a save level (2 p.p.h.) by mixing with virgin rubber (latex) in the formulation (Zaid 2003).
Land application. MRB carried out a study on land application of the sludge in the late nineteen eighties (Mohd Zain 1998, 1999). The study showed that land application was a logical choice as it was found to be economical. Preliminary studies showed that by using sludge from examination glove factories as cultivation medium for the plant, vetiver spp. could support good growth comparable to that as grown on soil. Lead, copper, nickel and cadmium were not detected in the leachate from the sludge used as the cultivation medium (Mohd Zin 1998) while the zinc content of the leachate was less than 1 mg/l. However, certain guidelines needed to be developed, such as the effect of heavy metals on soil, underground water, micro-organisms and plants needed to be studied as indiscriminate application could cause soil contamination, phytoxicity, accumulation of undesirable high levels of trace elements in the soil and contamination of groundwater (Mohd Zin 1998, 1999).
Table 1. Amount of sludge generated by various latex productsa.
Type of product Sludge production
Examination glove 3 g – 250 g/1000 pieces
Household glove 175 g – 1300 g/1000 pieces
Latex thread 2 g – 3 g/kg latex thread
a
Mohd Zin 1998, 1999.
Table 2. Characteristics of sludge from latex products manufacturinga.
Glove Latex Thread Catheter Condoms
Parameter Range Mean Range Mean Range Mean Range Mean
(%) (%) (%) (%) (%) (%) (%) (%)
TOC 2.8 – 42.1 17.6 2.0 – 8.9 7.2 9.3 – 30.5 17.8 9.6 – 21.4 15.9
Biodegradable TOC 0 – 23.9 3.4 0 – 2.0 0.4 0 – 6.8 2.9 0.3 – 3.6 2.3
Nitrogen 0.5 – 3.6 1.3 0.3 – 1.9 1.2 0.6 – 4.3 1.9 1.0 – 2.1 1.5
Phosphorous 0.1 – 3.9 0.8 0.1 – 0.8 0.4 0.6 – 2.2 1.4 0.3 – 1.2 0.7
Potassium 0 – 0.7 0.1 0 – 0.1 0.1 0 – 0.6 0.3 0 – 0.1 0.1
Magnesium 0 – 4.7 0.7 0 – 2.8 0.8 0.1 – 3.0 1.1 0 – 0.1 0.1
Calcium 0 – 13.3 5.6 0 – 13.6 4.9 0.5 – 14.9 5.6 0.3 – 0.7 0.5
Zinc 0.3 – 8.1 2.2 12.2 – 44.3 27.8 0.3 – 3.8 2.2 0.7 – 1.1 0.9
a
Nambiar et al. 2000.
ASM Science Journal, Volume 6(1), 2012
18
Brick making. Latex products manufacturing sludge was used as one of the ingredients for brick making. The study was a collaborative project between MRB and University of Malaya. It showed that an ideal compressive strength, which is an important criterion for making a high quality brick could be easily attained. The brick made from rubber sludge regularly showed compressive strength values of between 6 MPa – 10 MPa, whereas common brick according to specification (Malaysian Standard 1972, Brick) ranged between 5 MPa – 6 MPa. The leaching of heavy metals was below regulatory requirements (using TCLP method and measured values included Zn, Cd, Cr and Mn). Incorporating solid waste in fired clay bricks had proved to encapsulate the hazardous substance successfully. Bricks which were made from latex product manufacturing sludge had improved aesthetical aspects (very smooth and shiny surfaces with minimum breakage at the corners) and sludge as filler material contributed to the reduction in weight of high-rise buildings. The Department of Environment (DOE) did not give a blanket approval for the utilization of sludge for making other products. Factory owners could get approval on a case by case basis upon request from DOE to process sludge into raw materials at their factory premises for making other products and subsequently to sell them to prospective buyers. The set back of the consumers acceptance was not very encouraging, as they were sceptical about using bricks for their building from sludge which might contain hazardous waste like Zn (Garber & Anderson 1990; Meriam & Aziz 1998).
Slow Uptake of Sludge Utilization Options
All the above R&D work carried out on the sludge utilization studies did not induce any commercial interest. Various factors contributed to the lukewarm interest shown by the industry for making products from latex products manufacturing sludge. This was because Malaysia is a resource rich country and products made from recycling or utilizing of waste did not command a competitive price. Furthermore, the DOE regulations are quite elaborate and stringent and to make products utilizing even a small percentage of schedule waste required extensive procedures to convince the authorities on their compliance to the regulatory requirements.
With the price of oil skyrocketing to well over USD100 per barrel during the peak period in mid-2008, turning latex product manufacturing sludge into a fuel source was one of the worthy options which was considered exploring (Devaraj 2001). Although a study was carried out by MRB in 2001 to convert latex product manufacturing sludge into refuse derived fuel (RDF), it was not continued further as there was no urgency in its utilization. This was prior to the formation of the Kyoto Protocol which was adopted in Kyoto, Japan, on 11 December 1997 and enforced from 16 February 2005
(United Nations 1997). The Clean Development Mechanism (CDM), defined in Article 12 of the ‘The Kyoto Protocol’, which allowed a country with an emission-reduction project to earn saleable certified emission reduction (CER) credits; each equivalent to one tonne of CO2, which could be counted towards meeting Kyoto targets, was very much unknown then. The global warming concern had not reached an alarming stage and most importantly the price of oil was still reasonably priced during that period (United Nations 1997).
Sludge-derived Fuel (RDF) as a Form of Refuse Derived Fuel
RDF is a popular method of turning municipal solid waste (MSW) into a fuel source in EU countries and Japan. RDF is classified as an innovation of waste-to-energy technology created by shredding and drying out MSW material. The raw material mostly used for conversion is the combustible fraction of waste which usually consists of plastics and biodegradable matter. RDF facilities are usually located near landfills and dumpsites for efficiency of access and acquisition of waste materials and less transportation cost. Sludge-derived fuel (SDF) is a sub-sector of RDF where the sludge is mainly organic in nature, originating from effluent treatment plants, organic sediments from food processing plants, biological flocculates as well as biological waste (coagulated natural rubber latex) mixed with chemicals (flocculating agents) from latex products manufacturing effluent treatment plants (Hasselriis 1989; Demirbas et al. 2011; Chang et al. 1998; Marsh et al. 2007; Chen et al. 2011).
The main purpose of the study was to research and develop a suitable recycling method for turning the latex product manufacturing sludge into a sludge-derived fuel that would not pollute the environment and at the same time further increase the added value from the recycling of the sludge. The process in turn would be able to produce an effective fuel substitute and be able to reduce the cost of disposing of the sludge by incineration.
Therefore this paper describes preliminary R&D work carried out to study the feasibility of turning latex product manufacturing sludge into SDF and subsequently apply for CDM status.
MATERIAL METHOD
Preparation of Sludge Derived Fuel
Sludge samples with a moisture content of 30%–40% were collected from commercial glove factories after having undergone dewatering process through a filter press. They were then characterized to determine the composition of their content. Different batches of SDF samples
V. Devaraj and M.N. Zairossani: Sludge-derived Fuel from Latex Products Manufacturing Industry
19
were prepared using varying proportions of latex glove manufacturing sludge, latex coagulum (sediment from latex dipping tanks), carbonaceous material (rubber vulcanizate after undergoing size reduction) and were bound by waste latex. These mixtures were homogenised by mixing and masticating in a mortar with the addition of a small amount of water. The samples were then pressed into a mould of, 3 cm – 4 cm in diameter which was slowly inverted to remove the mould. The compressed SDF samples removed from the mould were as shown in Figure 2 (a) and (b). The SDF samples, fresh from the mould and having a moisture content of 30%–40% were dried in an oven which was set at a constant temperature of 80ºC. The drying was continued until a constant weight was attained. They were then cooled in desiccators and were sent for calorific value analysis (Devaraj et al. 2009; Devaraj & Zairossani 2010).
Determination of Calorific Value of SDF Samples
Calorific values (CV) of the RDF samples were determined experimentally by using a bomb calorimeter. Bomb calorimeters give a CV which is called gross or high heating value (Kathiravale et al. 2003).
The calorific value of a fuel is the quantity of heat produced by its combustion — at constant pressure and under 'normal' conditions (i.e. 0ºC at a pressure of 1013 mbar). The combustion process generates water vapour and certain techniques may be used to recover the quantity of heat contained in this water vapour by condensing it. The higher calorific value [or gross calorific value (GCV)] is based on the supposition that the water of combustion is entirely condensed and that the heat contained in the water vapour is recovered. The lower calorific value [or net calorific value (NCV)] supposes that the products of combustion contain the water vapour and that the heat in the water vapour is not
recovered (Kathiravale et al. 2003; Sheng & Azevedo 2005; Demirbas 1997; Dennis et al. 2004).
RESULTS AND DISCUSSION
Table 3 shows the calorific values of the 14 samples of SDF analysed. These were the average values of three replicates made from each of the RDF formulations (Devaraj et al. 2009; Devaraj & Zairossani 2010).
It was apparent that out of the 14 formulations of the SDF sample (formulations A to N), the CV of formulations A, G and I were outstanding with values of 16 702 kJ/kg, 16 765 kJ/kg and 16 411 kJ/kg, respectively. These samples of formulations contained sludge with small amounts of vulcanizate (4%–5%) and waste latex as the binding agent (2%–3%). The vulcanizate samples were added to increase the carbon content thus increasing the CV. Only a minimal amount was added so as to prevent the excessive release of SOx gas during combustion from the sulphur used as the
cross-linking agent found in the vulcanizate. The waste latex used as the binder was pre-vulcanized latex (PVL) which also contained sulphur in its formulation. This component too was added at a minimal amount in SDF formulations.
The three highest CV values of the RDF formulation, which exceeded 16 000 kJ/kg, matched CV values of bituminous coal, normal coal and lignite (Table 4). SDF made from latex products manufacturing sludge had good potential to be turned into fuel substitute, since the CV values obtained matched that of high grade coal. With improved formulations, such as by adding on other rubber wastes (vulcanized off-specification rejects and powdered rejected gloves) in optimum proportions, the CV values of the SDF could be further improved. The complete
(a) (b)
Figure 2. SDF Samples made from latex products manufacturing sludge with a diameter of 3.5 cm.