IS THE CONTACT TIME BETWEEN PATIENT AND HEALTH CARE PERSONNEL
IN MINISTRY OF HEALTH HOSPITALS MALAYSIA APPROPRIATE?
Roslinah A1, Azman AB1, Roslan Johari MG2 , Noriah B2, Rohani I2, Faisal S3
1Institute for Health Systems Research 2Institute for Health Management 3Hospital Kuala Lumpur
ABSTRACT
Contact time was defined as the time spent by health personnel with a patient. The study was conducted for four months in 2007 to assess the contact time and to determine the appropriate contact time as perceived by patients attending clinics of various clinical disciplines as well as Out-Patient Departments and Emergency Departments at Ministry of Health Hospitals. This study was a cross-sectional study carried out on out-patients who came to the hospitals’ clinics for treatment. Information was gathered through self-administered questionnaires, distributed at twenty-one hospitals. The respondents were selected using stratified random sampling method. Out of 21,750 questionnaires distributed, 13,463 patients responded, a response rate of 61.9%. This study shows that the average contact time increases from small hospitals (8 minutes) to bigger hospitals (15 minutes). The contact time also varies between the clinics of various disciplines. Obstetrics and Gynecology (O&G) clinics and Pediatric clinics had the longest average contact time of 20 minutes and 15 minutes respectively. The percentage of patients who were satisfied with the contact time corresponded with the type of clinics and hospitals which had the longest contact time. Thus, it is suggested that clinics and hospitals, whenever possible try their best to follow the duration of contact time as perceived appropriate by the patients.
Key words: Contact time, patient satisfaction, health care personnel, health care facilities
INTRODUCTION
Contact time defined as the time spent by health personnel with a patient. Contact time is sometimes used interchangeably with consultation time and is actually the time spent to get advice or treatment1. Short contact time
with health care personnel is the common source of patient dissatisfaction with consultation2.
Increased contact time is sometimes but not always associated with increased patient satisfaction3,4. However; different people have
different perceptions, even of the same stimuli.
According to Steers and Black5, perception is
usually guided by beliefs, where norms and values predominate. Hopkins6 mentions that an
individual’s values may change over time. What is perceived now as appropriate will not necessarily to be so in the future?
Studies have shown that the physician-patient relationship influenced patient satisfaction7,8, 9,10.Physician-patient relationships were
consistently viewed as the most important factors, by patients evaluating their general practitioner (GP) services8. Therefore, the length
of time spent between patients and healthcare personnel did not determine the level of
satisfaction as much as how the contact time was utilized11.
The purpose of this study was to assess the contact time and to determine the appropriate length of contact time with health care personnel as perceived by patients. In this study contact time with healthcare personnel is defined as the time spent by healthcare personnel with the patients. Healthcare personnel here include staff nurses, medical assistants and doctors.
METHODOLOGY
This study was a cross-sectional study conducted in twenty-one hospitals between August and November, 2006. The hospitals were selected using stratified random sampling method and were divided into 4 categories:
I. Hospital Kuala Lumpur (HKL) as the National Referral Hospital.
II. State Hospitals.
III. District Hospitals with specialists and IV. District Hospitals without specialists.
The respondents were selected through systematic selection based on patient’s registration. They were out-patients who came to the hospitals’ clinics (Out-patient Department, Accident and Emergency Department, Medical Clinics, Surgical Clinics, O&G Clinics, Pediatric Clinics and Orthopedic Clinics) for treatment. The sample size calculated by EPI INFO was 200 for each clinic, and 10% non-response rate was considered and included in the total sample size.
A set of self-administered questionnaire was developed by the research group and pre-tested. The pre-testing was done to test whether the questionnaire can be easily understood and simple enough for the patient to complete.
The questionnaires consisted of sections on demographic profile of the respondents and contact time with healthcare personnel who can either be a doctor, a medical assistant or a nurse. Children under 12 years who came to the clinics accompanied by an adult were included and the adult was asked to complete the questionnaire. The respondents were requested to write down the time when they entered and leave the consultation room. Then they were asked to write whether they felt satisfied or not with the contact time, and also whether the time spent with the healthcare personnel was appropriate. The completed questionnaires were inserted into special boxes, labeled and located at various locations before the patients left the hospital/clinics.
Prior to the actual implementation of the study, a research coordinator from each hospital was identified and they were given one-day training. The tasks of the coordinator were to distribute, collect and compile the completed questionnaires and sent them back to the Institute for Health Management for data entry process.
The data were analyzed descriptively. Results were tabulated, cross tabulated and analyzed statistically. Statistical Package for Social Sciences (SPSS) version 12.0 for Windows was used to analyze the data using chi-square test (χ2). The mean (SD) or median (IQR) value was
taken to determine respondent’s perception on appropriateness or inappropriateness of the contact time.
RESULTS
Response Rate
Twenty one thousand seven hundred fifty (21,750) questionnaires were distributed at 21 hospitals and 13, 463 patients responded with an overall response rate of 61.9%.
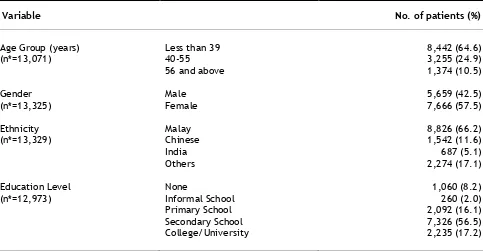
Demographic characteristics
Table 1. Demographic characteristics
Variable No. of patients (%)
Age Group (years) Less than 39 8,442 (64.6)
(n*=13,071) 40-55 3,255 (24.9)
56 and above 1,374 (10.5)
Gender Male 5,659 (42.5)
(n*=13,325) Female 7,666 (57.5)
Ethnicity Malay 8,826 (66.2)
(n*=13,329) Chinese 1,542 (11.6)
India 687 (5.1)
Others 2,274 (17.1)
Education Level None 1,060 (8.2)
(n*=12,973) Informal School 260 (2.0)
Primary School 2,092 (16.1)
Secondary School 7,326 (56.5) College/University 2,235 (17.2)
*n differ because of missing values
Average contact time
The nature of the distribution (skewed with large outliers) suggested that the median was a better measure of central tendency than the mean.
The median length of contact time increased from small hospitals to big hospitals as shown in Table 2.
Table 2. Average contact time (minutes) by hospitals
Hospital Median (IQR) (minute)
Kuala Lumpur Hospital 15.00 (15)
State Hospital 15.00 (15)
District Hospitals with Specialists 13.00 (13)
District Hospitals without Specialists 8.00 (8)
Table 3 shows that more than eighty-five percent of the respondents from each types of hospital were satisfied with the contact time and the
Table 3. Number of patients who were satisfied with the contact time according to type of hospitals
Satisfaction
Hospital N (%)Yes N(%)No Total N (%)
Kuala Lumpur Hospital (HKL) 541 (88.0) 74 (12.0) 615 (100)
State Hospital 2594 (89.5) 305 (10.5) 2899 (100)
District Hospital With Specialist 3353 (87.1) 497 (12.9) 3850 (100)
District Hospital Without Specialist 902 (87.6) 128 (12.4) 1030 (100)
P=0.027
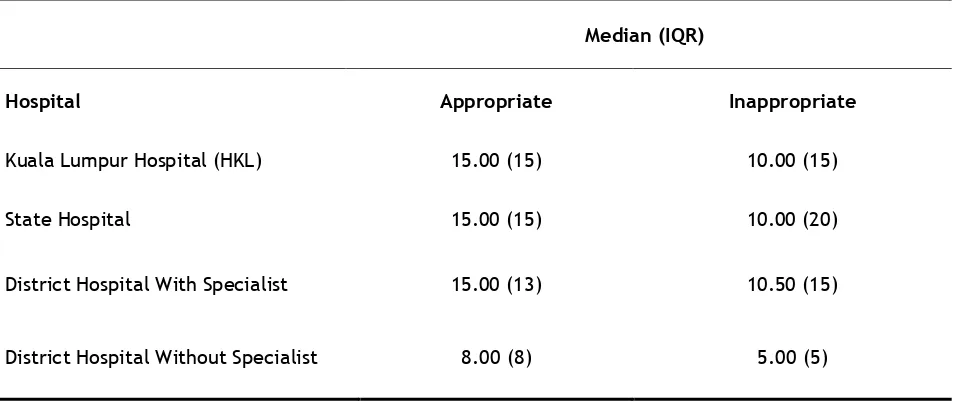
Table 4 clearly shows that fifteen minutes of contact time were perceived as appropriate and 10 minutes contact time were perceived as
inappropriate by patients in all hospitals except for District Hospitals without specialist (Table 4).
Table 4. Average contact time (minutes) perceived appropriate by patients according to types of hospital
Median (IQR)
Hospital Appropriate Inappropriate
Kuala Lumpur Hospital (HKL) 15.00 (15) 10.00 (15)
State Hospital 15.00 (15) 10.00 (20)
District Hospital With Specialist 15.00 (13) 10.50 (15)
District Hospital Without Specialist 8.00 (8) 5.00 (5)
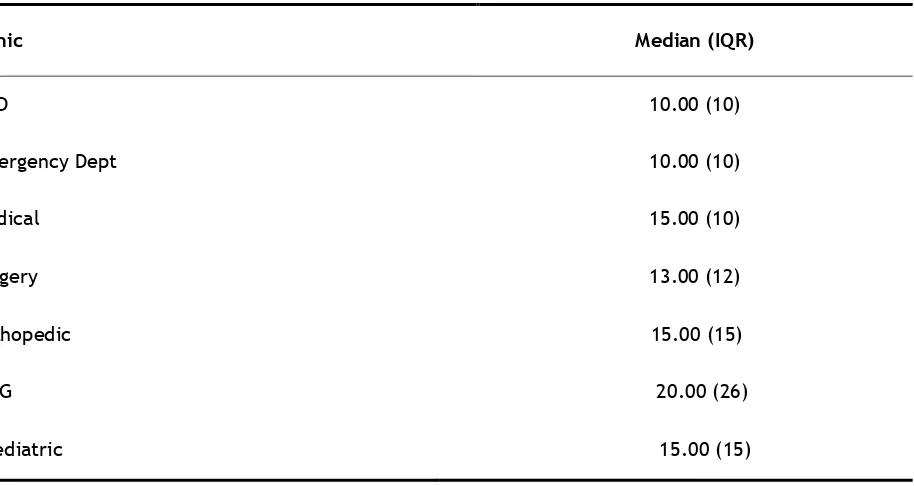
Table 5 shows that average contact time with health care personnel was longest at O&G clinics (20 minutes) and only 10 minutes at Emergency
Table 5. Average contact time (minutes) according to types of clinic
Clinic Median (IQR)
OPD 10.00 (10)
Emergency Dept 10.00 (10)
Medical 15.00 (10)
Surgery 13.00 (12)
Orthopedic 15.00 (15)
O&G 20.00 (26)
Paediatric 15.00 (15)
The percentage of patients who were satisfied with the contact time according to age groups was not statistically significant (Table 6).
Table 6. Number of patients who are satisfied with contact time by age-group
Satisfaction
Age-group(years) N (%)Yes N (%)No Total N (%) Χ2 P value
≤ 39 4,762 (88.7) 606 (11.3) 5,368 (100) 5.12 0.08
40 - 55 1,774 (87.0) 266 (13.0) 2,040 (100)
≥ 56 706 (87.2) 104 (12.8) 810 (100)
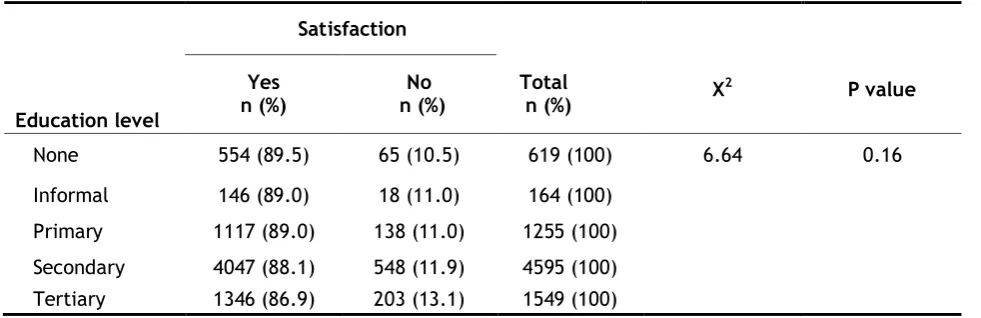
The percentage of patients dissatisfied with the contact time was highest among those with tertiary and secondary level of education, 13.1%
Table 7. Number of patients who were satisfied with contact time by education level
Satisfaction
Education level
Yes
n (%) n (%)No Total n (%) Χ
2 P value
None 554 (89.5) 65 (10.5) 619 (100) 6.64 0.16
Informal 146 (89.0) 18 (11.0) 164 (100) Primary 1117 (89.0) 138 (11.0) 1255 (100) Secondary 4047 (88.1) 548 (11.9) 4595 (100) Tertiary 1346 (86.9) 203 (13.1) 1549 (100)
Table 8. Shows that there was not much difference in the percentage of satisfaction
between male and female patients who were satisfied or unsatisfied with the contact time.
Table 8. Number of patients who were satisfied with contact time by gender
Satisfaction
Gender N (%)Yes N(%)No N (%)Total Χ2 P value
Male 3074 (88.0) 418 (12.0) 3492 (100) 0.06 0.81 Female 4271 (88.2) 571 (11.8) 4842 (100)
Indians were most dissatisfied (15.2%) with the contact time followed by the Chinese (14.2%)
and the Malays (11.5%). The differences are statistically significant (Table 9).
Table 9. Number of patients who were satisfied with contact time by ethnic group
Satisfaction
Ethnic group N (%)Yes N(%)No Total N (%) Χ2 P value
Malay 4972 (88.5) 649 (11.5) 5621 (100) 10.3 0.02 Chinese 757 (85.8) 125 (14.2) 88.2 (100)
Indian 356 (84.8) 64 (15.2) 420 (100) Others 1248 (88.9) 156 (11.1) 1404 (100)
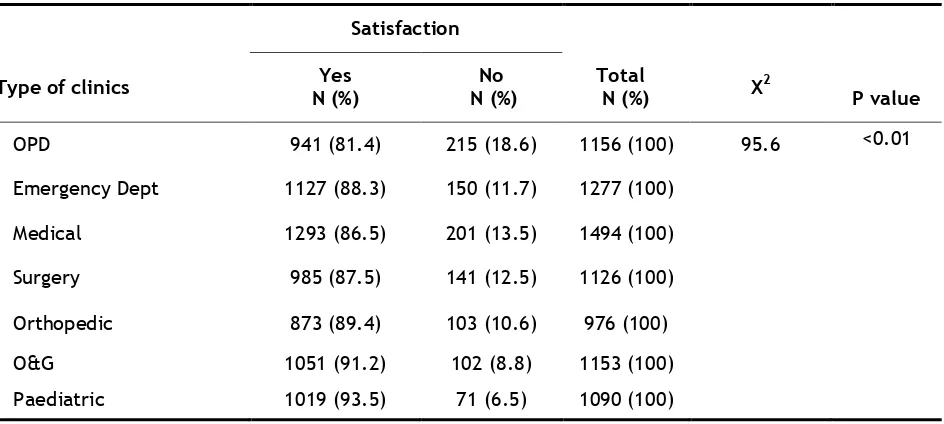
Patients attending the OPD, Medical Clinic and Surgical Clinic were more dissatisfied with the contact time than those attending other type of
Table 10. Number of patients who were satisfied with contact time by type of clinics
Satisfaction
Type of clinics N (%)Yes N (%)No Total N (%) Χ2
P value
OPD 941 (81.4) 215 (18.6) 1156 (100) 95.6 <0.01
Emergency Dept 1127 (88.3) 150 (11.7) 1277 (100)
Medical 1293 (86.5) 201 (13.5) 1494 (100)
Surgery 985 (87.5) 141 (12.5) 1126 (100)
Orthopedic 873 (89.4) 103 (10.6) 976 (100)
O&G 1051 (91.2) 102 (8.8) 1153 (100) Paediatric 1019 (93.5) 71 (6.5) 1090 (100)
Table 11 shows that hospitals with specialist had the highest percentage of patients who were dissatisfied (12.9%) with the contact time
followed by district hospitals without specialist (12.4%)
Table 11. Number of patients who were satisfied with contact time by type of hospitals
Satisfaction
Type of hospitals N (%)Yes N(%)No Total N (%) Χ2 P value
Kuala Lumpur Hospital 541 (88.0) 74 (12.0) 615 (100) 9.21 0.03
State Hospitals 2594 (89.5) 305 (10.5) 2899 (100) District Hospitals with specialist 3353 (87.1) 497 (12.9) 3850 (100) District Hospitals without specialist 902 (876) 128 (12.4) 1030 (100)
DISCUSSION
This study is the first of its kind where patients did the timing themselves. Earlier studies on waiting time, the timing and documentation of the time at various contact points were done by clinic and/ or hospital staff12.
The findings of this study show that the average contact time increased from small hospitals (8.00 minutes) to bigger hospitals (15 minutes). This might be due to the fact that in smaller hospitals, the cases seen are usually less complicated than that in bigger or tertiary hospitals. Therefore, the time spent between the patients and the healthcare personnel is not long as compared to patients with more complicated diseases.
The study also shows that the average contact time increases with types of clinic. The longest (20 minutes) being at O&G clinics and the shortest, 10 minutes at Accident and Emergency Departments and OPD respectively. These findings were also reflected by the nature of cases seen at the particular clinics. At the O&G clinics, more time is needed to physically examine the pregnant woman, assess her pregnancy status including using more investigations such as ultrasound and review of their results. At the Accident and Emergency Department, the cases seen are usually acute cases that need urgent and quick attention. Those serious cases were then admitted to the wards.
However, more time is needed for high quality consultations with patients of major and complex illnesses13. Studies have shown that longer
contact time have been significantly associated with better recognition and handling of psychological problems4 and patient
enablement14.They are also linked to better
care, fewer drugs being prescribed, identified more patients with chronic diseases, deal more frequently with psychological problems and promote healthier lifestyle15.
In this study, 88.0% of patients who responded were satisfied with the contact time with health care personnel. The high percentage of patients who were satisfied with the contact time corresponds to those hospitals and clinics with longest contact time. Previous research had shown a correlation between length of contact time and patients’ overall satisfaction with their visits4,16. The percentage of patients who were
satisfied with the contact time decreased with increase level of education but it was not statistically significant. There was not much difference between male and female patients in term of satisfaction on the contact time but a study conducted among general practitioners in UK reported that male patients were more difficult to satisfy than female patients as they usually had higher expectation.3 It may also
because male patients are more critical of these aspects of service. However, a number of studies have found substantial associations between patient satisfaction and socio-demographic statistics such as age, social class and race but the results are inconsistent and sometimes contradictory17, 18, 19.
In our study, patients’ satisfaction on the contact time was found to be statistically significant difference when analyzed by type of clinics and type of hospitals. The characteristics concerned are similar to those that influenced satisfaction with the practice in general and that involved the provision of a personal service20. Patients
attending the outpatient department and medical clinics were more dissatisfied with the contact time and this could probably be explained by the fact that the waiting time at these particular clinics were long and they expect to spend more time during consultation after a long wait. The highest proportion of dissatisfaction among patients attending district hospitals with specialist as compared to other type of hospital may be due to the relatively inexperienced specialists3.
Our study has not investigated the healthcare personnel characteristics in determining patient satisfaction. Two studies have suggested that patients’ perceptions of doctor’s age, the relationship with their doctors and the doctors’ level of competencies, are relatively complex3, 20
However, doctor’s gender did not explain differences in levels of satisfaction.
CONCLUSION
In conclusion, this study provides important information regarding the appropriate contact time. The appropriate contact time perceived by the respondents varies with category of hospitals and the types of clinic. The more complicated or complex diseases require a longer contact time. It is recommended that clinics and hospitals should try to provide the contact time perceived as appropriate to the patients. Perhaps, this will help to satisfy the patients and thus fewer complaints made.
ACKNOWLEDGMENT
The authors thanked the Director General of Health Malaysia and Deputy Director of Health (Research and Technical Support) for giving permission to publish this paper. We would also like to thank participating hospitals, hospital coordinators and data collectors for their support during the conduct of the study and are grateful to all patients who had volunteered to participate and Dr. S. Shalini for proof reading the manuscript.
REFERENCES
1. Hornby AS. Oxford advanced learner’s dictionary of current English. Oxford: University Express, 2000.
2. Cape J. Consultation length, patient estimated consultation length, and satisfaction with the consultation. Br J Gen Pract 2002; 52: 1004-1006.
3. Baker R. Characteristics of practices, general practitioners and patients related to levels
of patients’ satisfaction with consultations.
Br J Gen Pract 1996; 46: 601-606.
4. Howie JGR, Porter AMD, Heany DJ, Hopton JL. Long-to-short consultation ratio: a proxy measure of the quality of care for general practice. Br J Gen Pract 1991; 41: 48-54.
5. Steers RM, Black JS. Organisational Behavior. New York: Harper Collins, 1994.
6. Hopkins A. Measures of the quality of life and uses to which such measures may be put, pp. 40-41. RCP Publication: London, 1992.
effects of physician-patient interactions on the outcomes of chronic disease. Medical
Care 1989; 27(3) (Supplement): 110-126.
8. Calnan M, Katsouyiannopoulos V, Ovcharov VK, Prokhorskas P, Ramic H, Williams S. Major determinants of consumer satisfaction with primary care in different health systems. Fam Pract 1994; 11(4): 468-478.
9. Savage R, Armstrong D. Effect of a general practitioner’s consulting style on patients’ satisfaction: a controlled study. BMJ 1990;
301: 968-970.
10. Bartlett EE, Grayson M, Barker R, Levine DM, Golden A, Libber S. The effects of physician communications skills on patient satisfaction; recall and adherence. J Chron Dis 1984; 37: 955-964.
11. Balint M. The doctor, his patient and the illness. London: Pitman Medical, 1964.
12. Johari RMG, Teng SC, Azman AB, Noriah B, Nadhirah R. Is the waiting time appropriate at the outpatient department in the Ministry of Health hospitals? Journal of Health Management. 2007; 3(1):6-14.
13. Freeman G K, Horder J P, Howie J GR, Hungin A P, Hill A P, Shah N C, Wilson A. Evolving general practice consultation in Britain: issues of length and context. BMJ
2002; 324: 880-882.
14. Howie JGR, Heaney DJ, Maxwell M, Walker JJ, Freeman GK, Rai H. Quality at general practice consultations: a cross-sectional survey. BMJ 1990; 319: 738-743.
15. Pollack K, Grime J. GP’s perspective on managing time in consultation with patients suffering from depression. A qualitative study. Family Practice 2003; 20: 262-269.
16. Morrel DC, Evans ME, Morris RW, Roland MO. The five minute consultation: effect of time constraint on clinical content and patient satisfaction. BMJ 1986; 292: 870 - 875.
17. Breemhaar B, Visser AP, Kleijnen JG. Perceptions and behavior among elderly hospital patients: description and explanation of age differences in satisfaction, knowledge, emotions and behavior. Soc Sci Med 1990; 31(12): 1377-
1385.
18. Andersson SO, Mattsson B. Length of consultations in general practices in Sweden: views of doctors and patients. Family Practice 1989; 6(2): 130-134.
19. Young GJ, Meterko M, Desai KR. Patient satisfaction with Hospital care: effects of demographic and Institutional Characteristics. Medical Care 2000; 38(3): 325-334.
20. Baker R, Stratified J. What type of general practice does a patient prefer? Exploration of practice characteristics influencing patient’s satisfaction. Br J Gen Pract 1995;