R E S E A R C H
Open Access
Multi-dimensional key generation of
ICMetrics for cloud computing
Bin Ye
1*, Gareth Howells
1, Mustafa Haciosman
1and Frank Wang
2Abstract
Despite the rapid expansion and uptake of cloud based services, lack of trust in the provenance of such services represents a significant inhibiting factor in the further expansion of such service. This paper explores an approach to assure trust and provenance in cloud based services via the generation of digital signatures using properties or features derived from their own construction and software behaviour. The resulting system removes the need for a server to store a private key in a typical Public/Private-Key Infrastructure for data sources. Rather, keys are generated at run-time by features obtained as service execution proceeds. In this paper we investigate several potential software features for suitability during the employment of a cloud service identification system. The generation of stable and unique digital identity from features in Cloud computing is challenging because of the unstable operation environments that implies the features employed are likely to vary under normal operating conditions. To address this, we introduce a multi-dimensional key generation technology which maps from multi-dimensional feature space directly to a key space. Subsequently, a smooth entropy algorithm is developed to evaluate the entropy of key space.
Keywords:Cryptography, Cloud computing, Security, Key generation, ICMetrics, Multi-dimensional space
Introduction
Along with the popularity of Cloud computing, the ma-jority of mediumto small sizedcompanies start to deploy their servers on the third party Cloud computing service providers in order to reduce the costs. However, due to the low boundary of technologies of setting up on Cloud servers, many malware or phishing sites can manipulate server using such vulnerabilities. For this reason, to the research topic of quickly identifying such web servers and protecting the customers’ private data is becoming an important research area. This paper introduces a technique termed ICMetrics that could be used to pro-tect services located in a Cloud server, a digital signature could be generated using properties or features derived from the server’s own construction and behaviour [9]. The ICMetrics is capable of assuring both their authenti-city and freedom from malware, which means that it simultaneously allows the flexibility of the system to be operated within their designed specification and execu-tionon an arbitrary platform. Generally, there are several
major advantages to use the ICMetrics:. Firstly, there is no need to store encryption keys or device characteristic tem-plates, because a digital signature is only regenerated when required. For this reason, there is no physical rec-ord of the key, which means that it is not possible to compromise the security of sensitive data through the unauthorised access to the keys. Furthermore, if a sys-tem is compromised, that would not disclose the sensi-tive template data or keys. As a result of that, it would not allow the unauthorised access to other systems pro-tected by the same ICMetrics or indeed any system protected by any other ICMetrics templates present. In addition, another advantage of using the ICMetrics is that a faulty or maliciously tampered device would be autonomously prevented from decrypting its own data or participating in any initiated secure communications. This is because tampering with the constitution of soft-ware would cause its behaviour to be changed, and this would potentially cause the generated ICMetrics fea-tures to be changed sequentially. As a result of that, any regenerated keys would differ from the original ones that were generated before the software’s integrity was compromised.
* Correspondence:[email protected] 1
The School of Engineering and Digital Arts, The University of Kent, Jennison Building - Room 1.46, Canterbury CT2 7NTKent, UK
Full list of author information is available at the end of the article
Currently, there are two research directions involved in the ICMetrics. Firstly, what kind of software behaviours can be used to identify servers in Cloud environment? In order to address this question, our previous works were investigated this problem in [15], [18] and [1], we used memory usage and PC counter as features to identify devices. Such hardware features are unique and stable that could be used for the ICMetrics technology. However, Cloud computing environments are completely different from traditional server providers. In Cloud computing Cluster, a number of computers are managed by software which dynamically distributes workload to all of the com-puters. As a result of that, there is a difficulty to obtain the locations where a program will be executed in the clusters. Therefore, only software features could be used in such scenarios. In this paper, we particularly investigate funda-mental principles of feature selection within Cloud comput-ing environment and analyse the methodology of adoptcomput-ing features for stable key generation process.
The goal of this paper is to evaluate the feasibility of generating encryption key based on features derived from the properties and behaviour of Cloud servers’. In order to achieve this, we first investigate appropriate methodologies of extracting features from Cloud servers and explore potential features that are suitable for key generation. Then, we invented and evaluated a new multi-dimensional encryption key generation algorithm after evaluated several possible existing encryption key generation algorithm. Finally, we developed a smooth entropy calculation algorithm which is used to calculate actual uncertainty of our encryption key.
Related works
This section shows an overview of the previous work of software security and Biometrics encryption key gener-ation. As previously discussed,, Security on Cloud servers are increasingly of concern to users. There are two issues that users need to guarantee when they con-nect to Cloud servers: they should be able to detect the cloud server is not a fraud or spoof and the server is not com-promised. To satisfy those two criterions, [8] proposed a malware detection system of AV software by matching automatically generated behaviour’s models against the runtime behaviour of unknown programs. Also, Rahmatian et al. [12] used a CFG to detect intrusion for secured embedded system by detecting behavioural differences between the target system and malware. In their system, each executing process is associated with a finite state machine (FSM) that recognizes the sequences of system calls generated by the correct program. Attacks will be detected if the system call sequence deviates from the known sequence. Wang et al. [11] proposed a system call dependency graph birthmark software theft detection
system. Software birthmarks have been defined as unique characteristics that a program possesses and can be used to identify the program without the need for source code, a dynamic analysis tool is used in [19] to generate system call trace and SCDGS to detect software component theft.
For the proposed system, the intended solution should not store a private key in a typical Public-Key Infrastruc-ture for data authenticating. Instead, it should generate a private key at run-time using features extracted from servers dynamically. The keys are generated from these features (soft behaviours data) using feature maps gener-ated from them. It is intended for the system to always generate the same public-private key pair for a service’s operation, regardless of input parameters. Previous work in biometric-based or ICMetrics-based system has already investigated the similar non-template key generation tech-nologies. For instance, [4] proposed a multi-dimensional key generation strategy on hand written features. In this paper, they firstly collect the biometric features of the au-thentic users as the training data, a user-dependent feature transform is derived such that the transformed features are distinguishable from those of imposters. Secondly, a stable key generation mechanism is utilized to generate a stable cryptographic key. The key is generated by cascad-ing every bit pattern of each feature. Also, [13] described a different key composing strategy where each biometric feature is conceptually contributed to one bit of the cryptographic key. Similarly, Jermyn [7] proposed a hand-drawn sketch to generate passwords according to the pos-ition and timing of the sketch drawing. However, these technologies all rely on feature transformations which transform features from original state to a form which can be distinguished from other data, subsequently generating cryptographic keys based on the transformation of the fea-tures. Since in Cloud computing environment, features are very easy to overlap and highly changeable. So, in order to make the ICMetrics system feasible in the Cloud environment, we need to incorporate as many features as possible. For this reason, we propose a multi-dimensional key generation scheme that would generate a key from multi-dimensional space directly. All features come from the same destination are man-aged to an entire multi-dimensional space, mapped to a key vector and then form a digital signature. Finally, a Shamir secret sharing scheme [3] and Reed-Solomon code [10] are used to improve the robustness and the performance of the system.
Criteria
generates the server independent derived keys. In our scenario, the keys are generated from the features gath-ered in the server and the operating system. For this reason, any changes of either the server itself or the op-erating system should affect the derived keys. For in-stance, if anybody tries to access the system or system is infected by virus will definitely change system behav-iour’s data. All those operations would change the ser-ver behaviour or system behaviour during the key generation. However, in some cases, the server may up-grade to a new version, as a result of this, it may lead system to perform a key updating process as well to re-train the key generation algorithm. But, any changes of the server and system environment should not affect the derived keys. In other words, the derived key should have a property with low intra-sample variance (i.e. the values produced for the same device) but high inter-sample variance (i.e. the values produced for the differ-ent devices) with an ideal case being no inter-sample overlap of potential features.
As mentioned previously, our security goals are to re-sist the cryptanalysis carried out by the attacker who wants to access server system. This case assures that any attacker accesses the system will tamper the system key generation algorithm. In order to do that, they need to alter the original program or run the malicious codes, which will certainly change the original threads sequence, and consume memory or alter the CPU usage. As a result of that, the feature extraction process during key generation will be affected. In addition, if any attackers who capture the server and wish to per-form a brute force attack, we have explored an entropy extraction strategy that extracts actual uncertainty of the derived key and make sure it is greater than 280.
Feature extraction
In order to collect data, we have setup 9 different Cloud servers and simulated customer usage remotely.
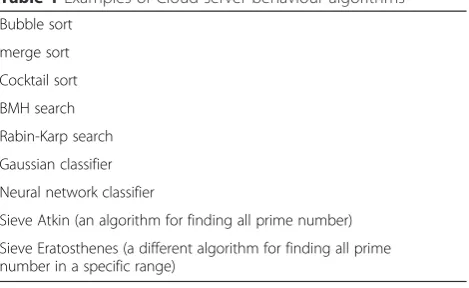
Each Cloud server runs an algorithm from Table 1. We also categorise the servers in to 4 groups. The first group are three different sorting algorithms. The reason is that firstly, the time complex of bubble sort is O (N2), merge sort is O (N logn) and cocktail sort is O (N logn). We analyse the correlation and causality of features between those servers. In this paper, we are focusing on the encryption key generation algorithm, so we do not describe too much about the feature analysis. BMH search and Rabin-Karp search are two different search algo-rithms, which is designed to find a key word through the same text. Gaussian classifier and Neural network classi-fier are deployed to train with the same dataset and our algorithms are used to detect the difference between the features. Sieve Atkin and Sieve Eratosthenes are two different implementations for finding all prime numbers
in a range. They are deployed to execute the same work but using different methods, which is used to evaluate whether the features are able to distinguish between each other. As a result, we can test whether inter sample vari-ance is strong enough to distinguish between them.
Under normal circumstances of infrastructure as a service (IAAS), our Cloud servers are deployed on a virtual machine with a Linux relative system. So, two approaches have been identified that will allow features to be extracted at run-time from the Cloud servers. In this paper, they have been termed“black box” and“white box”. A Cloud computer cluster is setup by Eucalyptus [14] and Xen [2]. Then, nine virtual machines are setup and each of them is installed on an Ubuntu Server 14.04.2 LTS. A traditional LAMP (Linux Apache, MySQL, PHP) web server is setup in each virtual operating system. The features are collected by a statistic module every 2 s from both black box and white box. This means that both black box and white box are monitoring the events which have been registered by our system.
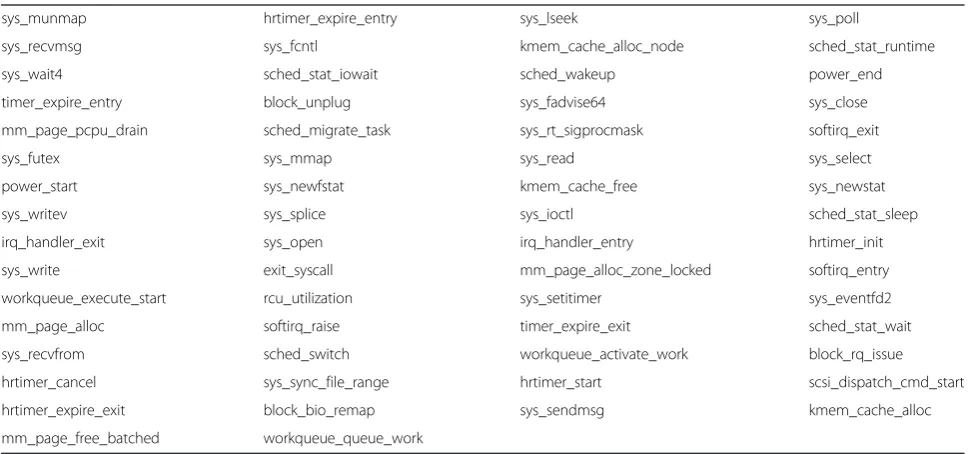
In“black box”, the extractor does not have any know-ledge regarding the internal working of the Cloud servers. Hence, the performance of the system can only be ascertained by observing the results by probing the exposed interfaces which include the globe system per-formance and the external resources. To achieve that, we adopt LTTng [5] to trace Linux kernel function. LTTng is a highly efficient tracing tool for Linux. Its tracers help tracking down performance issues and de-bugging problems involving multiple concurrent pro-cesses and threads. Linux kernel functions are interfaces between hardware and software, so we can investigate many indirect potential features. For instance, through a “kmalloc()” function, we could estimate memory usage of the Cloud services at a system level overview. Also, the correlation between features are investigated and used as new features. In general, we only extract Linux kernel invocation frequencies from black box now. Table 2 shows all kernel functions we traced from our Cloud servers.
Table 1Examples of Cloud server behaviour algorithms
Bubble sort
merge sort
Cocktail sort
BMH search
Rabin-Karp search
Gaussian classifier
Neural network classifier
Sieve Atkin (an algorithm for finding all prime number)
Figure 1 shows a structure of Black box. Cloud server users consume Cloud resources via requests. This de-sign employs a monitor, which envelops the service that intercepts and registers the requests before passing it to the service. While the service is executing, the LTTng profiler is counting globe system calls that have been registered. Simultaneously, the monitor is counting ex-ternal resource events concurrently. All data is then transmitted to an ICMetrics statistic module to gener-ate a feature vector.
The alternative “white box” approach is designed to explore the internal behaviour of servers. The white box is designed to investigate the Cloud servers with similar process. This approach requires access to the code of service program, which allows a wider variety of features to be obtained although naturally requires the cooperation of the service providers to gain access to the source code. A common approach is to imple-ment a logger inside of the code and the logger keeps track throughout the service operations. Through Fig. 2, we can see a software profiler is used to log service be-haviour and send it to ICMetrics statistic module for output. There are two requirements of feature to be chosen. They are low intra-sample variance (i.e. the values produced for the same device) and high inter-sample variance (i.e. the values produced for the differ-ent devices). The features we chose for white box are as follows:
A histogram of how many objects are allocated in each method.
A histogram of how many input arguments are passed to each method.
A histogram of how many conditional statements are encountered in each method.
A histogram of the methods called from within each method.
A histogram of the invariant loops encountered within each method.
A histogram of the accesses to external resources A histogram of comparisons for loop invariants per method.
A histogram of number of loops, not iterations, encountered within each method.
A histogram of method call depths.
The framework
To generate encryption key, it requires developing suit-able methods for combining selected features so as to produce unique basis number - an initial binary number unique to the Cloud servers from which actual encryp-tion keys may be derived. The fundamental requirement for such methods are that they should allow for generat-ing basis numbers with low intra-sample variance (the values produced for the same device) simultaneously with high inter-sample variance (the values produced for different devices). The ideal case should have no inter-sample overlap of potential unique basis numbers [16]. Two such techniques have been investigated to combine features, namely, feature addition and concatenation [15]. The accuracy of addition is less stable than concatenation but although with the concatenation technique, the key
Table 2Monitored Linux kernel functions
sys_munmap hrtimer_expire_entry sys_lseek sys_poll
sys_recvmsg sys_fcntl kmem_cache_alloc_node sched_stat_runtime
sys_wait4 sched_stat_iowait sched_wakeup power_end
timer_expire_entry block_unplug sys_fadvise64 sys_close
mm_page_pcpu_drain sched_migrate_task sys_rt_sigprocmask softirq_exit
sys_futex sys_mmap sys_read sys_select
power_start sys_newfstat kmem_cache_free sys_newstat
sys_writev sys_splice sys_ioctl sched_stat_sleep
irq_handler_exit sys_open irq_handler_entry hrtimer_init
sys_write exit_syscall mm_page_alloc_zone_locked softirq_entry
workqueue_execute_start rcu_utilization sys_setitimer sys_eventfd2
mm_page_alloc softirq_raise timer_expire_exit sched_stat_wait
sys_recvfrom sched_switch workqueue_activate_work block_rq_issue
hrtimer_cancel sys_sync_file_range hrtimer_start scsi_dispatch_cmd_start
hrtimer_expire_exit block_bio_remap sys_sendmsg kmem_cache_alloc
is still not stable enough, since the fluctuation between the bits is much higher. The concatenation produces key stability up to 94 % [9]. In order to increase that, we introduce a multi-dimensional approach to analyse fea-tures described above. Grey code is applied to increase stability of binary representation of unique basis number. ICMetrics technology is defined as a two-step process [6]:
Calibration phase:
1. For each sample device or system: measure the desired feature values.
2. Generate feature distributions describing the frequency of occurrence of discrete value for each sample system.
3. Normalize the feature distributions and generate normalization maps for each feature.
Operation phase:
1. Measure desired systems’features.
2. Apply the normalization maps to generate values suitable for key generation.
3. Apply the key generation algorithm.
In the calibration stage, certain features, which are de-scribed from previous section have been identified as∅1, ∅2, . . . of raw are extracted. Then, the data is forwarded to quantise and normalise process. Finally, a multi-dimensional normalisation map is generated based on normalised data. In the operation phrase, a measured data is mapped to multidimensional normalisation map to form a unique basis number. Finally, the unique basis number is forward to generate encryption key.
Feature quantization and normalization
A conventional strategy for generating an encryption key from a given feature distribution may involve quantising distribution into fixed subsets, then, each value within
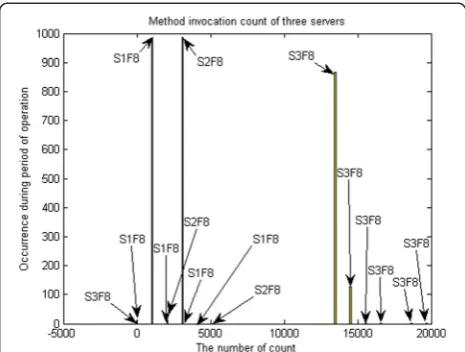
its subset are mapped to a certain single number. For in-stance, Fig. 3 shows the probability distribution of a feature named number 8 for three different servers. It may be noted from Fig. 3, that there are a number of tightly grouped value regions for each server. For con-tinence, the Letter S is used to represent server number and F is used to represent feature. For example, S1F8 represents the feature of number 8 of server 1. In Fig. 3, the data occurred in range 0 to 20 are all mapped into 20. In general, this would cover majority of the values generated by the same server within the same quantisa-tion interval. However, after scrutinise Fig. 3, we dis-covered two problems.
Firstly, some data overlapped at some points. For in-stance, feature S3F8 and S1F8 overlapped at 20. Sec-ondly, some data have unusual distributions. It is well known that processing unusual distribution is very
Fig. 3Feature occurrence count every two seconds of one operation of three server benchmark
Fig. 1Design of a system using the“black-box”method Fig. 2Shows a potential design for a system employing the
difficult in pattern recognition technologies. To solve that, we propose a multi-level mapping in cooperate with a probability system technology, which is inspired by [6]. The multi-level mapping system includes two steps:
Step1: Define a virtual model for all features. The virtual model is a virtual probability distribution for a particular feature with no overlap. For instance, Fig.4has three servers in total; the distribution is then quartered into 3 blocks. Then, the values are mapped from real distribution to virtual model within their owner blocks. However, in practise, it is not fair to split a virtual model into 3 equal-sized blocks. The blocks should be splinted based on the number of quantised intervals.
Step 2: Repeat for each Cloud server N
◦Map each feature value of Cloud server to virtual model within specific range, which is defined in step1.
◦Each feature value is mapped by descending order. A pseudo-Gaussian is produced by alternating below and above the mean.
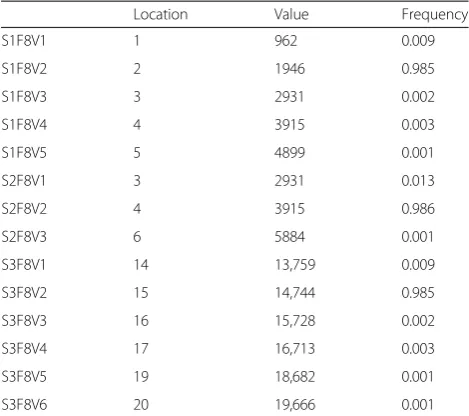
The meaning of the above mapping system is that con-struct a new probability distributions which have a Gaussian shape. Then, the new distribution can be used directly in our system. In order to explain the scenario above simply, we assume that we have three Cloud servers (S1, S2 and S3), each of what contains one feature (F8) with certain amount of values. After quantization, each value is represented as S1F8V1 as you can see from Table 3. After quantisation, we have feature values represented by Fig. 4 and Table 3. Through Table 3, location represents original position on the real distribution. Value means the value at corresponding location and frequency shows how often it appeared. Figure 4 is a histogram of feature 8 of all
three servers. Let X1 = {S1F8V1,…,S1F8V4}, X2 = {S2F8V1,…,S2F8V3} and X3 = {S3F8V1,…,S3F8V6}.
According to the algorithm above, in step1, a virtual feature distribution (virtual model) is defined based on the number of values. In our example, we can see that server 1 has 5 values, server 2 has 3 values and server 3 has 6 values. So the virtual model is defined as the pro-portion by 5/14, 3/14, 6/14. This means server 1 has 3 intercepts, server 2 has 3 intercepts and server 3 has 6 intercepts in our virtual model.
Continue following the algorithm above, we now map real value to virtual model. The values are mapped in order of descending frequency at the centre of the interval range. For instance, the virtual model is defined as {1,..,4} for S1F8, {5,..7} for S2F8 and {8,…,14} for S3F8. S1F8V2 is mapped to location of 3. Then, S1F8V1 is mapped to 2. Next, S1F8V4 is mapped to 4. After that, S1F8V3 is mapped to1. Finally, repeat until this process go through every value. Table 4 shows the result after mapping process. Figure 5 is the distribu-tion of Feature 8 after mapping process. Then, the new probability distribution is available for any pattern rec-ognition system. The overlap values are managed by probability during execution.
Multi-dimensional normalization map
After quantization and normalisation, our goal now is to generate a multidimensional normalization map–a multi-dimensional normalization map is a multi-multi-dimensional feature value space. A normalization map is used to gener-ate a unique basis number. In our previous work [17], normalization maps are linear based, mapping each in-dividual feature to a vector and concatenating them to-gether. This method may be fairly easy to implement
Fig. 4Feature value of three servers
Table 3Feature value of three servers
Location Value Frequency
S1F8V1 1 962 0.009
S1F8V2 2 1946 0.985
S1F8V3 3 2931 0.002
S1F8V4 4 3915 0.003
S1F8V5 5 4899 0.001
S2F8V1 3 2931 0.013
S2F8V2 4 3915 0.986
S2F8V3 6 5884 0.001
S3F8V1 14 13,759 0.009
S3F8V2 15 14,744 0.985
S3F8V3 16 15,728 0.002
S3F8V4 17 16,713 0.003
S3F8V5 19 18,682 0.001
but causes key generation unstable. The fundamental idea of the multi-dimensional normalization map is that to map a measured series of feature data into a multi-dimensional space and to determine whether the data is located in that range. The higher dimension may in-crease the probability of data appear in that range. This is because even there are some features which have ex-ceed the correct range, the majority of other features are still well qualified to make right decision. The higher dimensional feature space increases the entropy of digital identity. In other words, for an attacker, the difficulty to decrypt the key is increasing exponentially. In order to determine a specific range in the space, we also developed a multi-dimensional space definer algo-rithm, which is used to define a multidimensional space. Basically, the algorithm adopts normal pattern
recognition techniques to detect which part it belongs to. Then, the measured data will be guided to that specific space. Finally, a unique basis number gener-ation algorithm is deployed to produce a basis number based on measured data itself and the specific multi-dimensional space range. An example of space definer algorithm is described below:
Assuming we have 9 web servers, each server has a training data set X containing 60 features, each feature has 1000 observations. X∈Rn, n = 60. Let μ and ∑ be the mean vector and covariance matrix of X. The density function for this distribution is
Pμ;X¼ 1 2π
ð Þn=2qffiffiffiffiffiffiffiXe
−ðx−μÞTX−1 x−μÞ=2 ð
For a measured feature x,x∈Rnis an observation of test data which contains 60 feature values. The probability of x is the integral of the quantization which defined in the pre-vious step.
Max Z a b
Pi
; ð0<i<9Þ
In the function above, ‘a’ is a start point of the quantization which we have defined in the previous step and ‘b’ is an end point of the quantization. i represents severs number, which we have 9 servers in our experience.
Pirepresents the ith server in our experiment. The func-tion results a probability of x belongs all 9 servers. The system should now guide to map x to the range with high-est probability.
Multi-dimensional key space generation
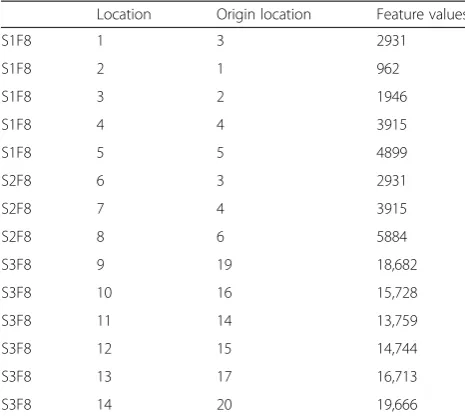
Having derived a normalization map, our goal now is to map ‘x’ (a measure of multi-dimensional test data) to a specific range in the multi-dimensional space, which is de-fined in the previous step. Then, we apply a unique binary basis number generation algorithm, which maps test data into multi-dimensional space and generate coordinate range identifier (a unique number used to identify inter-cepts in the multi-dimensional space) of each dimensional to a binary vector at once. The binary number generation algorithm processes include: (1). define all feature value ranges of a server in the multi-dimensional space. The fea-ture values ranges are the space determine whether the feature value are correct or not. Any value within the range will map to a correct binary number but any value outside the range will map to a wrong binary num-ber. (2). the defined feature range is then, delivered to compute it identifier number of a feature value segment according to a corresponding globe feature range. The intercepts identifier number is generated based on globe feature distribution, which we will
Fig. 5Feature values after multi-level mapping Table 4Feature values after multi-level mapping
Location Origin location Feature values
S1F8 1 3 2931
S1F8 2 1 962
S1F8 3 2 1946
S1F8 4 4 3915
S1F8 5 5 4899
S2F8 6 3 2931
S2F8 7 4 3915
S2F8 8 6 5884
S3F8 9 19 18,682
S3F8 10 16 15,728
S3F8 11 14 13,759
S3F8 12 15 14,744
S3F8 13 17 16,713
explain by an example next. (3). the segments of all features are collected and combined together. The segments identifier is represented by grey code. An example is showed below:
(1) Define left and right boundaries for all features in all servers (define feature range).
Ri¼fmi−kiδi;miþkiδig; Rgi¼mgi−kgiδgi;þkgδgi
Figure shows an example of Unique binary number generation on one dimension. It is difficult to explain on multi-dimensional space, so we use a one dimension model for explaination. Where mi and δi are mean and standard deviation of a server’s feature. mg and δg are
mean and standard deviation of global feature distribu-tion. The globe feature values including all servers that we want to be identified. SoRiis the intercept of feature iand Rgi is the intercept of featureiof all servers in the multi-dimensional space.kiis used to control the intercept to cover enough space in the distribution. The values ofki are chosen depending on each feature’s density. For in-stance, in Fig. 6,kgiis set to 10 to cover global feature dis-tribution. So, Ri= (mi−kiδi,mi−kiδi) is the range of featureithat we need to verified.
(2) Generate feature value segments identifier number for every feature. The globe feature distribution is segmented by the intercept of featureiof server 1. We calculate how many segments are there in the left of featureiof server 1:
SL¼ðmi−kiδiÞ−mgi−kgiδgi=Ri
And the how many in the right:
SR¼mgiþδgi−ðmiþkiδiÞ=Ri
The global range can be segmented by
S¼ ðmiþkiδiÞ−ðmi−kiδiÞ
mgþkgδg
−mg−kgδg¼ kiδi kgδg
In the above equations SL is the number of intercepts on the left of our test data and SR is the number of in-tercepts on the left of our test data. S is the total number of intercepts in this feature distribution. In practical, we add one more intercept at left and another intercept at right, which you can see from Fig. 6. Now, we use binary bits of grey code to index each segment of the distribu-tion. The indexes start from 0 and end with binary num-ber 1000.
Generally, log2 kiδi
kgδgþ2
bits are sufficient to index
each segment with a unique binary number. In Fig. 6, there are 9 segments covering global feature distribution.
log2(9) bits are employed to identify each intercept. As the processes above, the unique basis number is generated by cascading all indices of feature range from the n dimensional feature space. This Fig. 6, “0010” is cascaded with other binary indices which from other di-mensions. The length of the unique basis number is:
L¼Xni¼
1 log2 kiδi kgδgþ2
:
Unique basis number correction
In order to improve the stability of unique basis number, we investigated two error correction schemes. The Reed-Solomon code [10] and Shamir secret sharing [3]. Accord-ing to our test data, the unique basis number is an 800 bits long binary number. To adapt Reed-Solomon code, we chop down it into 160 pieces. Each piece message contains 5 bits. We choose RS(7,5) and set a Galois field GF(2m), m = 3. The generator polynomial is P(x) =x3+x+ 1. The above scenario allows correcting 1bit every 5 bits.
Experiment and result
In this section, we first evaluate hamming distance of our unique basis numbers to the corresponding servers. Then, we evaluated our error correction algorithm with false negative rate. Finally, we developed a smooth en-tropy evaluation system under appropriate circumstance.
Hamming distance VSki
According to the previous section, ki is used to control feature distribution range in a specific globe feature range. The value ofkiδidefine the width of feature range that any values within the range will map to a correct binary number. As the result of that, the ki should be chosen in which kiδi is greater enough to cover entire feature distribution. The hamming distance is a differ-ence measurement of two binary numbers. In this case, we use it to evaluate the stability of the unique basis
number. The experiment is designed by comparing ham-ming distances during the increasing of ki. Through Fig. 7, we can see that hamming distance is getting very high whenkiis small. During the increase ofki, the ham-ming distances reduced dramatically from 20 to 100. Servers 1, 2, 3, 4, 5 and 9 start to converge when ki around 25 and reach optimal around 100, however, servers 6, 7 and 8 start converge whenkiaround 60 and reach optimal around 800.
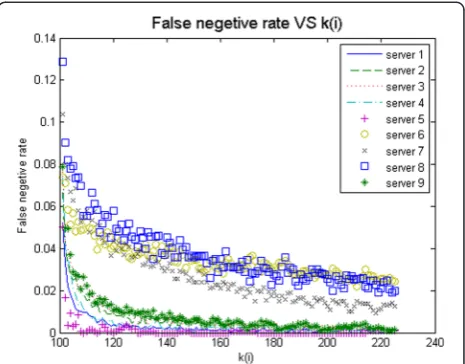
False negative rate vski
The other method we used to evaluate our system is the false negative rate compare with ki. The false negative rate is the percentage of failures among attempts by cli-ent for key generation. Figure 8 demonstrates expected trends, in particular that false negative rate generally de-crease as ki increasing. Moreover, several points of the figure give evidence that the optimalkishould be chosen between 120 and 130 for server 1, 2, 3, 4, 5 and 9. But, for server 6, 7 and 8, the optimalkishould be chosen be-tween 200 to 220.
False negative rate vs RS codes
In order to deliver a stable unique basis number, we ana-lyse false negative rate during the increase of the mes-sage length of RS codes. Figure 9 illustrates false negative rate trend versus different RS code message length. Firstly, we set the message length to 3 and code word length to 5, which means there is only 1 bit can be corrected over 3 bits. Then, we increase the length of message and code word both by 1. So, in the second test, the RS code was set to RS(6,4). After that, we keep in-crease the message length and code word until they reach RS(12,10). In this experiment, we setkito 125 for server 1, 2, 3, 4, 5 and 9 but setkito 220 for server 6, 7 and 8. Through the figure we can see that after applied
error correcting process, the false negative rate reduced dramatically. For instance, false negative rate of server 8 is around 0.06, which we can see from Fig. 8. Through Fig. 9, we find the negative rate reduced to around 0.038. Figure 9 also imply that it increases dramatically when message length is greater than 5 except server 1, 2 and 3. False negative rate of server 1, 2 and 3 are very stable during the increase of message length. This is probably because the feature values of these three servers are very stable in the multi-dimensional space. We want to select a RS code that it should have longer message code but lower false negative rate. The longer message length will release less information about the unique basis number which means it more secure. The optimal RS code we should choose in this scenario should be RS(7,5).
Fig. 7Hamming distance verses coefficient k
Fig. 8False negative rate performance during the coefficient K increase
Entropy
Fundamental to our empirical evaluation is the measure of software behaviour entropy we chose. As described above, the software behaviour are used to form a unique basis number. Intuitively, our measure of entropy should capture the amount of remaining uncertainty in the unique basis number. Initially, our unique basis number is 800 bits long, if an attacker knows nothing about the system, then, the entropy is simply 2800. In fact, the bits in unique basis number are not independent. There are two aspects we should consider in the section, error cor-rection and uniform random bits of unique basis num-ber. Firstly, we need to calculate how many uniformly random bits can be extracted from the feature set. This is the process of converting an arbitrary random source into a source with smaller alphabet and almost uniform distribution. Secondly, error correcting process is ap-plied to improve the robustness; we have to eliminate correct bits as well. In order to capture realistic entropy, assuming in the feature X with probability value ofχand probability distributionPX. We apply entropy smoothing function ƒ:χ → y to X such that Y=f (X) is uniformly distributed over its range y. The largest Y such that Y is still sufficiently uniform is a measure for the amount of smooth entropy inherent in X or extractable from X, relative to the allowed deviation from perfect uniformity. In an alternative view, this process eliminates almost all partial information available about X and concentrates as much as possible of the uncertainty of X in Y.
The method we use to quantify the remaining uncer-tainty in Y, which its divergence from a perfect uniform distribution, we use relative entropy between X and the uniform distributionPuoverχ,
D Pxð jjPUÞ ¼ logj jx −H xð Þ
And the L1 distance from the uniform distribution,
Px−PU
j j
j j ¼X
x∈X
PXð Þx −PU
j j
The algorithm includes two steps. At first step, using BIN PACKING algorithm group the bits’probabilities to provide most equal sized block (each block has similar probability in summation). The bin packing is an algo-rithm of deciding whether n positive integers can be par-titioned into b subsets such that the sum of every subset is at most c. Bin packing is a NP-complete problem and the smaller alphabet of output, the more uniform is its distribution.
Secondly, the algorithm then, repeatedly check whether the answer is the best by comparing divergence and L1 distance. An example is explained below:
Assuming we have feature probability distribution as show in Table 5.
Step 1: We want to produce an almost uniform distribution Y from a random variable X.
After apply bin packing algorithm we got:
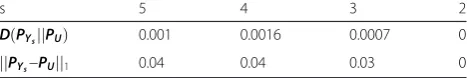
Step 2: Calculate relative entropy and L1 distance of groups in Table6.
Through Table 7, we observe that a perfect 1 bit can be produced from feature X. In general, we expect that the output can be made more uniform by decreasing it size.
Secondly, error correction we mentioned in previ-ous section chop down the unique basis number into N/5 pieces. N is the length of unique basis number. So the total number of bits that is going to correct is N/5 as RS(7,5) only correct 1 bit of 5. Although, the RS(7,5) scheme doesn’t correct every time but it does release some threads of the unique basis num-ber. So, we eliminate one segment of every 5 seg-ments. In practical, a perfect uniform distribution does not exist. The measure of the non-uniformity are always selected a minimum value. So we develop the following formula:
Let M be a no uniformity measure. A family X of ran-dom variables with m dimensions with alphabet χ has smooth entropy Ψ (X). A function ƒ:χ → y, φ (X) = 2|y| with condition when M(Y) is minimum. E is the number of bits is corrected in previous process. Formally,
Ψð Þ ¼X 2∑mm≥1fj jjy f:x→y:M Yð Þming−E
To calculate the entropy, we set k = 130 and RS code equal to RS(7,5). The entropy of multi-dimensional space we can report is 290.
Table 5A random value distribution
x a b c d e F g h i
PX(x) 0.08 0.05 0.06 0.16 0.19 0.21 0.19 0.02 0.04
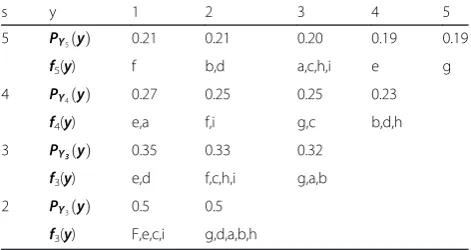
Table 6The table shows how the random variable x with nine values in Table 5 can be converted to more uniform random variables
s y 1 2 3 4 5
5 PY5ð Þy 0.21 0.21 0.20 0.19 0.19
f5(y) f b,d a,c,h,i e g
4 PY4ð Þy 0.27 0.25 0.25 0.23
f4(y) e,a f,i g,c b,d,h
3 PY3ð Þy 0.35 0.33 0.32
f3(y) e,d f,c,h,i g,a,b
2 PY3ð Þy 0.5 0.5
Conclusion
In this paper, we investigated a reliable cryptographic key generation algorithm which extracts Cloud servers’ behaviours as features to form a digital signature for Cloud environment. Firstly, in order to extract Cloud server behaviours, we developed two strategies, which have been termed a black box and a white box. The black box is responsible for behaviours outside the Cloud servers, while the white box is designed for exploring the internal behaviours of Cloud servers. In total, there are 60 features have been collected and evaluated for our system. Then, a multi-level mapping algorithm is used to transfer unusual distribution into a traditional Gaussian form. Next, a multi-dimensional normalization map generation algorithm is programed to generate a multi-dimensional normalisation map. After that, a multi-dimensional binary key mapping algorithm is developed to map a measured data from multi-dimensional space to a key vector. Next, a reed-Solomon error correction algorithm is adopted to improve stability of binary key. Finally, an entropy smoothing algo-rithm is then explored based on Bin Packing algoalgo-rithm in-corporate with relative entropy and L1 distance.
Our result indicates that the usability of ICMetrics technology in Cloud environment is satisfied. The false negative rate we can report is around 0.003 on average of 9 servers. Although, server 6, 7 and 8 have higher false negative rate than others, but they are still feasible for the system. In comparison with our previous re-search, the false negative rate have been reduce twice times. The entropy of the unique basis number we can report is at least 290, which has satisfied the current standard of cryptographic system.
Competing interests
The authors declare that they have no competing interests.
Authors’contributions
BY carried out the feature extraction, participated multi-dimensional algorithm design and evaluation and drafted the manuscript. GH provided idea of multidimensional generation algorithm and participated in the system evaluation. FW participated in the implementation of black box design of using LTTng. MH participated in the available features analysis. All authors read and approved the final manuscript.
Authors’information
Bin Ye received his diploma degree in computer science in 2009 from the department of computer science of the Beijing Geely University. In 2012, he obtained his MSc by research in the University of Kent in the area of mobile Cloud computing. He investigated a framework of dynamically partition a mobile application between mobile phones Cloud servers. Since 2012, he has been a researcher at image and signal process research group and is pursuing a PhD degree. His work focus on Cloud security–which is
Encryption key generation based on the characteristics which extracted from software behaviours and construction in Cloud environment.
Dr Gareth Howells has been involved in research relating to security, biometrics and pattern classification techniques for over twenty five years and he has been awarded, either individually or jointly, several major research grants relating to the pattern classification and security fields, publishing over 150 papers in the technical literature. Recent work has been directed towards the development of secure device authentication systems which has received significant funding from the a variety of sources. Prof Frank Wang is a head of school of Computer science department of the University of Kent. He is the Chairman (UK & Republic of Ireland Chapter) of the IEEE Computer Society and Fellow of British Computer Society. He has served the High End Computing Panel for Science Foundation Ireland (SFI) and the UK Government EPSRC e-Science Panel.
Acknowledgements
The authors gratefully acknowledge the support of the EU Interreg IV A 2 Mers Seas Zeeën Cross-border Cooperation Programme–SYSIASS project: Autonomous and Intelligent Healthcare System (project’s website http:// www.sysiass.eu/).
Author details 1
The School of Engineering and Digital Arts, The University of Kent, Jennison Building - Room 1.46, Canterbury CT2 7NTKent, UK.2The School of
Computing, The University of Kent, Canterbury CT2 7NTKent, UK.
Received: 11 April 2015 Accepted: 2 October 2015
References
1. Appiah, K, Zhai, X, Ehsan, S, Cheung, WM, Hu, H, Gu, D, Howells, G (2013) Program Counter as an Integrated Circuit Metrics for Secured Program Identification. In Emerging Security Technologies (EST), fourth international conference on, IEEE, Cambridge, p98–101
2. Barham, P, Dragovic, B, Fraser, K, Hand, S, Harris, T, Ho, A, Warfield, A (2003) Xen and the art of virtualization. ACM SIGOPS Operating Systems Review. doi:10.1145/1165389.945462
3. Benaloh, J (1987) Secret sharing homomorphisms: Keeping shares of a secret secret. In Advances in Cryptology—CRYPTO’86, pp. 251–260. doi:10.1016/S1361-3723(05)00151-X
4. Chang, YJ, Zhang, W, Chen, T (2004) Biometric-based cryptographic key generation. In. Multimedia and Expo, ICME '04. 2004 IEEE International Conference on , vol.3, no., pp.2203-2206
5. Desnoyers, M, Dagenais, M (2008) LTTng: Tracing across execution layers, from the Hypervisor to user-space. In: Linux Symposium (Vol. 101) 6. Howells, G, Papoutsis, E, Hopkins, A, McDonald-Maier, K (2007) Normalizing
Discrete Circuit Features with Statistically Independent values for incorporation within a highly Secure Encryption System. In Adaptive Hardware and Systems, 2007. AHS 2007. Second NASA/ESA Conference on, EEE, Edinburgh, pp.97–102)
7. Jermyn, I, Mayer, A, Monrose, F, Reiter, MK, Rubin, AD (1999) The Design and Analysis of Graphical Passwords. In Proceedings of the 8th conference on USENIX Security Symposium -(SSYM'99), Vol. 8. USENIX Association, Berkeley, CA, USA, 1-1. USENIX Association, Washington, D.C
8. Kolbitsch C, Comparetti PM, Kruegel C, Kirda E, Zhou X, Wang X, Antipolis S (2009) Effective and efficient malware detection at the end host. System 4(1):351–366. doi:10.1093/mp/ssq045
9. Kovalchuk, Y, McDonald-Maier, K, Howells, G (2011) Overview of ICmetrics Technology-Security Infrastructure for Autonomous and Intelligent Healthcare System. Int J U-& E-Service, Sci & Tech, 4(3): 49-60 10. Krachkovsky VY (2003) Reed-solomon codes for correcting phased error
bursts. IEEE Transact Info Theory 49:2975–2984. doi:10.1109/TIT.2003.819333 11. Maier, K D (2003) On-chip debug support for embedded Systems-on-Chip. Proceedings of the 2003 International Symposium on Circuits and Systems, 2003. ISCAS’03., 5. doi:10.1109/ISCAS.2003.1206375
12. Meguerdichian, S, Potkonjak, M (2011) Device aging-based physically unclonable functions. 2011 48th ACM/EDAC/IEEE Design Automation Conference (DAC), 288–289. doi:10.1145/2024724.2024793
13. Monrose, F, Reiter, MK, Wetzel, S, Labs, B, Technologies, L, Hill, M (2001) Cryptographic Key Generation from Voice. IEEE, Oakland, CA, pp.202-213 doi: 10.1109/SECPRI.2001.924299
Table 7Relative entropy and L1 distance of every group in Table 6
s 5 4 3 2
D Pð YsjjPUÞ 0.001 0.0016 0.0007 0
14. Nurmi, D, Wolski, R, Grzegorczyk, C, Obertelli, G, Soman, S, Youseff, L, Zagorodnov, D (2009). The eucalyptus open-source cloud-computing system. In 2009 9th IEEE/ACM International Symposium on Cluster Computing and the Grid, CCGRID 2009, pp. 124–131. doi:10.1109/ CCGRID.2009.93
15. Papoutsis, E, Howells, G, Hopkins, A, McDonald-Maier, K (2007) Key Generation for Secure Inter-satellite Communication. Second NASA/ESA Conference on Adaptive Hardware and Systems (AHS 2007), 671–681. doi:10.1109/AHS.2007.67
16. Papoutsis, E, Howells, G, Hopkins, A, McDonald-Maier, K (2007). Normalizing Discrete Circuit Features with Statistically Independent values for incorporation within a highly Secure Encryption System. In Adaptive Hardware and Systems, 2007. AHS 2007. Second NASA/ESA Conference on, pp. 97–102
17. Papoutsis, E, Howells, G, Hopkins, A, McDonald-Maier, K (2009). Integrating Feature Values for Key Generation in an ICmetric System. 2009 NASA/ESA Conference on Adaptive Hardware and Systems. doi:10.1109/AHS.2009.30 18. Tahir, R, McDonald-Maier, K (2012) An ICMetrics based Lightweight Security
Architecture using Lattice Signcryption. In Emerging Security Technologies (EST), 2012 Third International Conference on, IEEE, Lisbon, pp. 135–140 19. Wang, X, Jhi, Y-C, Zhu, S, Liu, P (2009) Behavior based software theft
detection. Proceedings of the 16th ACM Conference on Computer and Communications Security - CCS’09, 280. doi:10.1145/1653662.1653696
Submit your manuscript to a
journal and benefi t from:
7 Convenient online submission
7 Rigorous peer review
7 Immediate publication on acceptance
7 Open access: articles freely available online
7 High visibility within the fi eld
7 Retaining the copyright to your article