R E S E A R C H A R T I C L E
Open Access
Using learning analytics to develop
early-warning system for at-risk students
Gökhan Akçap
ı
nar
*, Arif Altun and Petek A
ş
kar
* Correspondence:gokhana@ hacettepe.edu.tr
Department of Computer Education and Instructional Technology, Hacettepe University, Ankara 06800, Turkey
Abstract
In the current study interaction data of students in an online learning setting was used to research whether the academic performance of students at the end of term could be predicted in the earlier weeks. The study was carried out with 76 second-year university students registered in a Computer Hardware course. The study aimed to answer two principle questions: which algorithms and features best predict the end of term academic performance of students by comparing different classification algorithms and pre-processing techniques and whether or not academic
performance can be predicted in the earlier weeks using these features and the selected algorithm. The results of the study indicated that the kNN algorithm accurately predicted unsuccessful students at the end of term with a rate of 89%. When findings were examined regarding the analysis of data obtained in weeks 3, 6, 9, 12, and 14 to predict whether the end-of-term academic performance of students could be predicted in the earlier weeks, it was observed that students who were unsuccessful at the end of term could be predicted with a rate of 74% in as short as 3 weeks’time. The findings obtained from this study are important for the
determination of features for early warning systems that can be developed for online learning systems and as indicators of student success. At the same time, it will aid researchers in the selection of algorithms and pre-processing techniques in the analysis of educational data.
Keywords:Academic performance prediction, Early-warning systems, At-risk
students, Online learning, Educational data mining, Learning analytics
Introduction
The prediction of academic performance is one of the first and most popular subjects in the fields of learning analytics and educational data mining (Chatti, Dyckhoff, Schroeder, & Thüs, 2012; Peña-Ayala,2014; Romero, Olmo, & Ventura, 2013). Aca-demic performance can be defined as the score obtained by students from an evalu-ation made at the end of a learning activity. This score could belong to a short-term learning activity (i.e. a learning object), a lesson, an academic term, or to a complete
educational process, i.e., GPA (Peña-Ayala, 2014). Studies have indicated that the
learning traces left by students in online learning settings (participation in discussions, spending time on the learning material etc.) are significant in predicting their academic performance.
Lopez, Luna, Romero, and Ventura (2012) analysed the relationship between
stu-dents’ academic performance and their interactions in the discussion forum in the
Moodle learning management system. The researchers identified eight features of stu-dent participation in the discussion forum. By using these features, they attempted to predict student success as pass or fail. Furthermore, they compared the performance of various classification algorithms based on the classification accuracy. According to their findings, the Naive Bayes algorithm reached a classification accuracy of 89.4%, carried out via six features that was determined as a result of the feature selection process. The study findings also revealed that the participation of students in the discussion forum in the Moodle setting could be a reliable feature in the prediction of students’academic performance.
In another study carried out in the Moodle setting by Romero, Ventura, Hervás,
and Gonzales (2008), the performance of a group of classification algorithms was
compared in order to observe which one would predict the academic performance the most accurate. The researchers selected nine different features that had
reflected students’ use of Moodle in addition to their participation data in the
dis-cussion forum. Students’ academic performance was coded as pass, fail, good, or
excellent. Upon examination of the research findings, it was observed that the clas-sification accuracy of algorithms varied in the range of 60 to 70%. The research
re-sults indicated that students’ low usage of online learning system could be one of
the reasons behind the low accuracies.
Osmanbegovićand Suljić(2012) established a classification model in order to predict the success of students in university using data relating to their demographics and
pre-university success. They used students’ final score in the course of “Management
In-formatics”as the feature for success. The researchers reported that the Naive Bayes al-gorithm correctly classified students with a rate of 76.65% using the given set of data. In another study that aimed to predict student performance using interaction data
ob-tained from the learning management system, Macfadyen and Dawson (2010) identified
fifteen features that had indicated a statistically meaningful relationship with the
stu-dents’academic performance. They used the logistic regression method in order to
pre-dict the academic performance of students using these features. The researchers stated that the established classification model accurately classified unsuccessful students with a rate of 81%. The number of messages sent to the discussion forum, number of sent emails, and the number of completed assignments were identified as important features in predicting end of term grades. This study further indicated that pedagogically mean-ingful information could be produced from data on student interactions obtained from learning management systems.
The majority of studies predicting academic performance were carried out using data collected at the end of term. The results obtained from those studies were significant in terms of their determination of features which might lead to a fail-ure; however, they did not provide excessive information to prevent failure. On the other hand, online learning settings constantly collect student interaction data. The prediction models that could be established with the analysis of this data in the earlier stages would be effective in the prevention of possible failures and help instructional designers design and develop pedagogical intervention
sys-tems (Costa, Fonseca, Santana, de Araújo, & Rego, 2017), which are also referred
Educational early warning systems
Early warning systems can be regarded as the next step in the prediction of academic performance. The aim here is the prediction of academic performance at an earlier stage using features that are derived from online learning settings. As such, teachers may be able to identify students under risk of academic failure and offer assistance in order to help these students make improvements (Campbell, DeBlois, & Oblinger,
2007). In other words, the performance exhibited by students in lessons could be
pre-dicted in advance and possible failures can be prevented by timely interventions (Johnson, Smith, Willis, Levine, & Haywood,2006).
Although educational early warning systems have received more attention in recent years, the Signal Project implemented at Purdue University (Indiana, USA) has been cited as a key example of a successful early warning system in the literature (K. E. Ar-nold, 2010). Instructors are provided a Signal plug-in to be used in their online envi-ronments. This plug-in allocates a risk indicator for each student by analysing their interactions (e.g. whether students have read online course materials assigned by the professor, done practice assignments, attended tutorial sessions after class or partici-pated in online class discussions etc.) through the aid of prediction algorithms. The risk indicator structured as a traffic light provides feedback to the student regarding their lesson performance in the form of red (indicating a high probability of failure), yellow (medium probability of failure), and green (high probability of success) lights. A notable improvement in student success was observed in lessons which utilized the Signal sys-tem in the pilot scheme that was implemented in the university over a 2-year period. In the first week of a lesson attended by 220 students, 45 students were placed in the red (high risk) and 32 in the yellow (medium risk) categories. In the progressive weeks, 55% of students in the red group moved up to the yellow group (C level) and 24.4% to the green group (A or B level), while 10.6% remained in the red group. It was observed that 31% of students starting in the yellow group remained in in the same group while 69% moved up to the green group.
Hu, Lo, and Shih (2014) analysed students’ interaction data in an online lesson via data mining techniques in order to develop an early warning system that would predict the learning performance exhibited by students in a course. They set various classifica-tion models that would predict students’pass/fail status in lessons using the data from weeks 4, 8, and 13. The researchers concluded that their early warning system
success-fully predicted students’ learning performances. The experimental data presented by
the researchers indicated that the Classification and Regression Tree (CART) algorithm, supplemented by AdaBoost achieved over 90% accuracy in all datasets. On the other hand, the time dependent features derived from the learning management system had been stated as significant features in predicting student performance.
Previous studies showed that early prediction of academic failure is possible, however, transferability and generalizability of prediction models into the different courses are still limited. One of the major reasons behind this is because of different instructional conditions used in the course also affects the performance of prediction models (Gaš e-vić, Dawson, Rogers, & Gasevic,2016). Therefore, it is important to develop and val-idate prediction models for different courses. In this study, we aimed at developing an early warning system for a blended course and compared not only different
al-gorithms but also different pre-processing techniques effects on alal-gorithms’
predic-tion performances. Feature sets used in the study are also different from existing studies. The results obtained here will be helpful in designing early warning system for the online learning environments and exploring new features to be used in these systems.
The remainder of this paper is structured as follows: the second section provides in-formation about the aims of the study and the research questions to be addressed. The third section explains the research methods, data pre-processing, data analysis tech-niques, and the online learning setting where the data is collected. The fourth section provides information on the findings. In the conclusion, the findings are discussed in the light of other research findings and suggestions are made for future research.
Aims of the research and research questions
This study aims to predict the academic performance of students from “Computer
Hardware” course, using interaction data in a blended learning setting. In a two-stage
research process, the first stage aimed to use the whole data set to determine the
algo-rithm, pre-processing techniques, and features that would best predict the students’
end-of-term performances. The second stage investigated whether or not the students’
academic performance could be predicted in the earlier weeks using these features and analyzed through the selected algorithm. The research questions related to these stages are listed below:
1. When classification models formed using all data (14 week) are compared with respect to performance metrics, which classification algorithm/algorithms and pre-processing techniques are best in predicting unsuccessful students?
1.1.What is the impact of different data transformation techniques used in the pre-processing stage on classification performance?
1.2.What is the impact of different“feature selection”techniques used in the pre-processing stage on classification performance?
1.3.How is the performance of classification models established using fewer number of features in comparison to other classification models formed using all features?
1.4.Which features carry greater importance in the prediction of students’ performance?
Method
Participants and the data collection process
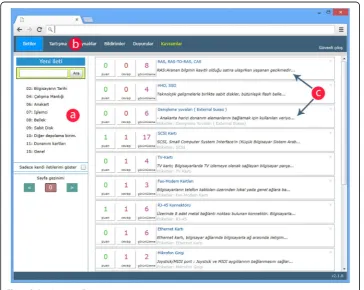
The study was conducted at a state university in Turkey with 76 students (41 women and 35 men; age range: 21 to 23 years) registered in the Computer Hardware course in the Department of Computer Education and Instructional Technology. Students partic-ipated in online learning activities for a period of 14 weeks and in face-to-face lessons in a blended learning environment. The online learning environment developed by the first author was used for online activities (Fig. 1). The online environment enabled the researchers collect detailed data regarding the online learning processes of students, who used the online learning environment to follow the lesson’s resources (Fig. 1-a), participate in discussions relating to the lesson (Fig. 1-b), and write down reflections (posts) regarding the concepts learned in the lessons (Fig. 1-c). This learning environ-ment also has features like notification page where students can track all the activities conducted by their classmates, and an announcement page where students can follow course updates.
The students were registered on the system in the beginning of the semester by re-searchers and were provided usernames and passwords to log into the system. The stu-dents were instructed in how to use the online learning system in the first week of the course. It was clearly explained to them that their reflective writings regarding the con-cepts they learned or will learn, their participation in online discussions such as reading the messages written by other classmates, and their reflections/evaluations were ex-pected. Students were informed that the reflections written down in the online learning
system would be taken into consideration in their end-of-term evaluation, while no limits or obligations were stated regarding the activities to be conducted.
Data collected about the students’learning processes at the end of term consisted of 3803 sessions, 119,921 page visits, 4566 written texts, 62 questions in the discussion forum, 297 answers, 8601 evaluations, and 3937 tags used to label written messages.
Students’ interaction data in the online learning environment and their end-of term
academic performance scores were used in the analysis.
Data pre-processing and feature extraction
Interactions carried out by students in the learning environment were taken into consideration in the determination of features that would be used in the prediction analyses and measurable metrics were established to reflect these interactions. The process of establishing features from raw data in the database was realized auto-matically via the help of an in-house developed tool. After the execution of the tool, a dataset is generated in which each row corresponds to a student and the columns represent the aggregated data regarding the extracted features. Features relating to the student interactions in the system were grouped under four head-ings: session, navigation, post and discussion. The list of extracted features and their
descriptions can be reviewed in the Appendix: (Table 14). The selection of which
of these features would be used in the analysis was decided in the pre-processing stage. Pre-processing carries notable importance in data mining studies. It is pos-sible to generate better and easily understandable prediction models through inter-ventions made at this stage.
The effect of two different pre-processing methods on the performance of classi-fication algorithms were tested throughout the data analysis process. These in-cluded data transformation and feature selection techniques. The most frequently cited data transformation methods in the literature include the standardisation of data and the discretization of continuous data into categorical data (Ribeiro,
Traina, & Caetano Traina, 2008). This transformation could be carried out by the
division of data into an equal number of units (equal frequency), division into in-tervals determined according to equal length cut-off points (equal width), or div-ision in accordance with the cut-off points determined by the user (user-defined) (Dougherty, Kohavi, & Sahami, 1995; Han, Kamber, & Pei, 2006). The performance of classification models obtained through the selection of two different data trans-formation techniques were compared in this study. Firstly, the continuous features were divided into three equal units with the same frequency using the equal fre-quency method and then analysed. Secondly, the features were separated into three equal divisions of the same width using the equal width method and the same ana-lysis was repeated with these features.
Another frequently used pre-processing technique in data mining studies is
fea-ture selection (Piramuthu, 2004). The aim of the feature selection is the
used, these algorithms allocate a score for every feature. Subsequently, the fea-tures will be ranked according to this score and analyses are conducted with a selected number of features. In this study, feature selection was carried out with
the help of the Rank widget in the Orange data mining tool (Demšar et al., 2013)
using three different scoring techniques (e.g., Gain ratio, Gini index, and SVM weight) and the performance of obtained prediction models were compared. The rank widget scores the features based on selected scoring techniques and passes selected features to the prediction model.
Academic performance
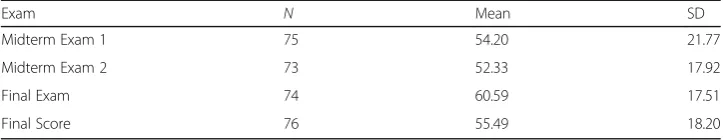
The end-of-term grades of students in the Computer Hardware course were taken into consideration as an indicator of academic performance. The students sat three written exams in total; two mid-terms and one final examination. Both mid-term and final exams were in-house 45-min sitting exam, based on the lec-ture notes. Questions were formed at the knowledge, comprehension, and analysis levels. Exam papers were graded by two instructors. The final scores of students were calculated with a weighting of 25% for mid-terms along with 50% for the
final examination. Descriptive statistics are given in Table 1. The academic
per-formance used as a class feature within the scope of the study was converted into a categorical form taking into consideration the indicators defined in the univer-sity’s undergraduate guidelines in the form of “Failed” (n = 27, score < = 50) and
“Passed” (n = 49, score > 50).
Data analysis
The establishment of a model that will predict students’ end-of-term academic
performance was treated as a binary classification problem. A high number of al-gorithms are present that could be used for classification purposes in data mining studies. The classification performance of algorithms can exhibit differences de-pending on the features of data set. As such, it is important to select an appro-priate classification algorithm that suits the data set (C Romero, Espejo, Zafra,
Romero, & Ventura, 2013). When selecting the best performing classification
al-gorithm based on performance measures, many researchers agree on repeating
the same analysis via different algorithms to reach a working model (Akçapınar,
Çoşgun, & Altun, 2013; Osmanbegović & Suljić, 2012; Cristobal Romero, Espejo,
Zafra, Romero, & Ventura, 2010). A similar approach was followed within the
scope of this study. Seven different rule, tree, function and kernel-based algo-rithms frequently used in the literature for classification purposes were selected: Naive Bayes, Classification Tree, Random Forest, Support Vector Machines,
Table 1Descriptive Statistics for Academic Performance
Exam N Mean SD
Midterm Exam 1 75 54.20 21.77
Midterm Exam 2 73 52.33 17.92
Final Exam 74 60.59 17.51
Neural Network, CN2 Rules, and k Nearest Neighbours. The performance of classification algorithms was compared based on the performance metrics of Ac-curacy, Sensitivity, Specificity, and F-Measure. The obtained results were general-ized using the 5-fold cross validation method, which splits the data into five folds and uses four folds for training and the remaining fold for testing. This proced-ure is repeated, so that each fold has been used for testing exactly once and per-formance metrics calculated based on the average perper-formance of the model (Pretnar, 2019).
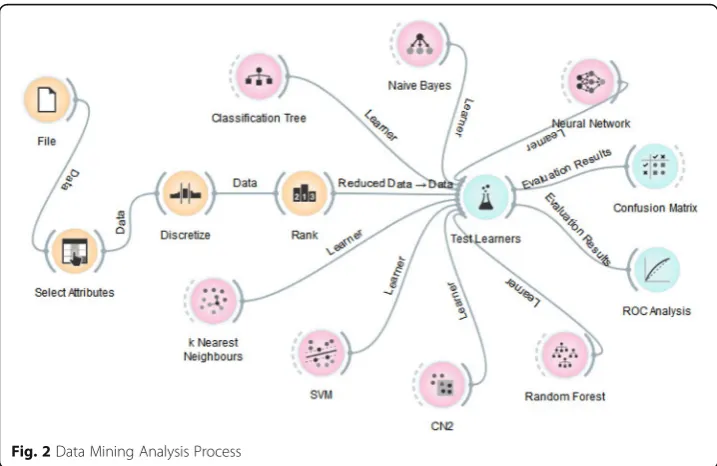
The classification analyses were carried out using the Orange data mining
soft-ware (Demšar et al., 2013) in accordance with the process provided in Fig. 2. The
whole set of interaction data was used within the scope of the first research ques-tion, whilst to answer the second reseach quesques-tion, classification models were established by obtaining data belonging to weeks 3, 6, 9, 12, and 14. When estab-lishing classification models in order to develop an early warning system, the algo-rithm and the pre-processing methods that produced the best outcomes in the first research question were taken into consideration.
Performance metrics
The performance metrics to compare the performance of classification algorithms are calculated over and displayed together in a confusion matrix where instances
classified correctly and incorrectly. A sample confusion matrix provided in Table 2
that belongs to a binary classification problem in the form of “Passed” and
“Failed” regarding the academic performance of students was used in the
explan-ation of performance metrics. Each row of the confusion matrix represents the instances of an actual class and each column represents the instances of a pre-dicted class.
Here:
TP (True Positive): The number of unsuccessful students that were classified as
“Failed”by the model.
TN (True Negative): The number of successful students that were classified as
“Passed”by the model.
FP (False Positive): The number of unsuccessful students that were classified as
“Passed”by the model.
FN (False Negative): The number of successful students that were classified as
“Failed”by the model.
The performance metrics according to this confusion matrix are calculated as below: Accuracy:The ratio of subjects that are accurately classified by the model to the total number of subjects and is calculated by the below-provided formula. In cases where class features are not distributed in a well-balanced way, the obtained results could be misleading. As such, it is not a sufficient criterion on its own to measure the perform-ance of the model.
Accuracy¼ TPþTN
TPþTNþFPþFN
Sensitivity: The probability of the model to classify “unsuccessful” students (Failed) correctly and is calculated according to the formula provided below. This metric is also called as Recall.
Sensitivity¼ TP
TPþFN
Specificity: The probability of the model to classify “successful” (Passed) students correctly and is calculated according to the formula provided below.
Specificity¼ TN
TNþFP
F-Measure: The use of sensitivity and specificity measures on their own could lead to the generation of biased comments in the evaluation of the models. The F-Measure, which is the harmonic average of sensitivity and specificity, uses the two metrics together.
Table 2Sample Confusion Matrix
Predictions
Failed Passed
Actual Values Failed TN FP
Passed FN TP
Table 3Analyses Conducted within the Scope of the First Research Question
No Pre-processing method Classification algorithm Performance metric
Results Data Transformation Feature Selection
1 None None Naive Bayes
Random Forest Support Vector Machines (SVM)
Classification Tree Neural Network CN2 Rules kNN
Accuracy Sensitivity Specificity F-Measure
Table4
2 Equal frequency None Table5
3 Equal width None Table6
4 Equal width Gain ratio Table7
5 Equal width Gini index Table8
F−Measure¼ 2TP
2TPþFPþFN
Results
Results regarding the first research question
Six analyses were carried out with the aim of determining which pre-processing methods and algorithm would best predict student success using the whole data set (See Table3, for details). In the first analysis, the classification performance was calcu-lated without subjecting the data to any kind of operation (base model) while in the second and third analyses, the effect of different data transformation techniques on classification performance was tested. In the three subsequent analyses, the effects of different feature selection techniques on classification performance was investigated. It must be noted that the same classification algorithms, performance metrics, and 5-fold cross validation method was used in all analyses.
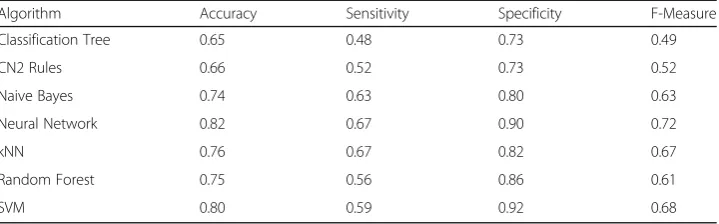
No changes were made to the features in the first analysis and all features were in-cluded in the analysis without undertaking any data transformation. The Neural Net-work algorithm reached the highest classification accuracy with a rate of 83%. The other algorithms exhibited performance rates of 65% and above (Table4).
The conducted analyses of results using the features established via the techniques of
equal frequency and equal width are provided in Tables 5 and 6, respectively. When
the performances of the data transformation methods were compared with the base model (Table 4), it was observed that the algorithms increased their classification per-formance in comparison to the based model in both data transformation methods (with the exception of SVM algorithm) (research question 1.1).
The use of the tree-based algorithms (Classification Tree and CN2 Rules) in-creased the classification accuracies by a range of 9% to 14% through the conver-sion of data into a categorical form. When comparing analyses conducted using the equal frequency and the equal width measure, the equal width technique exhib-ited a better performance in comparison to all algorithms in predicting students that failed (based on sensitivity metric).
Three different analyses were conducted to test which feature selection technique would produce the better outcome in the analysed data (research question 1.2). In the first analysis, the first ten features that received the highest scores according to the Gain ratio method were selected and performance metrics were calculated for all algorithms. In the second analysis, the first ten features that obtained the
Table 4Data Transformation: None, Feature Selection: None
Algorithm Accuracy Sensitivity Specificity F-Measure
Classification Tree 0.65 0.48 0.73 0.49
CN2 Rules 0.66 0.52 0.73 0.52
Naive Bayes 0.74 0.63 0.80 0.63
Neural Network 0.82 0.67 0.90 0.72
kNN 0.76 0.67 0.82 0.67
Random Forest 0.75 0.56 0.86 0.61
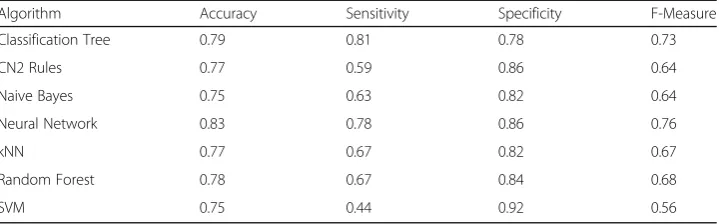
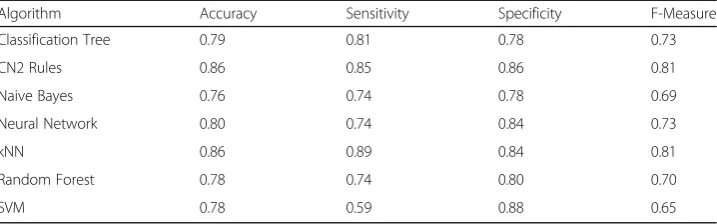
highest scores were selected according to the Gini index and the classification ana-lyses were repeated. Lastly, the ten features that received the highest score accord-ing to the SVM weight method were selected and the same analyses were repeated. The results of all three analyses are provided in Tables 7, 8, and 9. Features across all analyses were converted into categorical form according to the equal width method. The highest classification accuracy was reached by the CN2 Rules (86%) and kNN (86%) algorithms and feature selection technique made in accordance to the Gini index (Table 9).
Classification results using 10 features selected according to the Gini index
(Table 6) was more successful than the classification results using all of the
fea-tures (Table 8) (research question 1.3). When the results are compared with
re-spect to classification accuracies, the kNN and CN2 Rules algorithms increased their performance with a rate of 9%. On the other hand, there was a fall in the correct classification rate of the Neural Network algorithm by 3% and it was ob-served that the correct classification rates of other algorithms did not change. On the other hand, with the exception of the decision tree, it was observed that all al-gorithms increased their predictive power in cases where a fewer number of fea-tures were used.
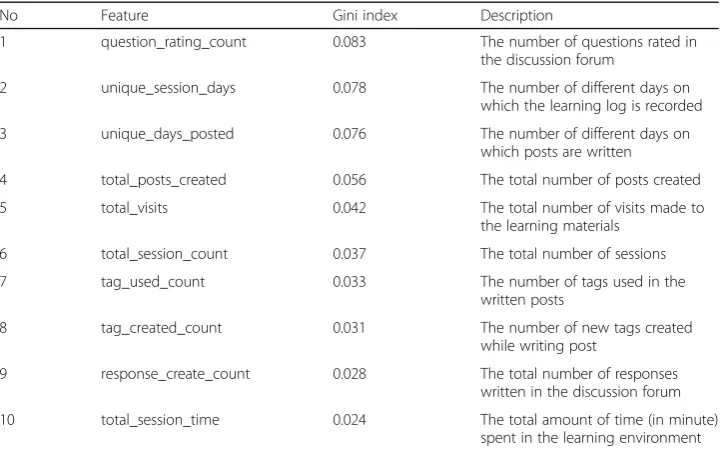
The best classification performance was obtained with features determined ac-cording to the Gini index. Upon examination of the features presented in
Table 10, the following features were observed to be the most important in
pre-dicting academic performance: the logging of students on the system (total_ses-sion_count), logging on different days (unique_session_days), the time spent in the system (total_session_time), their visits (total_visits), writing down posts about the concepts they learned (total_posts_created), their tagging of written messages by using the concepts they learned (tag_used_count), the formation of
Table 5Data Transformation: Equal Frequency, Feature Selection: None
Algorithm Accuracy Sensitivity Specificity F-Measure
Classification Tree 0.75 0.56 0.86 0.61
CN2 Rules 0.75 0.52 0.88 0.60
Naive Bayes 0.74 0.63 0.80 0.63
Neural Network 0.83 0.74 0.88 0.75
kNN 0.73 0.63 0.78 0.62
Random Forest 0.79 0.63 0.88 0.68
SVM 0.78 0.37 1.00 0.54
Table 6Data Transformation: Equal Width, Feature Selection: None
Algorithm Accuracy Sensitivity Specificity F-Measure
Classification Tree 0.79 0.81 0.78 0.73
CN2 Rules 0.77 0.59 0.86 0.64
Naive Bayes 0.75 0.63 0.82 0.64
Neural Network 0.83 0.78 0.86 0.76
kNN 0.77 0.67 0.82 0.67
Random Forest 0.78 0.67 0.84 0.68
new tags that will be used in order to tag posts (tag_created_count), the writing of messages at regular intervals (unique_days_posted), the writing of answers to questions in the discussion forum (response_create_count), and the evaluation of written questions (question_rating_count) (research question 1.4).
It was concluded that the best classification rate was reached using the kNN and CN2 Rules algorithms along with the condition in which the equal width
method and Gini feature selection technique was used (Table 8). The kNN
algo-rithm displayed a better performance in predicting unsuccessful students in com-parison to the CN2 algorithm and as such the progressive analyses were continued with the kNN algorithm. The confusion matrix for 5-fold cross
valid-ation derived via the kNN algorithm is provided in Table 11. The classification
model correctly predicted 24 out of 27 (89%) students that were failed at the end of term and 41 out of 49 (84%) students that were passed. On the contrary, it classified 8 students (16%) that were passed in reality as failed and classified 3 students (11%) that were failed in reality as passed.
Results regarding the second research question
In order to investigate whether the students with a high probability of failure at the end of term could be identified in the earlier weeks, the data belonging to weeks 3, 6, 9, and 12 were obtained from the database which contains the
stu-dents’ interaction data. The performance of the formed classification models was
compared with the classification model established using the whole data (week 14). Ten features selected in accordance with the Gini index and kNN algorithm with the highest classification performance in the first research question was used in all established models. The data was converted into categorical form using the equal
Table 7Data Transformation: Equal Width, Feature Selection: Gain Ratio
Algorithm Accuracy Sensitivity Specificity F-Measure
Classification Tree 0.76 0.78 0.76 0.70
CN2 Rules 0.80 0.81 0.80 0.75
Naive Bayes 0.80 0.81 0.80 0.75
Neural Network 0.82 0.74 0.86 0.74
kNN 0.83 0.78 0.86 0.76
Random Forest 0.78 0.67 0.84 0.68
SVM 0.78 0.59 0.88 0.65
Table 8Data Transformation: Equal Width, Feature Selection: Gini Index
Algorithm Accuracy Sensitivity Specificity F-Measure
Classification Tree 0.79 0.81 0.78 0.73
CN2 Rules 0.86 0.85 0.86 0.81
Naive Bayes 0.76 0.74 0.78 0.69
Neural Network 0.80 0.74 0.84 0.73
kNN 0.86 0.89 0.84 0.81
Random Forest 0.78 0.74 0.80 0.70
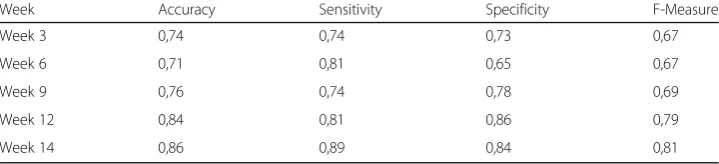
width method. The results regarding weeks 3, 6, 9, 12, and 14 with respect to the
determined performance metrics are provided in Table 12.
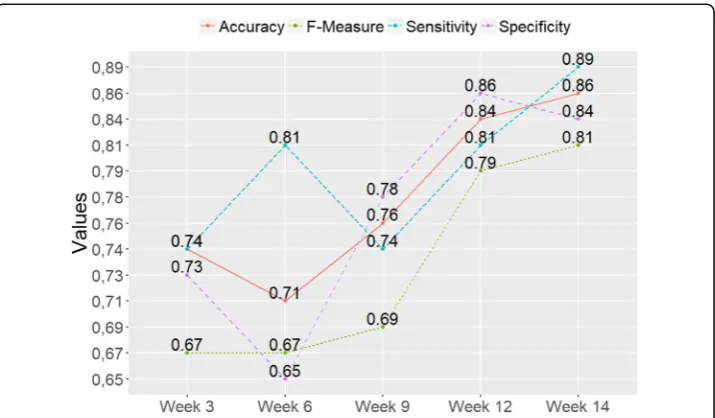
According to the results presented in Table 12and Fig. 3, the classification models
established with the exception of the 6th week, displayed an increasing trend with re-spect to the classification accuracy.
The model established through the data obtained in the 14th week classified
86% of students correctly, while the model established via the data obtained in
the 3rd week classified 74% of students correctly. In other weeks this ratio
fluctu-ated between 71% and 84%. Likewise, the value of the F-Measure, which is an in-dicator of the models to differentiate between successful and unsuccessful
students, followed a rising trend with the exception of the 6th week. In order to
gain a greater understanding into how the obtained classification models perform on a weekly basis, confusion matrices regarding classification models are provided in Table 13.
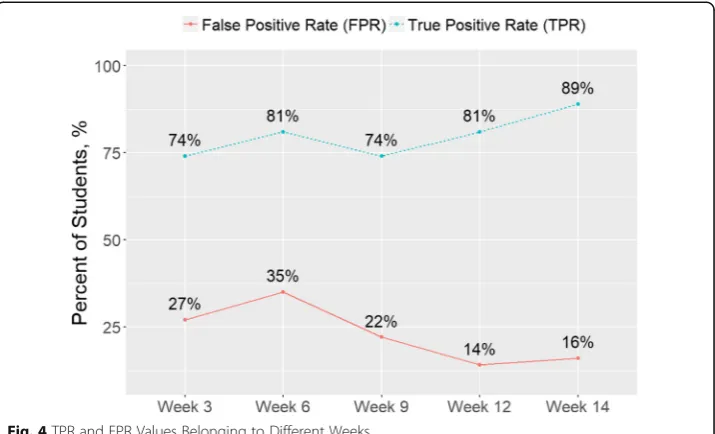
When this set of data (provided below in visual form in Fig. 4) was analysed, it
was observed that the classification models formed on a weekly basis correctly clas-sified 20 out of 27 (74%) unsuccessful students from week 3 onwards (TP value). In the last week, it classified 24 of them (89%) correctly. However, the
Table 9Data Transformation: Equal Width, Feature Selection: SVM Weights
Algorithm Accuracy Sensitivity Specificity F-Measure
Classification Tree 0.79 0.81 0.78 0.73
CN2 Rules 0.83 0.74 0.88 0.75
Naive Bayes 0.80 0.74 0.84 0.73
Neural Network 0.82 0.70 0.88 0.73
kNN 0.83 0.74 0.88 0.75
Random Forest 0.76 0.70 0.80 0.68
SVM 0.79 0.56 0.92 0.65
Table 10Important Features Determined According to the Gini Index and Explanations
No Feature Gini index Description
1 question_rating_count 0.083 The number of questions rated in the discussion forum
2 unique_session_days 0.078 The number of different days on which the learning log is recorded 3 unique_days_posted 0.076 The number of different days on
which posts are written
4 total_posts_created 0.056 The total number of posts created
5 total_visits 0.042 The total number of visits made to
the learning materials 6 total_session_count 0.037 The total number of sessions
7 tag_used_count 0.033 The number of tags used in the
written posts
8 tag_created_count 0.031 The number of new tags created while writing post
9 response_create_count 0.028 The total number of responses written in the discussion forum 10 total_session_time 0.024 The total amount of time (in minute)
interpretation of this value on its own could lead to mistakes as the model can classify some successful students as unsuccessful by mistake (False Positive-FP).
Upon examination of these values presented as FP in Table 13, it was observed
that the classification model formed in the 3rd week, classified 13 of the 49 (26%)
students that normally passed the subject as failed whilst this number dropped to 8 (16%) in the last week.
Discussion and conclusions
The current study aimed to develop a model that enables the prediction of
stu-dents’ end-of-term academic performance earlier in the course using interaction
data in an online learning setting. To that end, a two-stage analysis method was followed. In the first stage, the performance of the most widely cited classifica-tion algorithms in the literature were compared using the complete data set. At the same time, in the data pre-processing period, the impact of different tech-niques used for data transformation and feature selection known to have an effect on classification performance was tested. In the second stage, it was investigated whether the end-of-term performance of students could be predicted in earlier weeks using the selected algorithm, features, and data transformation techniques. At this stage, the performance of classification models formed with data obtained in weeks 3, 6, 9, 12, and 14 in predicting student academic performance was compared. Several performance metrics (e.g., Classification Accuracy, Sensitivity, Specificity, and F-Measure) were used in order to compare the performance of different classification models that were obtained. End-of-term scores in the Computer Hardware course were taken into consideration as an indicator of stu-dent academic performance, which was the target feature. Various features reflecting students' behaviour in the online learning setting were used to predict their end-of-term performance. The interaction of students in the learning setting was taken into consideration in the determination of these features. Academic
performance was coded in the form of “Passed” or “Failed”.
Table 11Confusion Matrix for the kNN Algorithm*
Failed Passed Total
Failed 24 3 27
Passed 8 41 49
Total 31 45 76
*The columns represent the predictions and the rows represent the actual values
Table 12Analysis Results Regarding Classification Models Established through Data Obtained in
Different Weeks
Week Accuracy Sensitivity Specificity F-Measure
Week 3 0,74 0,74 0,73 0,67
Week 6 0,71 0,81 0,65 0,67
Week 9 0,76 0,74 0,78 0,69
Week 12 0,84 0,81 0,86 0,79
The effect of data transformation on classification performance was tested in the analysis stage. All features were converted into a categorical form using the techniques of equal frequency and equal width. Results indicated that models formed with categorical data performed better than models formed with continu-ous data. On the other hand, when different data transformation methods are compared, it was observed that the equal width technique produced better out-comes in comparison to the equal frequency method. The conducted studies indi-cate that indi-categorical data give rise to better outcomes in comparison to
continuous data in classification analyses (Cristobal Romero, Espejo, et al., 2013).
At the same time, data converted into a categorical form may provide easier terpretation of obtained models by non-specialist individuals. Furthermore, it in-creases the reusability of the established models in different data sets, or, in other words, their generalizability.
Secondly, the impact of feature selection on classification performance was tested. For this purpose, the ten features which received the highest scores in ac-cordance with the three different feature selection methods (Gain Ratio, Gini Index and SVM Weight) and the performance of the classification models using
these features were compared with those that use all features (see Appendix).
The results indicated that the classification performances obtained with 10 fea-tures selected according to the Gini index method was higher than the
Fig. 3The Classification Performance of Early Warning Models with respect to Performance Metrics
Table 13Confusion Matrices Regarding Classification Models Formed through Data Obtained in
Different Weeks
Week TP FP TN FN
Week 3 20 13 36 7
Week 6 22 17 32 5
Week 9 20 11 38 7
Week 12 22 7 42 5
classification performances obtained through the use of all features. The feature selection method carries importance as it would enable the formation of predic-tion models through the use of a lower number of features. The use of a lower number of features means models that can be interpreted more easily.
Another intended purpose of the feature selection method is to gain an understand-ing of which features have the greatest impact on the structure (i.e. academic perform-ance) that needs to be predicted (Baker, R. S. J. d.,2010). When the findings relating to important features were examined, it was observed that features such as regular logging of students onto the learning setting, the participation in the discussion forum, doing homework on a weekly basis, reading, and evaluating the content written by other stu-dents came to the fore. These findings are consistent with other studies. For example, in a study conducted in the Moodle setting, Lopez et al. (2012) reached the conclusion that the participation of students in the discussion forum is a good predictor of their
success in lessons. Macfadyen and Dawson (2010) on the other hand established a
re-gression model in order to predict the success of students in lessons using the inter-action data in the Blackboard learning setting. It was found out that the most important feature in the model that would correctly predict a notable majority of stu-dents with the risk of failure was the number of posts sent to the discussion forum. The number of answers (response_create_count), which is an indicator of the participa-tion of students in the discussion forum, along with the number of evaluaparticipa-tions under-taken for the written questions (question_rating_count), became prominent as important features in the prediction of student performance.
Lavoué (2011) stated that the tagging feature used in online learning settings is im-portant in the learning of new concepts, the formation of relationships in between con-cepts, and in supporting the cognitive and social learning processes of students to help them see the reflections of their internal concepts. The tagging of the written content (tag_used_count) and the addition of new tags to the setting (tag_created_count) emerge as important features in the prediction of student performance in this study as well. The Computer Hardware course in which the study was carried out is identical in
that it is dominated by concepts and students are expected to learn 150–200 concepts throughout the semester. When examined from this aspect, the impact of features re-lating to tagging on academic performance was found to be important in encouraging the use of tagging in concept-dominated subjects. On the other hand, the regular logging-on of students in the setting and the time spent on it emerged as significant features. Akçapınar, Hasnine, Majumdar, Flanagan, and Ogata (2019), indicated the im-pact of logging onto learning settings regularly on academic success rather than carry-ing out many activities in one session.
In a comparison of the performances of classification algorithms developed using the complete data set, the highest level of classification accuracy was reached using the kNN and CN2 algorithms and under the condition in which data was converted into categorical form using the equal width method and important features selected accord-ing to the Gini index. Under these circumstances, the kNN and CN2 Rules algorithms classified 86% of students correctly while the other classification algorithms attained a classification accuracy of 76% and above. The classification model obtained with the kNN algorithm correctly predicted 24 of the 27 (89%) failed students at the end of term, and 41 out of 49 (84%) passed students. In contrast, it classified 8 students (16%) that were passed in reality as failed and classified 3 students (11%) that were failed in reality as passed.
In accordance with the findings obtained in the first stage, the classification models were formed with data that were obtained from weeks 3, 6, 9, 12, and 14. The results of the analysis indicated that the model established in the 3rdweek correctly classified 20 out of 27 (74%) failed students at the end of term but incorrectly classified 13 out of 49 (26%) students who passed the subject as failed. Error rates gradually declined in models that were formed from data obtained in the progressive weeks. This result was expected as the data regarding student interactions in the system increases as the weeks progress. Costa et al. (2017) reported that the prediction performance of algorithms in-creased notably when students had completed 50% of the subjects.
One of the most important aims of educational data mining and learning analyt-ics studies is to identify students with low performance and those experiencing problems and to provide the capability to change the behaviour underlying these conditions through timely interventions (Kimberly E. Arnold & Pistilli, 2012). Feed-back carries notable importance in the change of behaviour and the provision of instantaneous and individualised feedback to students is made possible through the
developments in educational technologies (Bienkowski, Feng, & Means, 2012;
Tanes, Arnold, King, & Remnet, 2011). The Signal project implemented by Purdue
University indicated that students perceive individualised feedback given in an
understandable format as positive (Bienkowski et al., 2012). The researchers used
the information obtained through data mining analysis for the purpose of providing feedback to students in their study and showed that this was effective in increasing
student success (K. E. Arnold, 2010). The prediction of unsuccessful students
through data obtained in a short time frame such as the 3rd week with a rate of
74% carries significance with respect to the prevention of possible failures. The mentioned data will gain teachers time to undertake pedagogical interventions
(Costa et al., 2017) and will help lower the failure rates when shared with the
Abbreviations
CART:Classification and Regression Tree; FN: False Negative; FP: False Positive; kNN: k-Nearest Neighbors; SVM: Support Vector Machines; TN: True Negative; TP: True Positive
Acknowledgements Not applicable.
Authors’contributions
GA drafted the initial manuscript and conducted the research. AA provided insight and editing of the manuscript. PA provided supervision of the research. All authors read and approved the final manuscript.
Funding Not applicable. Appendix
Table 14List of Extracted Features and their Descriptions
No Feature Category Description
1 total_session_count Session The total number of sessions
2 total_session_time Session The total amount of time (in minute) spent in the learning environment
3 unique_session_days Session The number of different days on which the learning log is recorded 4 total_visits Navigation The total number of visits made to the learning materials
5 content_visit Navigation The total number of visits made to the content pages 6 notification_visit Navigation The total number of visits made to the notification page 7 announcement_visit Navigation The total number of visits made to the announcement page 8 post_visit Navigation The total number of visits made to the post page
9 discussion_visit Navigation The total number of visits made to the discussion page 10 total_posts_created Post The total number of posts created
11 post_writing_time Post The average amount of time (in second) spent for writing posts 12 unique_days_posted Post The number of different days on which posts are written 13 tag_created_count Post The number of new tags created while writing post 14 tag_used_count Post The number of tags used in the written posts
15 copy_paste_count Post The number of times using copy & paste while writing posts 16 keystroke_count Post The average number of keystroke made by the student while writing
a post
17 backspace_count Post The average number of backspace key used by the student while writing a post
18 out-of-focus_count Post The average number of times the page lost focus while writing a post 19 post_open_count Post The number of posts opened
20 comment_created_ count
Post The number of comments created
21 post_rating_count Post The number of post rated 22 comment_rating_
count
Post The number of comments rated
23 response_create_ count
Discussion The total number of responses written in the discussion forum
24 response_open_ count
Discussion The total number of times to open responses in the discussion forum
25 response_rating_ count
Discussion The number of responses rated in the discussion forum
26 question_rating_ count
Availability of data and materials
The datasets used and/or analyzed during the current study are available from the corresponding author on reasonable request.
Competing interests
The authors declare that they have no competing interests.
Received: 22 July 2019 Accepted: 2 October 2019
References
Akçapınar, G., Çoşgun, E., & Altun, A. (2013, October 17th - 18th).Mining Wiki Usage Data for Predicting Final Grades of
Students.Paper presented at the International Academic Conference on Education, Teaching and E-learning (IAC-ETeL
2013), Prague, Czech Republic.
Akçapınar, G., Hasnine, M. N., Majumdar, R., Flanagan, B., & Ogata, H. (2019). Developing an early-warning system for spotting at-risk students by using eBook interaction logs.Smart Learning Environments,6(4), 1–15.https://doi.org/ 10.1186/s40561-019-0083-4.
Arnold, K. E. (2010). Signals: Applying academic analytics.Educause Quarterly,33(1) Retrieved fromhttp://www.educause.edu/ ero/article/signals-applying-academic-analytics.
Arnold, K. E., & Pistilli, M. D. (2012). Course signals at Purdue: Using learning analytics to increase student success. Paper presented at the proceedings of the 2nd international conference on learning analytics and knowledge, Vancouver, British Columbia, Canada.
Baker, R. S. J. d. (2010). Data Mining. In International encyclopedia of education(Third Edition)(pp. 112–118). Oxford: Elsevier. Bienkowski, M., Feng, M., & Means, B. (2012). Enhancing teaching and learning through educational data mining and learning
analytics: An issue brief. Retrieved from Washington, D.C.:
Campbell, J. P., DeBlois, P. B., & Oblinger, D. G. (2007). Academic analytics: A new tool for a new era.Educause
Review,42(4), 40.
Chatti, M. A., Dyckhoff, A. L., Schroeder, U., & Thüs, H. (2012). A reference model for learning analytics.International Journal of
Technology Enhanced Learning,4(5), 318–331.https://doi.org/10.1504/IJTEL.2012.051815.
Costa, E. B., Fonseca, B., Santana, M. A., de Araújo, F. F., & Rego, J. (2017). Evaluating the effectiveness of educational data mining techniques for early prediction of students' academic failure in introductory programming courses.Computers in
Human Behavior, 73(supplement C), 247-256. doi:https://doi.org/10.1016/j.chb.2017.01.047
Demšar, J., Curk, T., Erjavec, A., Gorup,Č., Hočevar, T., Milutinovič, M.,…Zupan, B. (2013). Orange: Data mining toolbox in python.Journal of Machine Learning Research,14(1), 2349–2353.
Dougherty, J., Kohavi, R., & Sahami, M. (1995). Supervised and unsupervised discretization of continuous features.Paper presented at the ICML.
Gašević, D., Dawson, S., Rogers, T., & Gasevic, D. (2016). Learning analytics should not promote one size fits all: The effects of instructional conditions in predicting academic success.The Internet and Higher Education,28, 68–84.https://doi.org/10. 1016/j.iheduc.2015.10.002.
Han, J., Kamber, M., & Pei, J. (2006).Data Mining: Concepts and Techniques, Second Edition (The Morgan Kaufmann Series in
Data Management Systems): Morgan Kaufmann.
Hu, Y.-H., Lo, C.-L., & Shih, S.-P. (2014). Developing early warning systems to predict students’online learning performance.
Computers in Human Behavior,36, 469–478.https://doi.org/10.1016/j.chb.2014.04.002.
Johnson, L., Smith, R., Willis, H., Levine, A., & Haywood, K. (2006). The 2011 horizon report. Austin, Texas: The new media consortium, 2011. In.
Lavoué, É. (2011). Social Tagging to Enhance Collaborative Learning. In H. Leung, E. Popescu, Y. Cao, R. H. Lau, & W. Nejdl (Eds.),Advances in Web-Based Learning - ICWL 2011(Vol. 7048, pp. 92–101): Springer Berlin Heidelberg.
Lopez, M. I., Luna, J. M., Romero, C., & Ventura, S. (2012). Classification via clustering for predicting final marks based on student participation in forums. Paper presented at the 5th international conference on educational data mining, EDM 2012, Chania, Greece.
Macfadyen, L. P., & Dawson, S. (2010). Mining LMS data to develop an“early warning system”for educators: A proof of concept.Computers & Education,54(2), 588–599.https://doi.org/10.1016/j.compedu.2009.09.008.
Osmanbegović, E., & Suljić, M. (2012). Data mining approach for predicting student performance.Economic Review,10(1). Peña-Ayala, A. (2014). Educational data mining: A survey and a data mining-based analysis of recent works.Expert Systems
with Applications, 41(4, part 1), 1432-1462. doi:https://doi.org/10.1016/j.eswa.2013.08.042
Piramuthu, S. (2004). Evaluating feature selection methods for learning in data mining applications.European Journal of
Operational Research,156(2), 483–494.https://doi.org/10.1016/S0377-2217(02)00911-6.
Pretnar, A. (2019). The Mystery of Test & Score. Retrieved from http://orange.biolab.si/blog/2019/1/28/the-mystery-of-test-and-score/
Ribeiro, M. X., Traina, A. J. M., & Caetano Traina, J. (2008).A new algorithm for data discretization and feature selection. Fortaleza, Ceara, Brazil: Paper presented at the Proceedings of the 2008 ACM symposium on applied computing. Romero, C., Espejo, P. G., Zafra, A., Romero, J. R., & Ventura, S. (2010). Web usage mining for predicting final marks of
students that use Moodle courses.Computer Applications in Engineering Education, n/a-n/a.https://doi.org/10.1002/ cae.20456.
Romero, C., Espejo, P. G., Zafra, A., Romero, J. R., & Ventura, S. (2013). Web usage mining for predicting final marks of students that use Moodle courses.Computer Applications in Engineering Education,21(1), 135–146.https:// doi.org/10.1002/cae.20456.
Romero, C., Olmo, J., & Ventura, S. (2013).A meta-learning approach for recommending a subset of white-box classification
algorithms for Moodle datasets.Paper presented at the 6th International Conference on Educational Data Mining (EDM
Romero, C., Ventura, S., Hervás, C., & Gonzales, P. (2008).Data mining algorithms to classify students. Paper presented at the Proc. Data Mining, Montreal: Int. Conf. Educ.
Tanes, Z., Arnold, K. E., King, A. S., & Remnet, M. A. (2011). Using signals for appropriate feedback: Perceptions and practices.
Computers & Education,57(4), 2414–2422.https://doi.org/10.1016/j.compedu.2011.05.016.
Publisher’s Note