Chinazzi et al.EPJ Data Science (2019) 8:33 https://doi.org/10.1140/epjds/s13688-019-0210-z
R E G U L A R A R T I C L E
Open Access
Mapping the physics research space:
a machine learning approach
Matteo Chinazzi
1*, Bruno Gonçalves
2, Qian Zhang
1and Alessandro Vespignani
1*Correspondence:
1MOBS Lab, Northeastern
University, Boston, USA Full list of author information is available at the end of the article
Abstract
Scientific discoveries do not occur in vacuum but rather by connecting existing pieces of knowledge in new and creative ways. Mapping the relation and structure of scientific knowledge is therefore central to our understanding of the dynamics of scientific production. Here we introduce a new approach to generate scientific knowledge maps based on a machine learning approach that, starting from the observed publication patterns of authors, generates anN-dimensional space where it is possible to measure the similarity or distance between different research topics and knowledge domains. We provide an implementation of the proposed approach that considers the American Physical Society publications database and generates a map of theresearch spacein Physics that characterizes the relation among research topics over time. We use this map to measure two indicators, theresearch capacity fingerprint
and theknowledge density, to profile the research activity in physical sciences of more than 400 urban areas across the world. We show that these indicators can be used to analyze and predict the evolution over time of the research capacity and
specialization of specific geographical areas. Furthermore we provide an extensive analysis of the relation between socio-economic development indicators and the ability to produce new knowledge for 67 countries, as measured by our approach, highlighting some key correlates of scientific production capacity. The proposed approach is scalable to very large datasets and can be extended to study other disciplines and research areas without having to rely on ad-hoc science classification schemes.
Keywords: Embeddings; Research space; Principle of relatedness; Fingerprinting scientific production; Revealed comparative advantage; Predicting research specialization
1 Main text
of memory and attention [8–10], and measure the emergence and relevance of interdis-ciplinary efforts [11–14]. Considerable progress has been made also in the study of the mobility of researchers both in space and among research topics [15–22] and in the char-acterization and explanation of collaboration dynamics between individual researchers, institutions, and countries [23–34]. Remarkably, the advances in the field have opened the path to the understanding and prediction of scientific productivity and individual re-searchers’ careers [35–41]. In this context, the visualization and mapping of the research space is a major tool in the study of the scientific portfolio of authors, institutions, and countries, the co-production of bibliographic items, and the quantitative characterization of similarity between scientific topics [3,4,42–47].
One of the hurdles in defining large-scale knowledge maps is that the approaches pro-posed in the literature typically rely on well defined scientific taxonomies. Indeed, it has been shown that it takes a non-trivial effort to analyze the evolution of trending topics in science when only keywords are used rather than well established classification schemes [5]. Here, we propose a new methodology that uses recent developments stemming from the Natural Language Processing (NLP) machine learning literature on word embeddings [48–54] to create aspatial mappingof the research space of scientific disciplines. In this space, scientific topics are represented usingN-dimensional vectors, and the similarity among topics can be organically computed as theirspatial closenessin thisN-dimension space. We apply our methodology to articles published in American Physical Society’s (APS) journals in the period 1986–2009 to generate a map of the physics research space, and show that our method correctly reproduces the scientific structure encoded within the Physics and Astronomy Classification Scheme (PACS). Indeed, while the research topics are labeled according to the latter, our method does not use the hierarchical structure embedded into the PACS scheme tolearnthe physics research space. Rather, we use the structure of the classification scheme as a ground truth to validate our findings, showing that our methodology does not require the a-priori existence of a well-defined scientific or technical taxonomy to produce a meaningful knowledge space.
schol-Chinazzi et al.EPJ Data Science (2019) 8:33 Page 3 of 18
arly/bibliometric databases, thus opening the path to the definition of knowledge maps not relying on pre-defined taxonomies or classification schemes.
2 Results
The core assumption behind our approach is that research topics can be simply char-acterized by sets of keywords extracted from individual publications, patents, and other scientific artifacts. The relations among scientific areas are generally provided by mea-sures of similarity among the research topics, inferred from co-occurrences of keywords in papers, citations, or other bibliographic indicators. Common approaches range from co-word similarity, to citation linkages, or more sophisticated vector space models [42,
55,56].
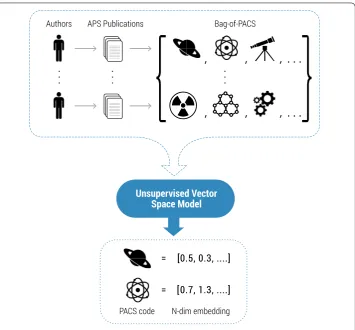
In our case, to extract the labels that we are going to use to identify the research top-ics, we consider all the articles published in American Physical Society’s (APS) journals in the period 1986–2009 and we associate to each article: (a) a set of authors; and (b) a set of research topics identified using the Physics and Astronomy Classification Scheme (PACS) codes reported in each publication. Given this data, we select the scientific output of each author by keeping track of all the research topics, identified by the PACS codes, in which she/he has published on in a given time window. Then, we represent each scientist as abag-of-topicsand we use this information to train our embedding model and recover the vector embeddings for each PACS code (as shown in Fig.1). In the machine learning literature, supervised and unsupervised vector space models have been used to perform exactly this task: embed words in a high dimensional space in which semantically similar words are mapped into neighboring points. Here, we use the general-purpose embedding approach proposed by [54] to map research topics (i.e. PACS codes) into aresearch space
in which scientifically similar topics are placed close to each other. The motivation behind this methodology lies in theprinciple of relatedness[57,58]: i.e. it is easier to specialize and work inrelatedresearch areas requiring a set of common skills/knowledge. Each in-dividual is thus assumed to have a given set of skills/knowledge which allow her/him to successfully publish in a specific set of topics. The embedding vector space model is then trained to learn the similarity of topics by analyzing thebag-of-topicsof all the authors in our dataset.
Figure 1Embedding of research topics. We consider the articles published in American Physical Society’s (APS) journals and we associate to each manuscript: a set of authors and a set of research topics (PACS codes). Then, we represent each scientist as abag-of-topicsand we use this information to train our embedding model and recover the vector embeddings for each topic
(at the author level) are exploited to tune the embeddings so that frequently occurring pairs-of-topics are also close in theN-dimensional embedding space.
2.1 From the embedding space to the research space network
The embedding of topics into a high dimensionalresearch spaceallows us to use their spatial positions to infer the value of their pairwise similarities by measuring the topics relativecloseness. In particular, the topic vector space can be used to compute the similarity between two research topics as the cosine similarity between their vectors:
φti,j= vec
t i·vectj
vecti vectj, (1)
wherevect
iandvectjare the 200-dimensional embeddings for topicsiandj, respectively.
taxon-Chinazzi et al.EPJ Data Science (2019) 8:33 Page 5 of 18
Figure 2Research space network. Each node represents a research topic in Physics, identified by a PACS code,
and each edge is weighted by the level of similarity between research topics. Nodes are colored according to their membership to the ten macro-sections of the PACS 2010 classification scheme. Only the most relevant connections are shown
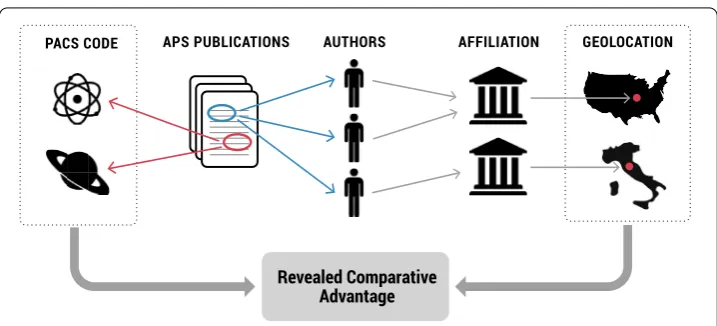
Figure 3Data representation. Papers are geo-localized using authors’ affiliation information, while research topics correspond to the PACS codes reported in each article. For each geographical unit and location pair, the revealed comparative advantage (RCA) is computed to generate location-specific specialization profiles that allow us tofingerprintthe structure of the scientific production system of each urban area
2.2 Fingerprinting scientific expertise
Research activities in the context of the research space can be analyzed at different ge-ographical scales. More precisely, we canfingerprintscientific production at the level of individual authors, institutions, cities, or countries by geolocating scientific publications (Fig.3). This can be achieved by considering all the articles published in American Physical Society’s (APS) journals in the period 1986–2009 and by associating to each publication: (a) the information contained in the authors’ affiliation; and (b) the set of research topics (i.e. the PACS codes) used in the paper. In the following, we focus on geographical units constructed by first parsing the city names from the affiliation strings for each article, and then clustering together neighboring cities to obtain distinct urban areas. More specifi-cally, we follow the same procedure used in [60]: first, we infer the country in which each affiliation-city pair is located; second, for each country, we compute a geographic distance matrix (using Vicenty’s formula) connecting each pair of cities; and lastly we use hierar-chical clustering to define the different urban areas with the additional constraint that the maximum distance within each cluster has to be less than 50 km. Once we have the ge-ographical units defined, we count how many publications have been produced in each PACS code by each distinct urban area.
In order to provide a specific fingerprinting for the degree of specialization of each geo-graphical unit we extend to scientific production [47] the concept ofRevealed Compara-tive Advantage(RCA, [61]). RCA has a long history in the economic literature where it has been used to study the level of specialization of nations and regions in terms of industrial production, technological production, and trade exports (see for example [62–75]). The RCA [61] is defined as:
RCAtc,k= X
t c,k/
kXct,k
cXct,k/
c,kXct,k
, (2)
whereXt
c,k denotes the number of publications produced in urban areacin PACS code
Chinazzi et al.EPJ Data Science (2019) 8:33 Page 7 of 18
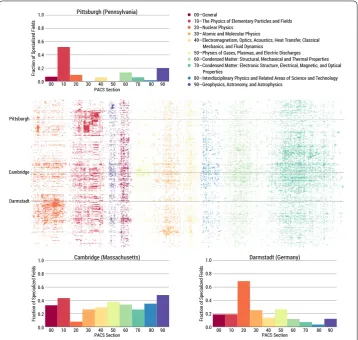
Figure 4Fingerprinting knowledge production profiles. Each row represents an urban area, each column a PACS
code, and each colored dot indicates that a given location has a revealed comparative advantages in the production of papers in a given PACS code in the time window 2007–2009. Colors identify the ten different PACS Sections. Separate bar charts are reported for three cities showing the fraction of PACS codes in which the city has a revealed comparative advantage over the total number of PACS codes in that section
percentage share of papers published in PACS codekacross the world. By comparing these two figures, we can assess whether a given geographical unit is relatively more specialized in a certain research topic.
By using the above definition, we consider a geographical unit to be aspecialized sci-entific producerin PACS codekat timetifRCAtc,k> 1. Using the RCA, we can generate location-specific specialization profiles that allow us tofingerprintthe structure of the sci-entific production system of each geographical area. In particular, we can create a (time varying) fingerprint matrixFck, wherecis a geographical unit andkis a topic, and
as-sign non-zero entries only ifRCAtc,k> 1. We can visualize the matrixFck to have a
of Elementary Particles and Fields(PACS section 10) while its specialization inNuclear Physicsis particularly low. Lastly, we observe that Cambridge is the only city among the three considered with a more homogenous pattern of specialization (with the exception ofNuclear Physics). Overall, by looking at Fig.4, we can start to appreciate how different cities might cluster their scientific expertise around distinct areas of the research space, even though exceptions—as in the case of Cambridge—do exist.
2.3 Knowledge density and the prediction of scientific specialization
The RCA in the context of the research space has been introduced by Guevara et al. [47] to explore theprinciple of relatedness[57,58,76] in the process of scientific production: i.e. it is easier to specialize and work in relatedresearch areas requiring a set of com-mon skills/knowledge. Indeed, relatedness has been found to play an important role in explaining the patterns of future development of industries and research production at the level of cities, regions, and nations [47,57,77–83]. This is due to the fact that different sets of capabilities and skills might be needed to grasp the depth and complexity of dif-ferent research topics, therefore affecting the ability of researchers to move and develop a competitive edge across different disciplines. This observation builds upon the idea that
congnitive proximity[84,85] is required to successfully absorb and use new knowledge [86].
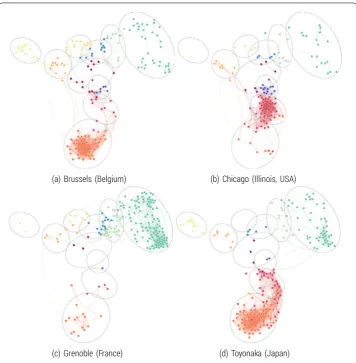
Our analysis provides support to the principle of relatedness and the fingerprint matrix shows patterns of specialization that are indeed not random. Some of these patterns can be appreciated in Fig.5where we plot each PACS code in which a city has a compara-tive advantage using the spatial coordinates identified using the research space mapping. Also in this case, we can appreciate how spatial ontologically consistent clusters of com-petences emerge. In other words, it appears that urban areas tend to develop around their currentdomain of expertiseimplying that scientific relatedness does play a role in explain-ing the structure of knowledge production of a city. In order to quantify the relatedness of a specific PACS code to the overall domain of expertise of a given geographical unit, we use theknowledge density(as proposed in [57]). The knowledge densityωti,caround PACS codeiin urban areacat timetis defined as:
ωti,c=
{ks.t.RCAtc,k>1 andφti,k>0}φti,k
{js.t.φti,j>0}φit,j
, (3)
whereφi,jis the level of knowledge similarity between PACS codesiandj. In our case,
we use cosine similarity to measure the similarity between two research topics. Given this definition, for a locationcand time windowt, the closer topiciis to other topics in which
chas a relative comparative advantage, the higher its knowledge density. To understand how this metric works, let us consider what happens when the index—which varies be-tween zero and one—takes its extreme values. For a given PACS codeiand urban areac
combination, the value ofωti,cis equal to zero ifchas no comparative advantages in topics related toi; while it has a knowledge density equal to one if it has an advantage in all the topics related toi. In other words, the closer isito the current domain of expertise ofc, the denser the knowledge space will be around PACS codei.
Chinazzi et al.EPJ Data Science (2019) 8:33 Page 9 of 18
Figure 5Fingerprints and research space. Specialization in the Physics research space networks of four
different cities showing only the PACS codes in which the urban areas exhibit a revealed comparative advantage in the period 2007–2009. Colors identify the ten different PACS sections as in Fig.4
of a PACS code. We look at the distributions ofωit,cwhen: (1) a PACS code that is inactive (i.e.RCA= 0) at timet– 1, remains inactive at timet; (2) a PACS code that is inactive at timet– 1 becomes active but with no comparative advantage (i.e. 0 <RCA≤1) by the city at timet(i.e. inactive to active but not specialized); (3) a PACS code remains active but with no comparative advantage by the city at botht– 1 andt(i.e. remained not spe-cialized); and lastly (4) a PACS code that is active but with no comparative advantage by the city at timet– 1, while a comparative advantage (i.e.RCA> 1) emerges at timet(i.e. from not specialized to specialized). Looking at these distributions we observe that PACS codes that normally remain inactive are the ones in which the knowledge density at the previous time step was the lowest, while the opposite holds for the codes in which ur-ban areas become specialized (a visualization of the results is reported in the swarm plot in Fig.6). In other words, it is easier to develop a stronger comparative advantage in re-search topics that are related—in the rere-search space—to the ones in which a location is already specialized in.
Figure 6Predicting specialization.Top panel: In the swarm plot every dot represents a PACS code-city pair where the time period is reported onx-axis, the observed level of knowledge density on they-axis, and the transition type is identified the color of the dot. From this representation we observe that urban areas tend to develop quicker in activities around which their knowledge density was higher.Bottom panel: The boxplot represents the distribution of the values of the area under the ROC curve when knowledge density is used to predict urban scientific specialization. Values of accuracy greater than 50% imply a better predictive power than a model assuming random specialization patterns
Chinazzi et al.EPJ Data Science (2019) 8:33 Page 11 of 18
the knowledge densityωti,c can be evaluated using a statistic which is normally used in the machine-learning community to measure the accuracy of a model: the area under the so-called Receiver Operating Characteristic (ROC) curve. The ROC curve is used to plot the true negative rate of a model (for example of a classifier) against its true positive rate. That is, the share of correctly classified negative values against the share of correctly clas-sified positive values. If the value of the area under the ROC curve is greater than 50%, then the accuracy of our prediction using the knowledge density is greater than the one we would have from a random prediction where PACS would not have been ranked by their knowledge density. In our case, we actually have a distribution of such values since—for a given time period—we can compute the accuracy of our model for each geographical unit. In other words, we test our ability to predict the research trajectories of each city in each distinct time window. The results, reported in Fig.6, show that the accuracy is higher than 50%, confirming that the structure of the research space can be used to predict how research trajectories evolve over time. While beyond the scope of the presented work, it is possible to envision the use of current estimate of the knowledge density to forecast the physics research areas in which specific urban areas will be able to specialize in future years.
3 Discussion
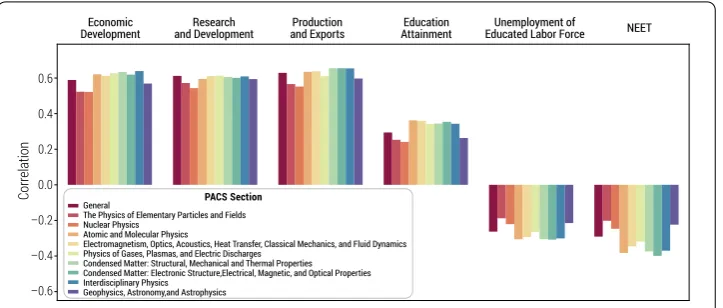
The construction of the physics research space by embedding topics in a high-dimensional space allows the fingerprinting of the patterns of specialization of urban areas, and the pre-diction of the evolution of cities’ patterns of specialization across different research topics, providing additional support to the principle of relatedness [57,58,76]. However, the ob-served level ofscientific capacity, as characterized by the value of the knowledge density, varies considerably in relation to the socio-economic status of each specific geographical areas. To highlight this aspect, we zoom-out and repeat the same exercise we performed for urban areas at the level of countries and we compute the overall average knowledge density of each nation across all PACS sections and for each PACS section. Then, we use the measured average knowledge density to study the association of this measure of na-tional scientific competence with several World Development Indicators (WDI) [87] that quantify the socio-economic status of the countries under analysis. In Fig.7we report an example of the associations found for 67 countries. This set of countries represents ap-proximately 99%of the total publications in our dataset. In Table1we show a summary of the results for all WDI considered, and in Fig.8we report the average correlation for each indicator category broken down by PACS section. This correlation analysis suggests that the most advanced countries—in terms of scientific expertise in Physics—are also the ones with the higher share of production and export of high-tech goods, the higher levels of investment in R&D, the higher levels of production of measurable innovation outcomes (e.g. patent, industrial design, and trademark applications), the higher levels of educational attainment and—at the same time—the lower levels of unemployment of skilled labor. Overall, this picture shows that economic development goes hand in hand with a high value of (average) knowledge density, thus supporting the key role of scientific production in the economic growth of nations.
Figure 7Knowledge density, R&D, and exports. Relation between the average knowledge density of a country in the last time window of our sample (2007–2009) with its level of expenditure in research and development reported as a fraction of the gross domestic product (GDP) and with its level of trade in medium and high-tech products reported as a fraction of its manufactured exports
and space. Furthermore we relied on the Physics and Astronomy Classification Scheme to assign topics to articles, thus constraining the research space to a pre-defined taxonomy. The PACS scheme was however used for the sake of comparing with previous results in the literature, and the proposed approach does not have to be limited to research in Physics, but it can be extended to other disciplines. In order to overcome the above limitations the embeddings can be produced by simply analyzing the text of paper titles and abstracts without any a-priori knowledge of a scientific topic classification and extending the anal-ysis to databases including a wider range of scientific disciplines, ranging from Physics and Engineering to Economics and Philosophy. The proposed approach might also help address the problem of dealing with the bursty behavior [5] of author-defined keywords. Indeed, even short-lived labels can be put in relation to more stable scientific topics since both sets of keywords will live in the sameN-dimensional embedding.
Chinazzi et al.EPJ Data Science (2019) 8:33 Page 13 of 18
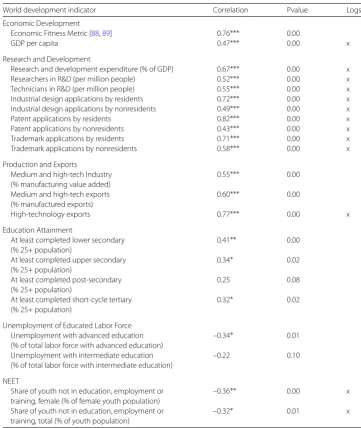
Table 1 Knowledge density and world development indicators
World development indicator Correlation Pvalue Logs
Economic Development
Economic Fitness Metric [88,89] 0.76∗∗∗ 0.00
GDP per capita 0.47∗∗∗ 0.00 x
Research and Development
Research and development expenditure (% of GDP) 0.67∗∗∗ 0.00 x
Researchers in R&D (per million people) 0.52∗∗∗ 0.00 x
Technicians in R&D (per million people) 0.55∗∗∗ 0.00 x
Industrial design applications by residents 0.72∗∗∗ 0.00 x
Industrial design applications by nonresidents 0.49∗∗∗ 0.00 x
Patent applications by residents 0.82∗∗∗ 0.00 x
Patent applications by nonresidents 0.43∗∗∗ 0.00 x
Trademark applications by residents 0.71∗∗∗ 0.00 x
Trademark applications by nonresidents 0.58∗∗∗ 0.00 x
Production and Exports
Medium and high-tech Industry (% manufacturing value added)
0.55∗∗∗ 0.00
Medium and high-tech exports (% manufactured exports)
0.60∗∗∗ 0.00
High-technology exports 0.77∗∗∗ 0.00 x
Education Attainment
At least completed lower secondary (% 25+ population)
0.41∗∗ 0.00
At least completed upper secondary (% 25+ population)
0.34∗ 0.02
At least completed post-secondary (% 25+ population)
0.25 0.08
At least completed short-cycle tertiary (% 25+ population)
0.32∗ 0.02
Unemployment of Educated Labor Force Unemployment with advanced education (% of total labor force with advanced education)
–0.34∗ 0.01
Unemployment with intermediate education (% of total labor force with intermediate education)
–0.22 0.10
NEET
Share of youth not in education, employment or training, female (% of female youth population)
–0.36∗∗ 0.00 x
Share of youth not in education, employment or training, total (% of youth population)
–0.32∗ 0.01 x
∗p< 0.05,∗∗p< 0.01,∗∗∗p< 0.001.
Description: Correlation analysis between the average knowledge density aggregated at the country level and a selection of World Development Indicators (WDI) [87].
Figure 8Knowledge density and development indicators. Correlation between the average knowledge density of a country in the period 2007–2009 computed for each one of the ten PACS sections and each
development indicator category as introduced in Table1
countries have in the production of science could be analyzed in aScience Spacewhich could include topics and keywords in any language.
4 Methods
4.1 Data
In our analysis, we use theAPS Data for Research(2010 release) data collection which comprises information about more than 400,000 articles published by the American Phys-ical Society. In particular, in this work, we limit our attention to the years 1986–2009 and we perform our analysis dividing our sample in 3-years non-overlapping time windows. However, the results we provide are robust with respect to the exact choice of the time window size and on whether or not overlapping intervals are considered. Papers are geo-located parsing the information contained in the authors affiliations following the proce-dure detailed in [60], authors are disambiguated following the procedure detailed in [94], while research topics are assigned considering the first 6 digits of the PACS classification scheme [59]. Overall, our dataset includes 2307 urban areas and 5800+ PACS codes. How-ever, in our analysis, we restrict our attention to cities that have at least 6 publications in each time window. This restricts our original sample to 402 urban areas and 854 PACS codes.
4.2 Embedding model
Chinazzi et al.EPJ Data Science (2019) 8:33 Page 15 of 18
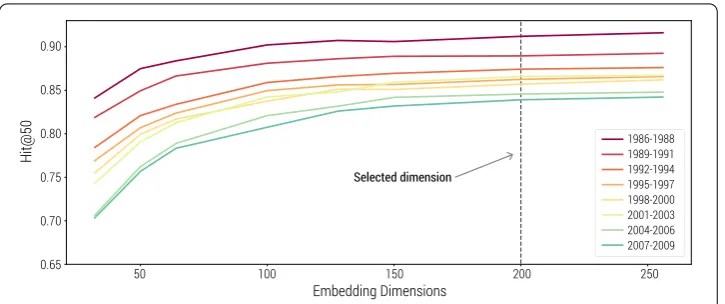
Figure 9Embedding model performance. Values of the performance metrichits@k[96] fork= 50. This shows
how the performance of the embedding model varies with the size of the embedding dimensionN
minimizes the following loss function:
(a,b)∈E+ b–∈E–
Lbatchsim(a,b),sima,b–1, . . . ,sima,b–k, (4)
whereE+denotes the set of positive entity pairs (i.e. PACS that often appear together), E–denotes the set of negative entity pairs (i.e. PACS that rarely appear together),κ= 50
is the number of negative pairs used for each batch update (i.e., this model uses a K -negative sampling strategy as in [50]),sim(·) denotes the cosine similarity between two embeddings, andLbatchdenotes the batch specific loss function that compares the
pos-itive pair (a,b) with the negative pairs (a,b–
i) using a margin ranking loss of the form max(0,μ–sim(a,b) +i∈[1,κ](a,b–
i)). The loss function is then minimized using
stochas-tic gradient descent [95]. The value ofNhas been chosen after examining the prediction performance of our model when trying to reconstruct thebag-of-topicsof the authors. In particular, we computed the percentage of correctly predicted PACS codes in the topk
predictions made by the algorithm. This metric is commonly denoted byhit@k[96] and it is the same performance metric used also in [54]. In Fig.9we show how its value varies with the size of the embedding dimensionN andk= 50. In light of this analysis, we de-cided to setN equal to 200 since it provided a good compromise between the training time required to fit the model and its overall prediction quality.
Acknowledgements
This work has been partially supported by Air Force Office of Scientific Research grant FA9550-15-1-0077. We acknowledge the American Physical Society for providing access to the publication data.
Abbreviations
APS, American Physical Society; PACS, Physics and Astronomy Classification Scheme; RSN, research space network; RCA, Revealed Comparative Advantage; ROC, Receiver Operating Characteristic.
Availability of data and materials
Access to the original APS Data Sets for Research can be requested at the following webpage: https://journals.aps.org/datasets. The source code for StarSpace model [54] can be accessed at
https://github.com/facebookresearch/StarSpace. Additional data and codes can be made available upon request to the authors.
Competing interests
Authors’ contributions
MC and AV designed research; MC, BG, QZ performed research; MC, BG, AV, and QZ analyzed data; and MC, BG, AV, and QZ wrote the paper. All authors read and approved the final manuscript.
Author details
1MOBS Lab, Northeastern University, Boston, USA.2Institute for Scientific Interchange Foundation, Torino, Italy.
Publisher’s Note
Springer Nature remains neutral with regard to jurisdictional claims in published maps and institutional affiliations.
Received: 21 November 2018 Accepted: 30 September 2019
References
1. Zeng A, Shen Z, Zhou J, Wu J, Fan Y, Wang Y, Stanley HE (2017) The science of science: from the perspective of complex systems. Phys Rep 714–715:1–73
2. Fortunato S, Bergstrom CT, Börner K, Evans JA, Helbing D, Milojevi´c S, Petersen AM, Radicchi F, Sinatra R, Uzzi B et al (2018) Science of science. Science 359(6379):0185
3. Sinatra R, Deville P, Szell M, Wang D, Barabási A-L (2015) A century of physics. Nat Phys 11(10):791
4. Battiston F, Musciotto F, Wang D, Barabási A-L, Szell M, Sinatra R (2019) Taking census of physics. Nat Rev Phys 1(1):89 5. Hoonlor A, Szymanski BK, Zaki MJ (2013) Trends in computer science research. Commun ACM 56(10):74–83 6. Cheng Q, Lu X, Liu Z, Huang J (2015) Mining research trends with anomaly detection models: the case of social
computing research. Scientometrics 103(2):453–469
7. Effendy S, Yap RHC (2017) Analysing trends in computer science research: a preliminary study using the Microsoft academic graph. In: WWW ’17 companion proceedings of the 26th international conference on World Wide Web companion, pp 1245–1250
8. Della Briotta Parolo P, Pan RK, Ghosh R, Huberman BA, Kaski K, Fortunato S (2015) Attention decay in science. J Informetr 9(4):734–745
9. Yin Y, Wang D (2017) The time dimension of science: connecting the past to the future. J Informetr 11(2):608–621 10. Pan RK, Petersen AM, Pammolli F, Fortunato S (2018) The memory of science: inflation, myopia, and the knowledge
network. J Informetr 12(3):656–678
11. Wagner CS, Roessner JD, Bobb K, Klein JT, Boyack KW, Keyton J, Rafols I, Börner K (2011) Approaches to understanding and measuring interdisciplinary scientific research (IDR): a review of the literature. J Informetr 5(1):14–26
12. Leydesdorff L, Rafols I (2011) Indicators of the interdisciplinarity of journals: diversity, centrality, and citations. J Informetr 5(1):87–100
13. Bromham L, Dinnage R, Hua XX (2016) Interdisciplinary research has consistently lower funding success. Nature 534(7609):684–687
14. Leydesdorff L, Wagner CS, Bornmann L (2019) Interdisciplinarity as diversity in citation patterns among journals: Rao–Stirling diversity, relative variety, and the Gini coefficient. J Informetr 13(1):255–269
15. Franzoni C, Scellato G, Stephan P (2014) The mover’s advantage: the superior performance of migrant scientists. Econ Lett 122(1):89–93
16. Deville P, Wang D, Sinatra R, Song C, Blondel VD, Barabási AL (2015) Career on the move: geography, stratification, and scientific impact. Sci Rep 4(1):4770
17. Scellato G, Franzoni C, Stephan PE (2015) Migrant scientists and international networks. Res Policy 44(1):108–120 18. Foster JG, Rzhetsky A, Evans JA (2015) Tradition and innovation in scientists’ research strategies. Am Sociol Rev
80(5):875–908
19. Jia T, Wang D, Szymanski BK (2017) Quantifying patterns of research-interest evolution. Nat Hum Behav 1(4):78 20. Arrieta OAD, Pammolli F, Petersen AM (2017) Quantifying the negative impact of brain drain on the integration of
European science. Sci Adv 3(4):e1602232
21. Vaccario G, Verginer L, Schweitzer F (2018) Reproducing scientists’ mobility: a data-driven model. arXiv preprint. arXiv:1811.07229
22. James C, Pappalardo L, Sirbu A, Simini F (2018) Prediction of next career moves from scientific profiles. arXiv preprint. arXiv:1802.04830
23. Wuchty S, Jones BF, Uzzi B (2007) The increasing dominance of teams in production of knowledge. Science 316(5827):1036–1039
24. Bettencourt LMA, Kaiser DI, Kaur J (2009) Scientific discovery and topological transitions in collaboration networks. J Informetr 3(3):210–221
25. Milojevi´c S (2014) Principles of scientific research team formation and evolution. Proc Natl Acad Sci USA 111(11):3984–3989
26. Petersen AM (2015) Quantifying the impact of weak, strong, and super ties in scientific careers. Proc Natl Acad Sci USA 112(34):201501444
27. Larivière V, Gingras Y, Sugimoto CR, Tsou A (2015) Team size matters: collaboration and scientific impact since 1900. J Assoc Inf Sci Technol 66(7):1323–1332
28. Zeng XHT, Duch J, Sales-Pardo M, Moreira JAG, Radicchi F, Ribeiro HV, Woodruff TK, Amaral LAN (2016) Differences in collaboration patterns across discipline, career stage, and gender. PLoS Biol 14(11):e1002573
29. Czaika M, Orazbayev S (2018) The globalisation of scientific mobility, 1970–2014. Appl Geogr 96:1–10 30. Hall KL, Vogel AL, Huang GC, Serrano KJ, Rice EL, Tsakraklides SP, Fiore SM (2018) The science of team science:
a review of the empirical evidence and research gaps on collaboration in science. Am Psychol 73(4):532–548 31. Bu Y, Murray DS, Ding Y, Huang Y, Zhao Y (2018) Measuring the stability of scientific collaboration. Scientometrics
114(2):463–479
Chinazzi et al.EPJ Data Science (2019) 8:33 Page 17 of 18
34. Wagner CS, Whetsell TA, Mukherjee S (2019) International research collaboration: novelty, conventionality, and atypicality in knowledge recombination. Res Policy 48(5):1260–1270
35. Petersen AM, Riccaboni M, Stanley HE, Pammolli F (2012) Persistence and uncertainty in the academic career. Proc Natl Acad Sci USA 109(14):5213–5218
36. Penner O, Pan RK, Petersen AM, Kaski K, Fortunato S (2013) On the predictability of future impact in science. Sci Rep 3(1):3052
37. Petersen AM, Fortunato S, Pan RK, Kaski K, Penner OB, Rungi A, Riccaboni M, Stanley HE, Pammolli F (2014) Reputation and impact in academic careers. Proc Natl Acad Sci USA 111(43):15316–15321
38. Wang D, Song C, Barabási A-L (2013) Quantifying long-term scientific impact. Science 342(6154):127–132 39. Sinatra R, Wang D, Deville P, Song C, Barabási A-L (2016) Quantifying the evolution of individual scientific impact.
Science 354(6312):5239
40. Clauset A, Larremore DB, Sinatra R (2017) Data-driven predictions in the science of science. Science 355(6324):477–480
41. Veugelers R, Wang J (2019) Scientific novelty and technological impact. Res Policy 48(6):1362–1372 42. Börner K, Chen C, Boyack KW (2003) Visualizing knowledge domains. Annu Rev Inf Sci Technol 37(1):179–255 43. Boyack KW, Klavans R, Börner K (2005) Mapping the backbone of science. Scientometrics 64(3):351–374 44. Leydesdorff L, Rafols I (2009) A global map of science based on the isi subject categories. J Am Soc Inf Sci Technol
60(2):348–362
45. Rafols I, Porter AL, Leydesdorff L (2010) Science overlay maps: a new tool for research policy and library management. J Am Soc Inf Sci Technol 61(9):1871–1887
46. Bollen J, Van de Sompel H, Hagberg A, Bettencourt L, Chute R, Rodriguez MA, Balakireva L (2009) Clickstream data yields high-resolution maps of science. PLoS ONE 4(3):4803
47. Guevara MR, Hartmann D, Aristarán M, Mendoza M, Hidalgo CA (2016) The research space: using career paths to predict the evolution of the research output of individuals, institutions, and nations. Scientometrics
109(3):1695–1709
48. Bengio Y, Ducharme R, Vincent P, Jauvin C (2003) A neural probabilistic language model. J Mach Learn Res 3:1137–1155
49. Mikolov T, Sutskever I, Chen K, Corrado GS, Dean J (2013) Distributed representations of words and phrases and their compositionality. In: Burges CJC, Bottou L, Welling M, Ghahramani Z, Weinberger KQ (eds) Advances in neural information processing systems, vol 26. Curran Associates, Inc., New York, pp 3111–3119
50. Mikolov T, Chen K, Corrado G, Dean J (2013) Efficient estimation of word representations in vector space. arXiv preprint.arXiv:1301.3781
51. Huang EH, Socher R, Manning CD, Ng AY (2012) Improving word representations via global context and multiple word prototypes. In: Proceedings of the 50th annual meeting of the association for computational linguistics: long papers, vol 1. Association for Computational Linguistics, Stroudsburg, pp 873–882
52. Pennington J, Socher R, Manning C (2014) Glove: global vectors for word representation. In: Proceedings of the 2014 conference on empirical methods in natural language processing (EMNLP), pp 1532–1543
53. Bojanowski P, Grave E, Joulin A, Mikolov T (2017) Enriching word vectors with subword information. Trans Assoc Comput Linguist 5:135–146
54. Wu L, Fisch A, Chopra S, Adams K, Bordes A, Weston J (2017) Starspace: embed all the things! arXiv preprint. arXiv:1709.03856
55. Salton G, Wong A, Yang C-S (1975) A vector space model for automatic indexing. Commun ACM 18(11):613–620 56. Small H (1973) Co-citation in the scientific literature: a new measure of the relationship between two documents.
J Am Soc Inf Sci 24(4):265–269
57. Hidalgo CA, Klinger B, Barabási A-L, Hausmann R (2007) The product space conditions the development of nations. Science 317(5837):482–487
58. Hidalgo CA, Balland P-A, Boschma R, Delgado M, Feldman M, Frenken K, Glaeser E, He C, Kogler DF, Morrison A et al (2018) The principle of relatedness. In: International conference on complex systems. Springer, Cham, pp 451–457 59. AIP-Publishing: PACS 2010 Regular Edition (2010).
https://publishing.aip.org/publishing/pacs/pacs-2010-regular-edition. Accessed 2017-08-03
60. Zhang Q, Perra N, Gonçalves B, Ciulla F, Vespignani A (2013) Characterizing scientific production and consumption in physics. Sci Rep 3:1640
61. Balassa B (1965) Trade liberalisation and “revealed” comparative advantage. Manch Sch 33(2):99–123
62. Aquino A (1981) Changes over time in the pattern of comparative advantage in manufactured goods: an empirical analysis for the period 1962–1974. Eur Econ Rev 15(1):41–62
63. Soete LG, Wyatt SM (1983) The use of foreign patenting as an internationally comparable science and technology output indicator. Scientometrics 5(1):31–54
64. Crafts NF, Thomas M (1986) Comparative advantage in uk manufacturing trade, 1910–1935. Econ J 96(383):629–645 65. Van Hulst N, Mulder R, Soete LL (1991) Exports and technology in manufacturing industry. Weltwirtsch Arch
127(2):246–264
66. Cantwell J (1995) The globalisation of technology: what remains of the product cycle model? Camb J Econ 19(1):155–174
67. Amiti M (1999) Specialization patterns in Europe. Weltwirtsch Arch 135(4):573–593 68. Iapadre PL (2001) Measuring international specialization. Int Adv Econ Res 7(2):173–183
69. De Benedictis L, Gallegati M, Tamberi M (2008) Semiparametric analysis of the specialization-income relationship. Appl Econ Lett 15(4):301–306
70. OECD (2011) Globalisation, comparative advantage and the changing dynamics of trade. OECD Publishing, Paris 71. Amighini A, Leone M, Rabellotti R (2011) Persistence versus change in the international specialization pattern of Italy:
how much does the ‘district effect’ matter? Reg Stud 45(3):381–401
72. D’Agostino LM, Laursen K, Santangelo GD (2013) The impact of R&D offshoring on the home knowledge production of OECD investing regions. J Econ Geogr 13(1):145–175
74. Bahar D, Hausmann R, Hidalgo CA (2014) Neighbors and the evolution of the comparative advantage of nations: evidence of international knowledge diffusion? J Int Econ 92(1):111–123
75. Freund C, Pierola MD (2015) Export superstars. Rev Econ Stat 97(5):1023–1032
76. Boschma R, Frenken K, Bathelt H, Feldman M, Kogler D et al (2012) Technological relatedness and regional branching. In: Beyond territory. Dynamic geographies of knowledge creation, diffusion and innovation, pp 64–68
77. Neffke F, Henning M, Boschma R (2011) How do regions diversify over time? Industry relatedness and the development of new growth paths in regions. Econ Geogr 87(3):237–265
78. Kogler DF, Rigby DL, Tucker I (2013) Mapping knowledge space and technological relatedness in US cities. Eur Plan Stud 21(9):1374–1391
79. Boschma R, Minondo A, Navarro M (2013) The emergence of new industries at the regional level in Spain: a proximity approach based on product relatedness. Econ Geogr 89(1):29–51
80. Boschma R, Heimeriks G, Balland P-A (2014) Scientific knowledge dynamics and relatedness in biotech cities. Res Policy 43(1):107–114
81. Boschma R, Balland P-A, Kogler DF (2014) Relatedness and technological change in cities: the rise and fall of technological knowledge in us metropolitan areas from 1981 to 2010. Ind Corp Change 24(1):223–250 82. Essletzbichler J (2015) Relatedness, industrial branching and technological cohesion in us metropolitan areas. Reg
Stud 49(5):752–766
83. Rigby DL (2015) Technological relatedness and knowledge space: entry and exit of us cities from patent classes. Reg Stud 49(11):1922–1937
84. Boschma R (2005) Proximity and innovation: a critical assessment. Reg Stud 39(1):61–74
85. Boschma R, Frenken K (2010) The spatial evolution of innovation networks: a proximity perspective. In: The handbook of evolutionary economic geography. Edward Elgar, Cheltenham Glos
86. Cohen WM, Levinthal DA (2000) Absorptive capacity: a new perspective on learning and innovation. In: Strategic learning in a knowledge economy. Elsevier, Amsterdam, pp 39–67
87. World Bank: world development indicators (2019).http://datatopics.worldbank.org/world-development-indicators/. Accessed 2019-04-04
88. Tacchella A, Cristelli M, Caldarelli G, Gabrielli A, Pietronero L (2012) A new metrics for countries’ fitness and products’ complexity. Sci Rep 2:723
89. Cristelli M, Tacchella A, Cader M, Roster K, Pietronero L (2017) On the predictability of growth. Policy Research working paper (WPS8117)
90. Hamilton WL, Leskovec J, Jurafsky D (2016) Diachronic word embeddings reveal statistical laws of semantic change. arXiv preprint.arXiv:1605.09096
91. Szymanski T (2017) Temporal word analogies: identifying lexical replacement with diachronic word embeddings. In: Proceedings of the 55th annual meeting of the association for computational linguistics (volume 2: short papers), vol 2, pp 448–453
92. Conneau A, Lample G, Ranzato M, Denoyer L, Jégou H (2017) Word translation without parallel data. arXiv preprint. arXiv:1710.04087
93. Lample G, Conneau A, Denoyer L, Ranzato M (2017) Unsupervised machine translation using monolingual corpora only. arXiv preprint.arXiv:1711.00043
94. Radicchi F, Fortunato S, Markines B, Vespignani A (2009) Diffusion of scientific credits and the ranking of scientists. Phys Rev E 80(5):056103
95. Duchi J, Hazan E, Singer Y (2011) Adaptive subgradient methods for online learning and stochastic optimization. J Mach Learn Res 12:2121–2159