*Corresponding author: E-mail: ([email protected] , [email protected]), Department of Applied Chemistry, Faculty of Science, Malayer University, Malayer, 65174, Iran, Tel:+988132355404
Chemical Methodologies
Journalhomepage: http://chemmethod.com
Original Research article
The AIM, RDG, NBO,
Q
uantum and Structural Study of
Adsorption of Phosgene Gas on the Surface of Pristine
and Al, P Doped Ga
12N
12Nano Cluster: A DFT Method
P. Hosseini, M. Rezaei‒Sameti*
Department of Applied Chemistry, Faculty of Science, Malayer University, Malayer, 65174, Iran
A R T I C L E I NF O R MA T I O N A B S T R A C T
Received: 31 October 2018 Received in revised: 10 March 2019 Accepted: 28 March 2019
Available online: 01 September 2019
DOI: 10.33945/SAMI/CHEMM.2019.5.4
The main objective of this work is to study the sensivity of pristine, Al, P and Al & P doped Ga12N12 to adsorb phosgene (COCl2) molecule. The
interaction of COCl2 from O, C and Cl sites on the surface of Ga12N12 is
investigated by applying the density functional theory (DFT) at the cam-B3LYP/6-31G(d) level of theory. The geometrical and electrical structures, quantum descriptive, thermodynamic parameters, solvent effect, atom in molecule theory (AIM), natural bond orbital (NBO), and the reduced density gradient (RDG) are calculated at the above level of theory. The calculated results indicate that the adsorption of COCl2 on the surface of pristine and
Al, P and Al & P doped Ga12N12 is exothermic, as well as Al-doped Ga12N12 is more favorable than P and Al & P doped. The recovery time results for adsorption of COCl2 from O site on the surface of Ga12N12,
Al-Ga11N12, Ga12N11P and Al-Ga11N11P are 0.103, 4.69×10⁻⁷, 3.81×10⁻¹² and
4.31×10⁻⁷ respectively. As a result, these nanoclusters can be used as sensor
devices toward COCl2 molecule.
The deformation energy results reveal that the structural change of Ga12N12 and COCl2 at all adsorption states are not significant. The AIM,
RDG and NBO results demonstrate that the intermolecular interaction from O site of COCl2 on the surface of pristine, Al, P and Al & P doped Ga12N12 is
stronger than C and Cl atoms sites of COCl2 as it is an electrostatic attractive
type.
KEYWORDS
COCl2
Ga12N12 Al P
Graphical Abstract
Introduction
Phosgene (COCl2) is a color less and nonflammable gas. It is a very reactive and highly toxic gas, its odor resembles freshly cut grass. Phosgene is used as an industrial reagent in the synthesis of organic compounds, pharmaceuticals, chemical weapon, and intermediate in the production of isocyanates, carbamoyl chlorides, carbazates, chloroformates, thiochloroforrnates, carbamates, urethanes, azourea dyes, oxazolidinedions and other compounds [1‒3]. In the industrial manufacture, small amounts of phosgeneis were produced from combustion and breakdown organochlorine compounds. COCl2 vapors are strongly poisonous and cause disease in eye and breathe system such ascoughing, chest tightness, choking, and coughing [4]. In addition, COCl2 reacts with enzymes and proteins in biological systems and cause formation of covalent adducts in molecular functions and so the activity of enzymes decreases and may lead to loss cellular function and cell death [5]. The computational results of Raissi et al., [6] showed that COCl2 molecule adsorbed on the pristine AlNNTs through weak van der Waals interaction means that the adsorption is physisorption process.
[24‒26]. Recent research results showed that adsorption of oxygen, hydrogen, NH3, NO2, and Si on the surface of GaNNTs is more favorable than other nanotubes; this nanotube can be a good absorbent for these compounds [27‒31]. In the previous work we studied the interaction of isoniazid drug with the pristine and Ni‒doped of (4, 4) armchair GaNNTs [32]. The results of our study demonstrated that Ni‒doped GaNNTs decrease adsorption strength of isoniazid drug on the surface of nanotube. After our pervious studied [33‒35], in the current project we decided to investigate the interaction of phosgene gason the surface of pristine and Al and P doped GaN nanocluster (Ga12N12) using density functional theory. At the first step, we considered various different positions for adsorbing COCl2 molecule on the surface of GaN nanotube. After full optimization of all considered models, the stable structures without any imaginary frequency are selected. By using the selected structures the electrical and geometrical properties of COCl2/Ga12N12 are investigated. The results of this project may be useful for finding and making novel adsorbent or sensor for phosgene molecule.
Material and methods Computational aspects
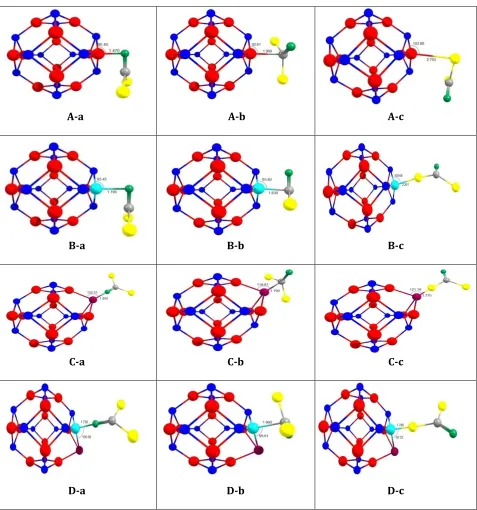
In this work, for simplicity of our study, at the first step the indexes a, b and c are applied for determining COCl2 molecule adsorption orientation from O, C and Cl atoms respectively (see Figure 1). The pristine and Al, P and Al&P doped Ga12N12nano cluster is denoted by A, B, C and D models (see Figure 2). All adsorption models (A-a, A-b, A-c, B-a, B-b, B-c, C-a, C-b, C-c, D-a, D-b and D-c) are optimized using density functional theory (DFT) at B3LYP [36‒37] and coulomb-attenuating method (CAM-B3LYP) level of theory [38] at the 6-31G* basis set with performing the Gaussian 09 suite of programs [39]. All adsorption models are optimized with optimization criteria (Max force= 0.000014, RMS force=0.000003, Max displacement=0.00072 and RMS displacement=0.000093) and confirmed that all the stationary points correspond to true minima on the potential energy. From the optimized structures, the adsorption energy (Eads) of COCl2 on the Ga12N12, Al Ga11N12, Ga12N11P, and Al Ga11N11P clusters is determined by:
/ 2 2 (1)
ads Nanocluster COCl Nanocluster COCl
E E E E BSSE
Figure 1.The adsorption positions ofCOCl2molecule on the surface of Ga12N12 nano cluster
The deformation energy (Edef) contributions [41], which are occurred during the adsorption process for nanocluster, COCl2 and the COCl2/nanocluster complex are calculated by Eqs. (2-5):
2 2
2 2
12 12 12 12 12 12
2
int 12 12/ 12 12
/ int
(2)
(3)
( ) (4)
(5)
def Ga N Ga N free Ga N in complex
def COCl COCl free COCl in complex
Ga N COCl Ga N in complex COCl in complex
def complex ads
E E E
E E E
E E E E
E E E
where EGa12N12 in complex and ECOCl2 in complex is the total energy of Ga12N12 and COCl2 in the COCl2/Ga12N12 complex. The Edef Ga12N12, Edef COCl2, and Edef complex are the deformation energy of Ga12N12, COCl2and COCl2/nanocluster complex in its optimized geometry.
The HOMO (highest occupied molecular orbital) and the LUMO (lowest unoccupied molecular orbital) are performed for study the electrical properties of COCl2/nanocluster complex. From HOMO and LUMO energies the physical properties such as gap energy, electrochemical potential (µ), chemical hardness (η), and maximum amount of electronic charge ΔN [42‒44] are calculated by Eqs. (6-9)
(6)
( ) / 2 (7)
( ) / 2 (8)
/ (9)
gap LUMO HOMO
LUMO HOMO
LUMO HOMO
E E E
E E E E N
The thermodynamic parameters such as Gibbs free energy (∆G), enthalpy (∆H), entropy (∆S) and Gibbs free energy solution (∆Gsol) are calculated by Eq. 10:
Here Qnanocluster/COCl2, Qnanocluster and QCOCl2 are the total thermodynamic parameters of COCl2/ nanocluster complex, free nanocluster and free COCl2 molecule respectively.
Figure 2.2D views of COCl2molecule adsorptionon the surface of pristine, Al, P and Al&P doped Ga12N12 for
A-a to D-c adsorptionmodels
A-a A-b A-c
B-a B-b B-c
C-a C-b C-c
Results and discussion
The structural geometry and energetics properties
The optimized structure of the A-a to D-c adsorption models are shown in Figure 2. According to the calculated geometrical properties, the average Ga‒N bond length in six tetragonal and eight hexagonal GaN ring around doping site in the pristine, Al Ga11N12, Ga12N11P and Al Ga11N11P are (1.92, 1.85), (1.85, 1.79), (2.38, 1.85), and (2.39, 1.79) respectively (see the Figures S1-S2 in supplementary data). This result is in agreement with other reports [24‒28, 32].
The dipole moment of the pristine, Al Ga11N12, Ga12N11P and Al Ga11N11P are 0.0085, 0.5138, 0.3257 and 0.7112 Debye respectively. The average Ga‒N bond length in six tetragonal and eight hexagonal GaN ring in the A-a, B-a, C-a and D-a models are (1.94 and 1.86 Å), (1.87, 1.81), (2.35, 1.85) and (2.43, 1.81) respectively (see the Figures S1-S2 in supplementary data). The dipole moment of A-a, B-a, C-a and D-a models are 4.098, 6.449, 4.966 and 7.344 Debye respectively. From NBO results, it is found that the NBO charges of Ga and N atoms in pristine Ga12N12 are 1.627 and ‒1.627 |e| respectively, the hybridization of Ga atom in the Ga–N bonds is SP4.46.In the Al doped model the NBO charge of Ga, N and Al atoms in doping position Al Ga11N12 are 1.627, ‒1.701 and 1.871 |e| respectively, the hybridization of Ga atom in the Ga–N bonds is SP1.29. In the pdopedmodel the NBO charge of Ga, N and P-doped in Ga12N11P are 1.371, ‒1.645 and ‒0.774 |e| respectively, the hybridization of Ga atom in the Ga–N bonds is SP1.96. In the Al & P doped the NBO charge of Ga, N and Al & P-doped in Al Ga11N11P are 1.353, ‒1.748, 1.660 and ‒0.876 |e| respectively, the hybridization of Ga atom in the Ga–N bonds is SP5.25. Comparison results indicate the NBO charge of Ga and N atoms in the P doped state is lower than pristine and Al doped, because the electronegativity of P (2.19) atom is more than Al (1.61) atom.
On the other hand with adsorbing COCl2 molecule, the NBO outcomes for A-a, B-a, C-a and D-a models reveal that the NBO charge of Ga and N atoms in COCl2/Ga12N12 complex are (1.635 and ‒1.677), (1.610, ‒1.714), (1.328, ‒1.680) and (1.631, ‒1.758) |e| respectively. The hybridization of Ga atom in the Ga–N bonds in the A-a, B-a, C-a and D-a models in the adsorption position are SP4.37, SP1.98, SP1.75 and SP5.12 respectively. These results indicate that the NBO charge of Ga and N atoms of pristine and doped Ga12N12 nanocluster after adsorbing COCl2 alter slightly from unabsorbed structure.
C-a (1.85 Å)>B-a (1.79 Å)>D-a (1.72Å)>A-a (1.47Å); A-b (1.96 Å)>D-b (1.90Å)>B-b (1.83Å)>C-b (1.79Å); A-c (2.79Å)> B-c (2.26Å)> D-c (1.78Å)> C-a (1.77Å). On other hand, based on the results of Table 1, the dipole moment is in order: D-a>B-a>C-a>A-a; D-b>B-b>A-b>C-b; B-c>D-b>A-c>C-c. Comparison results indicate that the dipole moment of the D-a model is more than other models and the C-c model is lower than other models.
The calculated adsorption energy and deformation energy of A-a to D-c models are tabulated in Table 1. The calculated results indicate that the adsorption energy values of all adsorption models are negative and exothermic. It is notable that the adsorption energy of B-a model (‒17.71 Kcal/mol) is more than other models whereas the adsorption energy of C-a model (‒0.97 Kcal/mol) is lower than other models. The order of adsorption energy in the c orientation of COCl2 is: B-c (‒17.38 Kcal/mol)>A-c (‒17.01Kcal/mol)>C-c (‒15.26 Kcal/mol)>D-c (‒12.72 Kcal/mol). This result reveals that the adsorption of COCl2 on the surface of Al doped Ga12N12 nanocluster is more favorable than P and Al & P doped. To further understand the sensivity of pristine and doped
Ga12N12 toward COCl2 molecule as a sensor device, the recovery time (
1 ( / )
exp
Eads kT
) at 298.15 K is calculated. The calculated results for adsorption of COCl2 at the A-a, B-a, C-a and D-a models are 0.103, 4.69×10⁻⁷, 3.81×10⁻¹² and 4.31×10⁻⁷. These results confirm that pristine, Al, P and Al & P doped Ga12N12 are a good candidate to making sensor device toward COCl2 molecule. Based on the calculated results of Table 1, the deformation energy values of Ga12N12, COCl2, for all adsorption models are negative. This result confirms that the curvature of structure of COCl2 and nanocluster is spontaneously from original state. The deformation energy of Ga12N12 is in range ‒0.24 to ‒1.85 Kcal/mol and for COCl2 is in range ‒0.15 to ‒1.65 Kcal/mol. Inspection of deformation energy results reveal that the structural deformation amount of Ga12N12 and COCl2 is not significant. The total deformation energy of Ga12N12/COCl2 complex at the all adsorption models are positive and are in range 0.25 to 3.48 Kcal/mol, and the interaction energy (Ebin) for all adsorption models are negative in range ‒1.23 to ‒20.53 Kcal/mol. Comparison results show that the structural deformation of COCl2 and Ga12N12 and interaction energy (Ebin) in the C-c models is lower than other models.
The thermodynamic parameters and solvent effect of all adsorption models are calculated based on the cam-B3LYP level of theory at the 6-31 G(d) base set and the results are listed in Table 2.
Table 1. Adsorption, deformation energies of GaNNTs, COCl2 and total complex; and binding energy for A-a to
D-c adsorption models
µ (dipole) Debye Eads Edef tot EBin Edef COCl2 Edef Ga12N12 property
4.09 -14. 97 1. 87 -16. 84 -0. 96 -0. 90 A-a
5.66 -10. 62 2. 53 -18. 69 -1. 18 -1. 35 A-b
2.16 -17. 01 1. 12 -11. 66 -0. 71 -0. 40 A-c
6.49 -17. 71 3. 50 -20. 51 -1. 65 -1. 84 B-a
6.50 -16. 98 3. 48 -20. 53 -1. 65 -1. 85 B-b
2.98 -17. 38 1. 76 -9. 48 -1. 23 -0. 53 B-c
4.96 -0. 97 1. 98 -14. 96 -0. 91 -1. 07 C-a
4.81 -11. 94 1. 43 -10. 81 -1. 29 -1. 13 C-b
1.31 -15. 26 0. 25 -1. 23 -0.15 -0. 24 C-c
7.39 -7. 66 2. 61 -14. 55 -0. 99 -1. 62 D-a
6.59 -10. 82 3. 17 -18. 44 -1. 52 -1. 65 D-b
2.69 -12. 72 1. 37 -9. 04 -1. 06 -0. 30 D-c
Table 2. Thermodynamic parameters and solvent energy for A-a to D-c adsorption models
∆Gsol(kcal/mol) ∆S(cal/mol-K) ∆G(kcal/mol) ∆H(kcal/mol)
A-a -13. 78 -4.11 -34. 27 4. 27
A-b -14. 85 -4. 02 -36. 30 3. 55
A-c -9. 40 0. 68 -33. 82 0. 63
B-a -15. 79 -4. 86 -36. 56 3. 89
B-b -15. 79 -4. 89 -36. 55 3. 89
B-c -13.74 -3.74 -33. 52 -1. 87
C-a -11. 73 -1. 29 -34. 99 1. 16
C-b -16. 27 -6. 38 -33. 18 5. 43
C-c -5. 41 2.21 -25. 65 -7. 09
D-a -11. 93 1. 44 -44. 84 -3. 36
D-b -14. 03 -2. 90 -37. 03 1. 83
D-c -6. 60 3. 63 -34. 34 -2. 49
The Gibbs free energy (∆G) of the A-c, C-c, D-a and D-c models in gas phase are positive and so the adsorption of COCl2 on the surface of Ga12N12 are unspontaneous in thermodynamic approach. Whereas the Gibbs free energy (∆G) of other adsorption models in gas phase is negative and spontaneous. On the other hand the solvent Gibbs free energy (∆Gsol) in the aqueous phase of the B-c, C-B-c, D-a and D-c models are negative, and at the other adsorption models are positive. The positive amounts of ∆Gsol indicate that the adsorption process of COCl2 on the surface of Ga12N12 in aqueous phase is unspontaneous in thermodynamic view of point.
A-c A-b
A-a
B-c B-b
B-a
C-c C-b
C-a
D-c D-b
D-a
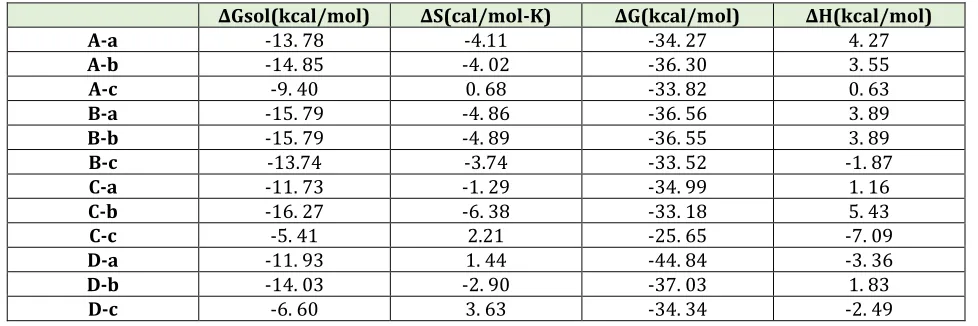
Figure 3.The DOS plots of COCl2molecule adsorptionon the surface of pristine, Al, P and Al&P doped
Ga12N12 for A-a to D-c adsorptionmodels
DO S/ar b-Unit
Quantum parameters
To further study the electronic nature of the interaction between COCl2 and pristine, Al, P, and Al & P doped Ga12N12 nano cluster, the HOMO and LUMO orbitals of all adsorption models are calculated, and the results are shown in Figure S4 in supplementary material.
Comparison results of all adsorption models indicate that the most density of HOMO orbital are localized around nano cluster surface and the most density of LUMO orbital are distributed around COCl2 molecule and the adsorption position. For this means, the surface of nanocluster is a good surface for attraction electrophilic compound.
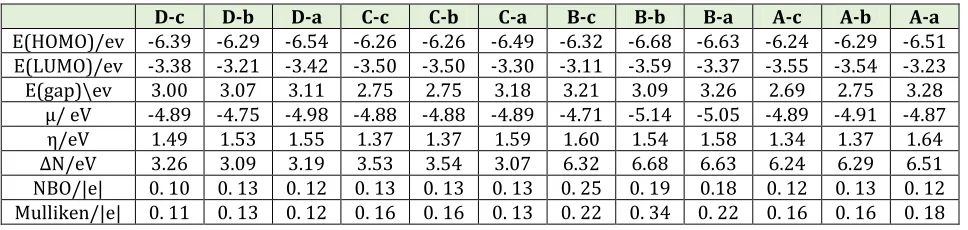
By using HOMO and LUMO energies the gap energy, electrochemical potential (µ), chemical hardness (η), electrophilicity (ω), and maximum amount of electronic charge ΔN are calculated by Eqs. (6-11) and the calculated results are listed in Table 3. One the significant parameter to determine the chemical activity of Ga12N12 nanocluster in presence of COCl2 is gap energy. It is well known that a large gap indicates high stability and low chemical reactivity and a small gap shows low stability and high chemical reactivity [45‒47]. According to calculated gap energy, it can be seen the gap energy of the a orientation (O head of COCl2) at the all adsorption models are smaller than the c orientation (Cl head of COCl2). In addition, with doping Al atom the gap energy of COCl2/Ga12N12 complex decrease significantly from pristine and P doped Ga12N12, and so
according to
A
exp
(Egap/kT) the reactivity and electrical conductance of Al doped Ga12N12 is more than other states.models) are larger than other models, and so the donor properties of COCl2 at these models are more than other adsorption models.
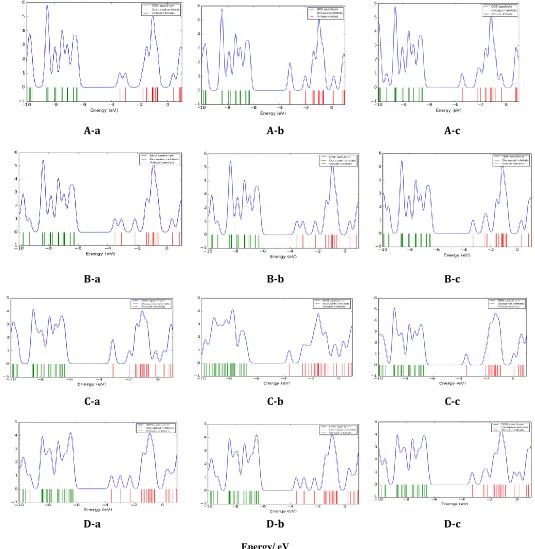
Figure 4. The MEP Plots of COCl2molecule adsorptionon the surface of pristine, Al, P and Al&P doped
Ga12N12 for A-a to D-c adsorptionmodels
A-a A-b A-c
B-a B-b B-c
C-a C-b C-c
These results are in a good agreement with the positive values of NBO and Mulliken charge of COCl2. Moreover, these results confirm that the charge transfer occurs from COCl2toward to nanocluster surface.
In order to investigate the electronic properties of COCl2/Ga12N12 complex, the densities of states (DOS) of complex have been calculated and presented in Figure 4. The results of DOS plots indicate that the conduction levels of Al-doped Ga12N12 in the B-a and B-b models shift toward lower energies compared to those of the pristine and P-doped Ga12N12. According to DOS plots, at the all adsorption models in the HOMO and LUMO region it can be seen 6 peaks. In the C-a, C-b and C-c models with doping P atoms the scheme and altitude of DOS peaks change significantly from pristine models, whereas the scheme and altitude of DOS peaks at the Al-doped alter slightly from original states. These results display the high sensitivity of electronic properties of P-doped Ga12N12 nano cluster towards the adsorbed COCl2. Therefore, the presence of the COCl2 molecule can be detected by calculating the conductivity change of the nanocluster before and after the COCl2adsorption.
Table 3. Quantum parameters, NBO and Mulliken charge of COCl2 for A-a to D-c adsorption models
D-c D-b D-a C-c C-b C-a B-c B-b B-a A-c A-b A-a
E(HOMO)/ev -6.39 -6.29 -6.54 -6.26 -6.26 -6.49 -6.32 -6.68 -6.63 -6.24 -6.29 -6.51 E(LUMO)/ev -3.38 -3.21 -3.42 -3.50 -3.50 -3.30 -3.11 -3.59 -3.37 -3.55 -3.54 -3.23 E(gap)\ev 3.00 3.07 3.11 2.75 2.75 3.18 3.21 3.09 3.26 2.69 2.75 3.28
µ/ eV -4.89 -4.75 -4.98 -4.88 -4.88 -4.89 -4.71 -5.14 -5.05 -4.89 -4.91 -4.87
η/eV 1.49 1.53 1.55 1.37 1.37 1.59 1.60 1.54 1.58 1.34 1.37 1.64
∆N/eV 3.26 3.09 3.19 3.53 3.54 3.07 6.32 6.68 6.63 6.24 6.29 6.51
NBO/|e| 0. 10 0. 13 0. 12 0. 13 0. 13 0. 13 0. 25 0. 19 0.18 0. 12 0. 13 0. 12 Mulliken/|e| 0. 11 0. 13 0. 12 0. 16 0. 16 0. 13 0. 22 0. 34 0. 22 0. 16 0. 16 0. 18
Natural bond orbital (NBO) population analysis
To investigate intra and intermolecular bonding and interaction among bonds, charge transfer or conjugative interaction in molecular systems, the natural bond orbital (NBO) [50] parameters for all adsorption models are calculated at the cam-B3LYP level of DFT theory and the calculated results are tabulated in Table 4.
For this means the stabilization energy (E2) associated with the donor orbital (i) and acceptor orbital (j) is calculated by Eq.:
2 ( 2)
(11)
ij i
j i
F
E q
Here,
i and
jare orbital energies, Fij is the off‒diagonal NBO Fock matrix element and qi is
donor orbital occupancy. The value of E(2) illustrate, the nature of interaction between donor orbital electron and acceptor orbital electron, and the greater the extent of conjugation of the whole system. Inspection of calculated results in Table 4 indicate that the strongest inter
molecular interaction in the A-a and B-a model soccur in the N1Ga1*N8Ga2 with E(2) value 5.75 and 7.69 Kcal/mol respectively. Wherein the strongest inter molecular interaction
for the C-a model occurs in the N1Ga1*N2Ga1 with E(2) value 7.40 Kcal/mol, and for
the D-a model occurs in the N1Ga2 *N1Ga1 with E(2) value 4.38 Kcal/mol. Whereas the lowest inter molecular interaction occurs for A-b and B-b models in the
1 2 * 1 2
N Ga N Ga
with 1.24 and 1.81 Kcal/mol and the E(2) value for C-b model in
theN1Ga2 *N1Ga2 is 0.27 Kcal/mol. In addition, the E(2) value for D-b model in
theN1Ga2 *N2Ga2 is 2.43 Kcal/mol. These results demonstrate that the inter molecular interaction from O site of COCl2 on the surface of pristine, Al, P and Al & P doped Ga12N12 is stronger than C and Cl atoms site of COCl2. Noticeably, the adsorption and interaction of COCl2 on the surface of Al doped Ga12N12 is more suitable than other models; this result is in a good agreement with adsorption and thermodynamic energies.
Molecular electrostatic potential (MEP)
molecule. It can be concluded that the electron rich O atom of COCl2 strongly tends to interact with nanocluster.
Table 4. The perturbation second order energy for donor and acceptor orbital, for A-a to D-c adsorption models
F(i, j) E(j)-E(i) E2 (kcal/mol) Acceptor Donor
A-a 5.75 0.63 0.054
1.76 0.60 0.029
A-b 4.47 0.63 0.048
1.24 0.61 0.025
A-c 0.52 0.54 0.015
2.60 0.56 0.035
B-a 7.69 0.65 0.063
1.83 0.79 0.034
B-b 7.65 0.65 0.063
1.81 0.79 0.034
B-c 8.61 0.63 0.066
2.37 0.77 0.038
C-a 7.40 0.48 0.054
5.54 0.49 0.047
C-b 1.30 0.80 0.030
0.27 0.82 0.014
C-c 6.14 0.48 0.057
5.12 0.49 0.045
D-a 2.53 0.56 0.034
4.38 0.48 0.042
D-b 2.43 0.56 0.033
4.57 0.48 0.034
D-c 4.17 0.53 0.042
4.43 0.49 0.042
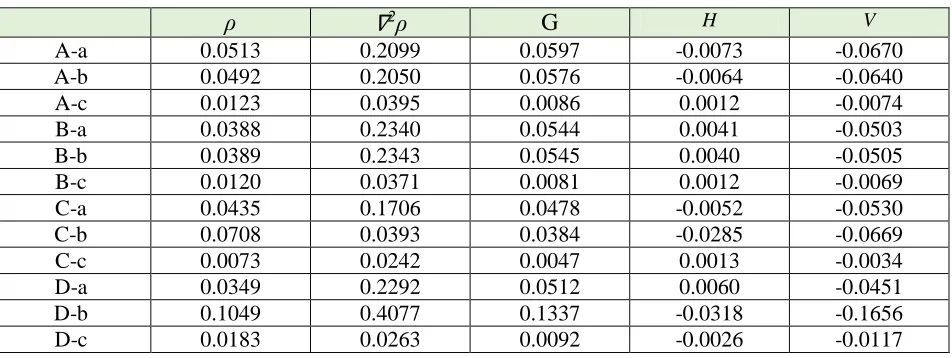
Quantum theory of atom in molecule (QTAIM) and reduced density gradient (RDG)
One of the powerful methods to study the nature of interactions between two compounds is atom in molecule [52]. Nature of chemical bonds and other valuable information about chemical bonding can be described by analysis of total electronic density, ρBCP, and Laplacian of electron, densities (▽
2ρ) at bond critical point (BCP), the potential energy (VBCP), the total electronic energy (HBCP), and
the kinetic energy (GBCP) of the bond in critical points are calculated and listed in Table 5. According to Bader [52] theory, the negative values of ▽2ρ and HBCP indicate the strong interaction (strong
covalent bond), the positive values of ▽2ρ and HBCP values denote the weak covalent interactions
strength as partially covalent bond. For this means, the values of ▽2ρ and HBCP for the (A-c, B-a, B-b,
B-c, C-c and D-a models) are positive and refers to the weak covalent interactions (strong electrostatic bond) between COCl2. Ga12N12 complex. Wherein the values of ▽2ρ and HBCP for the
(A-a, A-b, C-a, C-b, D-b and D-c models) are positive and negative respectively and define medium strength as partially covalent bond between COCl2. Ga12N12 complex.
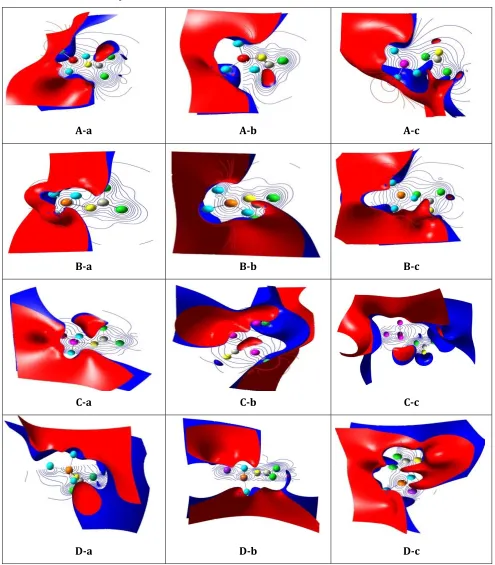
To identify the weak inter molecular interaction between the COCl2 and pristine, Al, P and Al & P doped Ga12N12 nanocluster, we calculate non-covalent interaction (NCI) index [53]. The scatter plot of reduced-density gradient (RDG) as function of sign (λ2) ρ(r) (product between electron density ρ(r) and the sign of the second lowest eigenvalues of electron density hessian matrix (λ2)) is determined by multiwfn program [54] and result is shown in Figure 5. In the RDG scatter, graph red color circle shows the bonded interactions (λ2<0), blue color circle denotes nonbonding interactions (λ2>0) and green circle implies low electron density, corresponding to Van der walls interactions (λ2=0). Comparison RDG scatter graph Figure 5 demonstrate that the reduced density gradient of the B-a, B-b, D-a and D-b models in λ2<0 region is more than other models and so attractive interaction between COCl2. Ga12N12 complex in these models is more than other models. And so doping of Al atom increase the adsorption of COCl2 and the surface of Ga12N12 nanocluster. This result is in agreement with the more values of adsorption energy of these models. On the other hand, the attractive interaction from O atom of COCl2 on the surface of Ga12N12 nanocluster is stronger than C and Cl atoms of COCl2. The broad inter molecular iso surface of RDG plot in the B-a, B-b and B-c models suggests that an attractive electrostatic type interaction is operative between O atom of COCl2 gas and Ga12N12 nanocluster, and on the A-a, A-b, C-b, and D-b models, the number of peaks around λ=0 is more than other models, which correspond to van der Waals interaction.
Table 5. The topological parameters of AIM method for A-a to D-c adsorption models
ρ
∇
2ρ
G
H VA-c A-b
A-a
B-c B-b
B-a
C-c C-b
C-a
D-c D-b
D-a
Figure 5.The RDGPlots of COCl2molecule adsorptionon the surface of pristine, Al, P and Al&P doped Ga12N12
Conclusions
In this work, density functional theory at the cam-B3LYP level is applied to investigate the interaction and adsorption of COCl2 molecule on the surface of pristine, Al, P and Al & P doped Ga12N12 nanocluster. The adsorption energy of COCl2 from O, C and Cl sites on the surface of pristine, Al, P and Al & P doped Ga12N12 nanocluster are negative and exothermic. The order of adsorption energy in the c orientation of COCl2 is: B-c (‒17.38 kcal/mol)>A-c (‒17.01 Kcal/mol)>C-c (‒15.26 KKcal/mol)>C-cal/mol)>D-Kcal/mol)>C-c (‒12.72 KKcal/mol)>C-cal/mol). The Gibbs free energy (∆G) of the A-Kcal/mol)>C-c, C-Kcal/mol)>C-c, D-a and D-Kcal/mol)>C-c models in gas phase are positive and so the adsorption of COCl2 on the surface of Ga12N12 are unspontaneous in thermodynamic approach. Whereas the Gibbs free energy (∆G) of the other adsorption models in gas phase is negative and spontaneous. On the other hand, the solvent Gibbs free energy (∆Gsol) in the aqueous phase of the B-c, C-c, D-a and D-c models are negative, and at the other adsorption models are positive. The gap energies of the A-a, B-a, C-a and D-a (O head of COCl2) are smaller than other models. In addition, with doping Al atom the gap energy of COCl2/Ga12N12 complex is decreased significantly from pristine and P doped Ga12N12. The global hardness of adsorption of COCl2 on the surface of Al-doped Ga12N12 is lower than other models and so the change of electronic properties of system more than other models. The values of ▽2ρ
and HBCP for the (A-c, B-a, B-b, B-c, C-c and D-a models) are positive and refer to the weak covalent interactions (strong electrostatic bond) between COCl2.Ga12N12 complex.
Acknowledgment
The author thanks the Computational information center of Malayer University for providing the necessary facilities to carry out the research.
Supplementary data
Tables S1‒ S8 and Figures S1‒ S12 are given in supplementary data.
References
[1] Schneider W., Diller W. Phosgene,Ullmann’s Encyclopedia of Industrial Chemistry, Weinheim: Wiley-VCH, 2005
[2] Borak J., Diller W.F. J. Occupat. Environt. Med., 2001, 43:110
[3] U.S. Environmental Protection Agency. Health Assessment Document for Phosgene, Office of Research and Development, Research Triangle Park, NC. 1986.
[5] Gift J., McGaughy R., Sonawane, B. Toxicological review of phosgene. U.S., Environmental Protection Agency, Washington, DC, 2005
[6] Shahabi M., Raissi H. J. Incl. Phenom. Macrocycl. Chem., 2016, 86:305
[7] Kumar D., Verma V., Dharamvir K., Bhatti H.S. Model. Mater. Struct., 2015, 11:2
[8] Liu B., Bando Y., Wang M., Tang C., Mitome M., Golberg D. Nanotechnology., 2009, 20:185705 [9] Zhang J., Meguid S.A. Nano. Energy., 2015, 12:322
[10] Colussi M.L., Baierle R.J., Miwa R.H. J. Appl. Phys., 2008, 104:033712
[11] Srivastava A., Khan M.I., Tyagi N., Swaroop Khare P. Sci. World J., 2014, 2014:984591
[12] Valedbagi S., Mohammad Elahi S., Abolhassani M.R., Fathalian A., Esfandiar A. Opt. Mater. (Amst)., 2015, 47:44
[13] Chandiramouli R. Struct. Chem., 2015, 26:375
[14] Tang Q., Cui Y., Li Y., Zhou Z., Chen Z. J. Phys. Chem. C., 2011, 115:1724
[15] Beheshtian J., Kamfiroozi M., Bagheri Z., Peyghan A.A. Chin. J. Chem. Phys., 2012, 25:60 [16] Beheshtian J., Bagheri Z., Kamfiroozi M., Ahmadi A. Microelectron. J., 2011, 42:1400 [17] Beheshtian J., Kamfiroozi M., Bagheri Z., Ahmadi A. Comput. Mater. Sci., 2012, 54:115 [18] Zhang J., Meguid S.A. Nano Energy., 2015, 12:322
[19] Goldberger J., He R., Zhang Y., Lee S., Yan H., Choi H.J., Yang P. Nature., 2003, 422:599
[20] Lee S.M., Lee Y.H., Hwang Y.G., Elsner J., Porezag D., Frauenheim T. Phys. Rev. B., 1999, 60:7788 [21] Zhang M., Su Z.M., Yan L.K., Qiu Y.Q., Chen G.H., Wang R.S. Chem. Phys. Lett., 2005, 408:145
[22] Yang M., Shi J., Zhang M., Zhang S., Bao Z., Luo S., Zhou T. C., Zhu T.,Li X., Li J. Mater. Chem. Phys., 2013, 138: 225
[23] Khaddeo K.R., Srivastava A., Kurchania R. J. Comput. Theor. Nanosci., 2013, 10:2066
[24] Park Y.S., Lee G., Holmes M.J., Chan C.C.S., Reid B.P.L., Alexander-Webber J.A., Nicholas R.J., Taylor R.A., Kim K.S., Han S.W., Yang W., Jo Y.,Kim J., Im H. Nano Lett., 2015, 15:4472
[25] Moradian R., Azadi S., Farahani S.V. Phys. Lett. A., 2008,372:6935
[26] Seif A., Ahmadi T.S., Bodaghi A., Hosseini J. J. Mole. Struct. (THEOCHEM), 2009, 911:19 [27] Chen G.X., Zhang Y. , Wang D.D., Zhang J.M. J. Mole. Struct. (THEOCHEM), 2010, 956:77 [28] Sun Q., Selloni A., Myers T.H., Alan Doolittle W. Phys. Rev. B., 2006, 73:155337
[29] Sun Q., Selloni A., Myers T.H., Alan Doolittle W. Phys. Rev. B., 2006, 74:195317 [30] Rosa A.L., Neugebauer J. Phys. Rev. B., 2006, 73:205314
[34] Rezaei-Sameti M., Behbahani H. J. Phys. Chem. Res., 2018, 6:31 [35] Rezaei-Sameti M., Zanganeh F. J. Sulfur. Chem., 2017, 38:384 [36] Becke A.D. J. Chem. Phys., 1993, 98:5648
[37] Lee C., Yang W., Parr R.G. Phys. Rev. B., 1988, 37:785
[38] Yanai T., Tew D.P., Handy N.C. Chem. Phys. Lett., 2004, 393:51
[39] Frisch M.J., et al. Gaussian 09, Revision D.01, Gaussian, Inc., Wallingford CT, 2009 [40] Boys F.S., Bernardi F. Mol. Phys., 1970, 19:553
[41] James C., Amalraj A., Reghunathan R., Hubert Joe I., Jaya Kumar V.S. J. Raman. Spect., 2006, 37:1381 [42] Parr R.G., Pearson R.G. J. Am. Chem. Soc., 1983, 105:7512
[43] Jensen W.B. J. Chem. Educ., 1996, 73:11
[44] Morell C., Labet V., Grand A., Chermette H. Phys. Chem.Chem. Phys., 2009, 11:3417 [45] Pearson R.G. J. Org. Chem., 1989, 54:1423
[46] Zhou Z., Parr R.G. J. Am. Chem. Soc., 1990, 112:5720 [47] Faust W.L. Science., 1989, 245:37
[48]Pearson R.G. J. Am. Chem. Soc., 1985, 107:6801
[49] Parr R.G., Chattaraj P.K. J. Am. Chem. Soc., 1991, 113:1854
[50] Glendening E.D., Reed A.E., Carpenter J.E., Weienhold F.NBO, Version 3.1. University of Wisconsin, Madison, 1996
[51] Murray J.S., Sen K., Molecular electrostatic potentials conceptsand applications. Elsevier, Amsterdam, 1996
[52] Bader R.F.W., Atoms in Molecules: A Quantum Theory. Oxford University Press, New York 1990 [53] Contreras-Garcia J., Johnson E., Keinan S., Chaudret R., Piquemal J., Beratan D., Yang W. J. Chem.
Theory. Comput., 2011, 7:625
[54] Johnson E.R., Keinan S., Mori‒Sanchez P., Contreras‒Garcia J., Cohen A.J., Yang W. J. Am. Chem. Soc., 2010, 132:6498
How to cite this manuscript:
P. Hosseini, M. Rezaei‒Sameti*, The AIM, RDG, NBO, Quantum and
Structural Study of Adsorption of Phosgene Gas on the Surface of Pristine and Al, P Doped Ga12N12 NanoCluster: A DFT Method. Chemical Methodologies 3(5), 2019, 543-561. DOI: