Original Research Article
Incidence of adverse events after discharge from a secondary
hospital in northern Ghana
Inusah D. Iddrisu
1*, Akwasi Anyanful
2, Samuel V. Nuvor
3INTRODUCTION
Adverse events are ill health conditions that developed after patients are discharged from the hospital. The condition involves unintended injuries or complications resulting in death, disability, harm or prolonged hospital stay that arise from health care management.1-3 There are six key categories of adverse events identified and these included adverse drug events, procedural related adverse events, nosocomial infections, readmissions, deaths and others.4,6
About 20% of patients experienced adverse events within 3 weeks of discharge from the hospital.4 Annually, 421
million hospitalizations are recorded worldwide and approximately 42.7 million are associated with adverse events.5 Unfortunately, beside substandard care, discharge hazards are associated with a plan to complete the diagnostic procedures as an outpatient. All these place patients at risk unless timely and complete follow-up is ensured. Short hospital stay also worsen the occurrence of adverse events after discharged from the hospital facilities within few days.4 More importantly, systemic problems in care transitions seem to be at the root of most adverse events arising after discharge. Studies have shown that traditional communication systems generally fail to reach outpatient service providers in a timely fashion and often lack essential information.4 All these
ABSTRACT
Background: Adverse events involve unintended injuries or complications resulting in death, disability, harm or prolonged hospital stay that arise from health care management. This paper aims at giving insight into the incidence, types and severity of adverse events after hospital discharge in the context of the management/care patients received from the hospital.
Methods: A descriptive cohort study design was used in a secondary hospital in Ghana. The study population involved patients discharged from the medical, surgical and emergency wards of the Hospital. A total of 206 patients were recruited through a consecutive sampling technique.
Results: The findings revealed an adverse events rate of 25.7%. The study also identified adverse events related to medications to be the leading type of adverse events recorded after discharge from the hospital. There were 3.9% death rate among participants 21 days after discharge from the hospital. The study revealed that adverse events usually occur after discharge from the hospitals which differ in several forms and in severity.
Conclusions: These, therefore offer nurses and other service providers an opportunity to target the areas for improvement of services.
Keywords: Adverse events, Patients, Incidence, Care
1
Nursing and Midwifery Training College, Sunyani, Brong-Ahafo Region, Ghana
2School Medical Sciences, University of Cape Coast, Cape Coast, Ghana 3School of Nursing and Midwifery, University of Cape Coast, Cape Coast, Ghana
Received: 29 January 2019
Accepted: 02 March 2019
*Correspondence:
Mr. Inusah D. Iddrisu,
E-mail: [email protected]
Copyright: © the author(s), publisher and licensee Medip Academy. This is an open-access article distributed under the terms of the Creative Commons Attribution Non-Commercial License, which permits unrestricted non-commercial use, distribution, and reproduction in any medium, provided the original work is properly cited.
contributes to the development of adverse events in patients that can be prevented.
The complexity of services provided, technologies used, high degree of services request and multiple human resources involved in carrying out hospitals services are also implicated with their dramatic consequences upon the patients, medical staff and costs within the system.7 Adverse events during hospitalization is about 2.9% to 3.7% in the United States of America, 10.8% in the United Kingdom and 16.6% in Australia.8 These seem to vary among developed countries and it is possible that much higher rates will be occurring in the developing countries. Also the events in health care delivery system pose a significant threat to public health, since about 440,000 people die each year due to medical error in the United States alone.9 The report indicated that more people die from preventable adverse events in health care delivery system than from car accidents, diabetes, stroke, kidney disease, or Alzheimer’s disease in the United States and therefore has made medical error the third leading cause of death, aside cancer and heart disease. It is also estimated that, adverse events cost the United Kingdom £1 billion per year and approximately, two-thirds of all adverse events, and the disability-adjusted daily year’s loss occur in low-income and middle-income countries.4,9 In 2005, a study on hospital admissions carried out in Spain showed that 9.3% of patients experienced an adverse event, and of these 42.8% was preventable.8 Lack of access to medical care results into suffering of patients in many countries. In Ghana, challenges at the hospitals in terms of healthcare delivery systems may suggest the importance of critically evaluating the quality and safety of the care provided once a person accesses health services.
Even though empirical data on adverse events is rare in Ghana, it is important to note that adverse events occur on daily basis on the ward and at home resulting in readmissions, increased healthcare cost, and mortality among others. These results in law suits and attacks on staffs and property of hospitals leading to the loss of jobs.10 Frequent hospitalization in Ghana, causes high direct cost of illness among households especially with person(s) living with non-communicable diseases.11 The associated high indirect burden of illness also places undue stress on households which can be avoided with good standard care. This paper therefore seeks to determine the incidence of adverse events, the types and severity among patients after discharge.
METHODS
Research design
The study design was a descriptive cohort study using a sequential data collection method.
Research settings
The research setting was the Regional Hospital, Wa in the Upper West Region of Ghana. The projected population of the region was 771,394 with the growth rate of 1.9%.13 The hospital has 22 specialized units, however, nine (9) of these units holds admitted patients. The research focus was on adult health and therefore concentrated on seven (7) main units; these were female medical ward, female surgical ward, male medical ward, male surgical ward, fevers unit, infectious disease holding centre and emergency ward.
Population
The target populations of the study were patients admitted and discharged from the Regional Hospital, Wa. The accessible population comprised patients who were admitted and discharged from the Medical, Surgical and Emergency Wards of the hospital within 6th to 19th of January 2018.
Sampling technique
Selection of the study participants’ was done using consecutive sampling technique, using the whole accessible population as the sample for the study provided they meet the inclusion criteria.14 The participants were recruited at the point when the discharge decisions were made and a registered nurse informs him/her about the study and its importance. Those who consented to the study were then recruited. The numbers recruited per each ward were; Causality 87, Male Medical Ward 23, Male Surgical Ward 15, Female Medical Ward 38, Female Surgical Ward 24, Fevers Unit 13 and the Infectious Disease Holding Centre (IDHC) 6. Therefore the number of patients used for the study was 206.
Data instruments
The study employed two (2) main instruments and these were records review guide and structured interview guide. The records review guide comprised 17 items which, involved: the patient age, marital status, sex, occupation, educational status, addresses, ward, date of admission, date of discharge, diagnosis, oral medications, injectable medications, other procedures, referral to public health/Community Health Nurses, follow up information and telephone number.
With the structured interviews, there were lists of broad questions/topic guide addressed in the interview.12
Data collection
to record demographic data and hospital services provided. The patients were followed over 21 days after discharged from the hospital and the patients were visited or telephoned interview were carried out to determine whether the patients had any new or worsening symptoms after discharge. The severity of any such symptoms were assessed by finding out how the symptom affects the physical functioning and the patients attempt to help resolve the symptom, including the determination of the cause. Timing of the symptom in relation to the hospitalization was documented. Then date, location and reason for all hospital visits and hospital readmissions were recorded.
Data analysis
Patients were considered to have adverse outcome after discharge, when they had new or worsening symptoms, visit a physician or health-facility that was unscheduled, an emergency ward detention or readmission to hospital, or died. For such patients, information from the chart review, interviews and records of any post-discharge emergency detention or re-hospitalization were systematically summarized including time of onset, severity, health services used and resolution.
All outcome summaries were independently reviewed by three certified nurse clinicians. Each summary was rated with standard techniques from 1 to 6. For 4, the outcome was possibly due to treatment [50/50 chance] and was more likely due to treatment than to disease; 5, the outcome was probably due to treatment; and 6, the outcome was definitely due to treatment. If two (2) reviewers judged that the adverse outcome was likely or probably or definitely due to medical management (rating 4, 5 or 6), they were classified as adverse event. The three reviewers also independently rated the type and severity of all the adverse events.
Then counting and grouping of collected data, coding of responses, entering of responses into SPSS version 21, analyzing and discussing of data using a descriptive statistics technique with 95% confidence intervals (CIs).
Ethical consideration
Ethical clearance for the study was obtained from University of Cape Coast Institutional Review Board (ID –UCCIRB/CHAS/2016/12). Permission was also obtained from the Upper West Regional Health Directorate of Health Services, the hospital Director and the patients.
RESULTS
The purpose of this paper was to provide insight into the incidence, type and severity of adverse events in the context of the management and care patients received from the hospital.
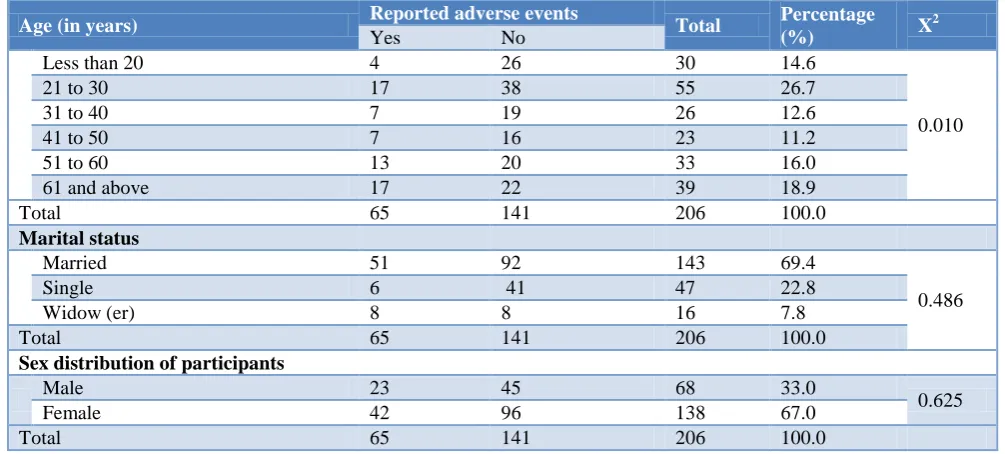
Table 1 shows a cross tabulation of reported adverse events and participants demographic factors. For the participants 20 years or below, 4 out of 30 reported an adverse event, 17 out of 55 participants reported with adverse events from those between the ages of 21 and 30, 7 among the 26 participants between the ages of 31 and 40 years also reported with adverse events. Another 7 out of 26 participants who also reported with adverse events were between the ages of 41 and 50, whereas 13 out of 33 participants were between the ages of 51 and 60 years and 17 out of the 39 participants were between 61 years and above. It was noted that age affect the development of adverse effect after discharge from the hospital (p=0.010).
Table 1: Cross tabulation of the reported adverse events and demographic factors (n=206).
Age (in years) Reported adverse events Total Percentage
(%) X
2
Yes No
Less than 20 4 26 30 14.6
0.010
21 to 30 17 38 55 26.7
31 to 40 7 19 26 12.6
41 to 50 7 16 23 11.2
51 to 60 13 20 33 16.0
61 and above 17 22 39 18.9
Total 65 141 206 100.0
Marital status
Married 51 92 143 69.4
0.486
Single 6 41 47 22.8
Widow (er) 8 8 16 7.8
Total 65 141 206 100.0
Sex distribution of participants
Male 23 45 68 33.0
0.625
Female 42 96 138 67.0
Age (in years) Reported adverse events Total Percentage
(%) X
2
Yes No
Occupation of participants
Farmer 17 27 44 21.4
0.010
House wife 2 6 8 3.9
Aged 11 5 16 7.8
Student 7 18 25 12.1
Trader 14 26 40 19.4
Artisans 3 18 21 10.2
Employees 8 22 30 14.6
Others 3 19 22 10.7
Total 65 141 206 100.0
Educational level of participants
Primary 6 21 27 13.1
0.140
JHS 8 11 19 9.2
SHS 1 18 19 9.2
Tertiary 11 25 36 18.0
None 39 66 105 50.5
Total 65 141 206 100.0
Source: Field Survey (2017); *Correlation is significant at the 0.01 level (2-tailed).
On marital status, 51 out of the 143 participants who were married reported with adverse events, whereas 6 out of the 47 participants who were single reported with adverse events. Interestingly, 8 widows (ers) out of the 16 reported with adverse events.
On sex, 23 males out of the 68 males who took part in the study reported with an adverse event, whereas 42 females out of the 138 also reported with an adverse event. Also the development of adverse effect was not influenced by the sex distribution of the participants (p=0.625). On occupation; out of the 44 farmers 17 reported with adverse events, 2 house wives out of 8, 11 aged out of 16, 7 students out of 25, 14 traders out of 40, 3 artisans out of 21, 8 employees out of 30 and for the others 3 participants reported with adverse events out of the 22 participants. The result showed occupation affect the development of adverse effect after discharge from the hospital (p=0.010).
For the educational status of the participants; 6 participants out of the 27 who had only primary education reported with adverse events, 8 participants out of the 19 who also completed JHS reported with adverse events, then for the SHS, 1 participant out of the 19 had adverse event. For the tertiary institution, 11 out of the 36 reported with adverse events and for those who did not have any form of formal education 39 out of the 105 participants had adverse events. In all, 65 events were reported within 21 days after discharged from the hospital. It was also noted that educational level did not influence the development of adverse effect after discharge from the hospital (p=0.140).
Table 2 shows the hospital wards in which participants were admitted. The ward with the highest number of
participants was the emergency ward with 42.2% (87) of the participants, followed by 18.4% (38) from the female medical ward, then 11.7% (24) from the female surgical ward and 11.2% (23) from the male medical ward. In effect close to half of the total participants were from the casualty/emergency ward, which comprised both sex groups of all age groups and a wide range of conditions and diagnosis. There were no significant difference among the wards of patients in the development of adverse events (p=0.193).
The duration of admission in days of participants on the hospital wards showed that over half of the participants representing 59.2% (122) spent between 1 to 3 days on the ward, 29.6% (61) of the participants also spent between 4 to 7 days on the ward. The rest 11.3% spent 8 days and above on the ward. There were also no significant differences in duration of admission of participants on the hospitals wards and the development of adverse events (p=0.708).
Table 2: Health services delivered at the hospital (n=206).
Health services Reported adverse events Total Percentage X2
Yes No
Hospital ward in which participants were admitted
Casualty/ Emergency 20 67 87 42.2
0.193
Male Medical Ward 10 13 23 11.2
Male Surgical Ward 6 9 15 7.3
Female Medical Ward 18 20 38 18.4
Female Surgical Ward 2 22 24 11.7
Fevers Unit 7 6 13 6.3
IDHC 2 4 6 2.9
Total 65 141 206 100.0
Duration of admission of participants
1 to 3 34 88 122 59.2
0.703
4 to 7 25 36 61 29.6
8 to 10 4 9 13 6.3
11 and above 2 8 10 4.9
Total 65 141 206 100.0
Diagnosis of participants
Malaria 0 17 17 8.3
0.776
Hypertension 4 13 17 8.3
Pneumonia 9 10 19 9.2
Peptic ulcer disease 5 8 13 6.3
Hernia 3 2 5 2.4
Road Traffic Accident 5 13 18 8.7
Ulcers 1 3 4 1.9
Meningitis 4 4 8 3.9
Asthma 0 4 4 1.9
URTI 0 1 1 0.5
Psychiatric disorders 0 6 6 2.9
Snake bite 5 6 11 5.3
Gastroenteritis 10 10 20 9.7
CCF/CKD 5 3 8 3.9
Oral condition 0 1 1 0.5
Diabetes 2 3 5 2.4
Urinary Tract Infection 2 2 4 1.9
Cellulitis 0 8 8 3.9
Acute abdomen 0 4 4 1.9
Migraine 0 1 1 0.5
Stroke 1 1 2 1.0
Pyelonephritis 2 3 5 2.4
Hepatitis 2 1 3 1.5
Intestinal Obstruction 0 2 2 1.0
Retrovirus/ PTB 1 4 5 2.4
Cancer 0 2 2 1.0
Burns 0 1 1 0.5
Home accidents 0 1 1 0.5
Lacerations 2 1 3 1.5
Appendicitis 0 1 1 0.5
Sprain 0 1 1 0.5
Arthritis 0 2 2 1.0
Chicken pox 1 0 1 0.5
Pulmonary Tuberculosis 1 1 2 1.0
Breast abscess 0 1 1 0.5
Health services Reported adverse events Total Percentage X2
Yes No
Oral medications on discharge for participants
Yes 65 141 206 100.0
-
Total 65 141 206 100.0
Injectable medication for participants
Yes 59 133 192 93.2
0.348
No 6 8 14 6.8
Total 65 141 206 100.0
Procedures performed on participants during admission
IV line 46 95 141 68.4
0.635
Major operations 1 1 2 1.0
Minor operations 1 1 2 1.0
Lumber puncture 0 1 1 0.5
Others 2 3 5 2.4
No procedure Performed 4 23 27 13.1
Intravenous line with other procedure 11 17 28 13.6
Total 65 141 206 100.0
Referrals for public health services on discharge of participants
Yes 2 5 7 3.4
0.864
No 63 136 199 96.6
Total 65 141 206 100.0
Follow-up Information
Yes 50 114 164 79.6
0.518
No 15 27 42 20.4
Total 65 141 206 100.0
Source: Field survey (2017); *Correlation is significant at the 0.01 level (2-tailed).
All the 206 participants representing 100% as at the time of discharge from the hospital wards were placed on various oral medications. However, almost all the participants (93.2%) were given injections on admission and only 6.8% received no injections.
Majority of the patients (68.4%) received intravenous fluids or medications, 13.6% of the participants were given intravenous fluid/medications with other procedures like lumber puncture, incision and drainage, and surgical operations. Therefore, over 82% of all admissions and discharges within the period of the data collection received intravenous fluid or intravenous medications with its associated side effects or adverse events. Only 13.1% of the participants did not under go any invasive procedure. There were also no statistical differences between patients who underwent some procedures and the participants who did not during admission at the hospital (p=0.635).
About 96.6% of all discharged participants were not referred to the public health or community health nurses for continuity of care at the community level. The remaining 3.4% were referred verbally to the Community Health Nurses for continuity of care at the community level. This meant that the lack of referral of treated patients from the hospital to the community health nurses or community health planning services (CHPS) showed
lack of linkages between the curative health services and preventive health delivery system though there was no significant statistical differences between those who were referred and not referred (p=0.864).
Lastly, majority (79.6%) of participants were given follow-up information at the point of discharge. The remaining 20.4% were not given any information on follow-up services. However, the follow-up information did not make any statistical difference among the participants (p=0.518).
The incidence of adverse events after discharge
As part of a comprehensive empirical assessment of malpractices within the nursing and medical care, several studies in various parts of the world including this study have estimated the rates of adverse events and the subgroups of these adverse events caused by management and care of hospitalized patients 15. These results are explained in the context of both quality assurance and patient safety.
between patients with events and the patients without events.
Table 3: Participants with events after discharged from hospital (n=206).
Reported events Frequency % X2
Reported events 65 31.6
0.742
No events 141 68.4
Total 206 100.0
Source: Field Survey (2017); *Correlation is significant at the 0.01 level (2-tailed).
Types of adverse events occurring after discharge (n=206)
Several studies categorized adverse events differently. Six key categories of adverse events have been identified and these were; adverse drug events, procedural related adverse events, nosocomial infections, readmissions, wounds, deaths and others.4
Table 4 shows the types of adverse events reported by participants 21 days after discharged from the hospital. Adverse drugs events recorded the highest incidence rate of 10.7% of the participants. This was followed by others with 8.3% adverse events reported which were not specified in the list, these included use of traditional medicine, receiving injections and other interventions that were not sanctioned by the hospital, then 3.9% by both re-admissions and deaths respectively, then 3.4% for nosocomial infections, 2.4% for wounds and 1.9% for procedural related events. It was noted that none of these adverse events was statistically significant (p>0.05).
Table 4: Types of adverse events reported (n=206).
Source: Field Survey (2017).
The severity of adverse events after discharge
The adverse events severity has been classified into the following themes; one (1) day of symptoms, several days of symptoms, non-permanent disability, permanent disability and deaths.
Table 5 shows the frequency distribution of the severity of adverse events reported by participants 21 days after
discharged from the hospital. Out of the different types, 18.8% of them had several days of symptoms of adverse events, this means that the participants reported several days of events which interfered with their physical functioning but did not produce disability. This was followed by non-permanent disability with 10.7%, which also means that the participants had several days of symptoms which produced some level of disability that were not permanent. Then 3.9% of the participants died within 21 days after discharge from the hospital. However, there were no reports of permanent disability among participants.
Table 5: Frequency distribution of the severity of adverse events (n=206).
Severity of adverse events Frequency % X2
One day of symptoms 3 1.5 0.016
Several days of symptoms 37 18.0 0.733
Non-permanent disability 22 10.7 0.209
Death 8 3.9 0.326
No adverse 136 66.0 -.
Total 206 100 -.
Source: Field Survey (2017)
DISCUSSION
Demographic characteristics of participants
Females were discharged from the hospital than the males but this did not influence the development of adverse effect. However, the aged and 20 and below years of age influenced the rate of reported adverse events. Interestingly, it’s revealed by other studies that factors significantly associated with adverse events included age 65 years or more.22 Others argued that there were no significant influences between age and adverse events.16 It is likely the development of adverse effect may be influenced by other factors apart from age which could not always be a predisposing factor.
Additionally, about two-thirds of patients who were admitted and discharged from the Regional Hospital, were married. However, being single influences the development of adverse events. This could possibly mean that unmarried participants may have received little or no assistance of care during and after discharge from the hospital which may lead to adverse effect. Interestingly, about half of the participants could not read nor write which meant that their ability to understand labels, some instructions and explanations of their conditions and treatments would be limited.17 Again, since more than half of the participants were not formally educated, they might not understand the practice of good hygienic care to avoid the development of adverse events at the hospital. There were also participants such as house wives, aged and students who were unemployed and therefore dependants on their relatives. This may likely affect their compliant to treatment and could lead to the development of adverse events.1,18,19,22,23
Types of adverse events Frequency % X2
Adverse drugs events 22 10.7 0.313
Procedural related
events 4 1.9 0.655
Nosocomial infections 7 3.4 0.600
Wounds 5 2.4 0.657
Re-admissions 8 3.9 0.546
Deaths 8 3.9 -.
Other types 17 8.3 0.399
No adverse events 135 65.5 -
Majority of the participants were from the casualty/emergency ward which was associated with a wide range of conditions and diagnoses. The major diagnoses were made up of both communicable and non-communicable diseases. However, the emergency ward did not influence the development of adverse events even though some studies suggested that the rise in the treatment of non-communicable diseases could result in more adverse events after discharge.9
On the services provided to participants, all the participants were given oral medications as well as injections. These drugs were found to have contributed to adverse events which were also identified as the major cause of adverse events after discharge from the hospital.1,6,24-26 Conversely, this study reported a nosocomial infection rate of 10.8%, which was lower than those reported many studies.1,6,24,27 The lower rates of nosocomial infections reported by this paper could be due to adequate infection prevention practices in the hospital.
The participants also received intravenous fluid or intravenous medications with its associated side effects or adverse events like infections and embolism, raising the possibility of more procedural adverse events. However, these procedures performed for patient during the hospitalization did not influence the rate of reported adverse events. Almost all discharged participants were not referred to the public health or community health nurses for continuity of care at the community level. This suggest lack of linkages between the curative health services and preventive health care delivery system in the upper west region.13 However, majority of the participants were given discharge information which means that patients were able to know when to return for review. However a lot of the patients resorted to other means of management when they did not experience improvements in their conditions instead returning to the hospital for reviews.
Initially, a reported event rate of 31.6% was recorded from participants 21 days after discharged from the Regional Hospital, Wa, this rate included reported events that were deemed not to be adverse events by the clinician reviewers. After the clinicians’ reviewers had reviewed these reported events according to the review criteria, an adverse events rate of 25.7% was found. However, in a large scale study the incidence of adverse events was estimated to be about 20%.28 Moreover, the rate identified in this study is higher than the rates reported by most studies in Europe and America. Majority (52.8%) of the reported events were several days of symptoms, this means that the participants reported events for several days which interfered with their physical functioning but did not produce disability. This was followed by non-permanent disability with 31.4%, which meant that the participants had several days of symptoms which produced some level of disability but
were not permanent disabilities, however, others found adverse events resulting in permanent disability.3,28 More importantly, this study reported a death rate of 3.9%, which occurred within 21 days after discharged from the hospital. Many studies reported that the severity of adverse events rate kept on increasing as it had increased to the third leading cause of deaths in the United State of America from the eighth reported by the Institute of Medicine in 2000.1,3,9
CONCLUSION
The adverse events rates reported by this study are of great concern that need considerable attention to improve service delivery, even though not all adverse events leads to deaths and vary from hospital to another.
This study highlighted the need to improve patient safety, by offering important data on critical aspect of hospital performance for the development of patient safety initiatives, discharge process and follow-up policy are very important in improving service delivery.
ACKNOWLEDGEMENTS
We acknowledged the people of the study area, especially, the patients who participated, staff and management of the Regional Hospital Wa who provided adequate responses to make the study a success.
We also extend our gratitude to the staff of the regional health directorate of the upper west region especially (Mr. Basadi) for their support and permission to use the regional hospital for the study.
Our sincere gratitude also goes to the members and administrator of the institutional ethical review board of the University of Cape Coast and the school of nursing and midwifery of university of cape coast.
Funding: No funding sources Conflict of interest: None declared
Ethical approval: The study was approved by the Institutional Review Board of the University of Cape Coast, Ghana (ethical clearance-ID – UCCIRB/CHAS/ 2016/12)
REFERENCES
1. Forster AJ, Clark HD, Menard A, Dupuis N, Chernish R, Chandok N, et al. Adverse events among medical patients after discharge from hospital. Can Med Assoc J. 2004;170(3):345-9. 2. Hanskamp-Sebregts M, Zegers M, Vincent C, Gurp
3. Baker T. Reconsidering the Harvard Medical Practice Study Conclusions About the Validity of Medical Malpractice Claims; 2005.
4. Cornish PL, Knowles SR, Marchesano R. Unintended medication discrepancies at the time of hospital admission. Arch Intern Med. 2005;165:424-9.
5. Jha AK, Larizgoitia I, Audera-lopez C, Prasopa-plaizier N, Waters H, Bates DW. The global burden of unsafe medical care : analytic modelling of observational studies. BMJ Qual Saf. 2013;22:809-15.
6. Masotti P, McColl MA, Green M. Adverse events experienced by homecare patients: A scoping review of the literature. Int J Qual Heal Care. 2010;22(2):115-25.
7. Angheluta C. Adverse events – dangerous but preventable. Manag Heal. 2010;14(4):23-9.
8. Chaboyer W, Thalib L, Foster M, Ball C, Brent R. Predictors of Adverse Events in Patients After Discharge From the Intensive Care Unit. Am J Crit Care. 2008;17(3):255-63.
9. Gandhi T. National Patient Safety Foundation. Boston; 2016.
10. Emphram E. KATH Missing Baby: Suweiba Threatens to Invoke Curses on Midwives. The Daily Graphic. 2014: 11.
11. Tagoe HA. Household Burden of Chronic Diseases in Ghana. Ghana Med J. 2012;46(2):54-8.
12. Polit DF, Beck CT. Nursing Research: Appraising Evidence for Nursing Practice. 7th ed. London: Lippincotts Williams & Wilkins; 2010.
13. Ofosu W. Upper West Regional Health Service. 2016.
14. Mustafa A. Research Methodology. 3 Ed. Delhi: AITBS Publishers; 2015.
15. Larouzee J, Guarnieri F. From Theory to Practice : Itinerary of Reasons’ Swiss Cheese Model From Theory to Practice : Itinerary of Reasons ’ Swiss Cheese Model. (Podofillini L, Sudret B, Stojadinovic B, Enrico ZioKr, AndWolfgang O, eds.). Zurich, Switzerland: CRC Press; 2015. 16. Miller KA. Understanding the Relation Between
Adverse Events, Patient Characteristics and Risk Factors Among Home Care Patients. 2012.
17. Greenwald JL, Denham CR, Jack BW. The Hospital Discharge: A Review of a High Risk Care Transition with Highlights of a Reengineered Discharge Process. J Patient Saf. 2007;3(2):97-106.
18. Ashbrook L, Mourad M, Sehgal N. Communicating discharge instructions to patients: A survey of nurse, intern, and hospitalist practices. J Hosp Med. 2013;8(1):36-41.
19. Baker GR, Norton PG, Flintoff V, et al. The Canadian Adverse Events Study: The incidence of adverse events among hospital patients in Canada. Can Med Assoc J. 2004;170(11):1678-86.
20. Traynor K. Adverse Events Occur After Hospital Discharge. Am J Heal Pharm. 2003;60(6).
21. Wet C De. An Overview of Patient Safety in Primary Care. Scotland; 2012.
22. Singh H, Ej T, Mm K, La P. Identifying Diagnostic Errors in Primary Care Using an Electronic Screening Algorithm. Arch Intern Med. 2007;167(3):9-10.
23. Wilkerson L, Blacketer MT. Reducing the burden of adverse drug events. The Kentucky Pharmacist. 2012;13(9):34–8.
24. Madigan, E. A. (2007). A Description of Adverse Events in Home Healthcare. The Journal for the Home Care and Hospice Professional, 25(3), 191– 197.
25. Sears JM., Wickizer TM, Franklin GM, Cheadle A. D, Berkowitz B. Expanding the role of nurse practitioners: Effects on rural access to care for injured workers. J Rural Health. 2008;24(2):171–8. 26. Kanaan AO, Donovan JL, Duchin NP, Field TS,
Tjia J, Cutrona SL, et al. Adverse drug events after hospital discharge in older adults: Types, severity, and involvement of beers criteria medications. J Ame Geriatr Society. 2015;61(11):1894–9.
27. Doran DEA. The nature and burden of safety problems among Canadian home care clients. Canadian Patient Safety Institute, 2009: 1–37. Available at: http://www.patientsafetyinstitute.ca/ English/research/commissionedResearch/SafetyinH omeCare/Documents/Doran/Full report - The Nature and Burden of Safety Problems Among Canadian Home Care Clients.pdf. Accessed on 3 January 2019.
28. Institute of Medicine. To Err is Human: building a safer health system. New York, 2000.