Original Research Article
A descriptive study to understand how severity of symptoms after
completion of treatment impact on the life of oral cancer patients
Sourav Goswami*, Subodh Saran Gupta
INTRODUCTION
Oral cancer is a significant public health problem in our country. Consumption of tobacco in the chewable form is the most important causal factor for the occurrence of this disease.1 Though it is a disease that can be detected early but due to poor knowledge, attitude and practice of the poor Indian masses, most of the tumors of oral region are diagnosed at a later stage.2 It accounts for over 30% of all
cancers in India. Age adjusted rate of oral cancer in India is high, that is, 20 per 100 000 population.3
According to WHO, quality of life is “an individual's perception of their position in life, in the context of the culture and value systems in their life and in relation to their goals, expectations, standards and concerns".4 Irrespective of tremendous improvement in the field of cancer diagnosis and treatment, oral cancer is still a disease, which shows a lower five-year survival rate, may ABSTRACT
Background: Oral cancer is a commonly occurring cancer among Indians, who are mostly habituated to chewing tobacco. It accounts for around 30–40% of all malignant tumors in India and has one of the lowest five years survival rates, as most of them are diagnosed in advanced stages. More so, after the treatment is completed, the patients’ still suffers from a number of symptoms, which are often not taken seriously. The objective of this study was to evaluate the impact of severity of symptomatology of oral cancer after completion of cancer treatment.
Methods: EORTC (European organization for research and treatment of cancer) H and N 35 questionnaire (Marathi version) was used to assess the severity of clinical symptoms. 100 consecutive patients of oral cancer who had completed their treatment and came for follow up after 1 to 3 months of treatment completion were enrolled for the study after taking informed written consent. The study was initiated after obtaining ethical approval from the institutional ethics committee. Statistical analysis was done using R software.
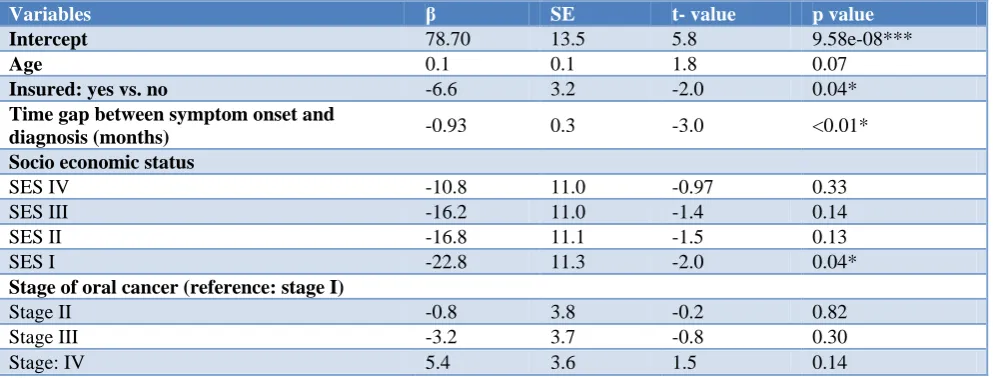
Results: Age of the patient, status of insurance, time gap between symptom onset and diagnosis, socio-economic status and stage of oral cancer were included in the final model of multivariate analysis. Time gap between symptom onset and diagnosis (in months) was also found to be associated significantly to head and neck symptoms. Participants from higher socio-economic status were found to have fewer head and neck symptoms and this association was found statistically significant.
Conclusions: Assessment of severity of symptomatology should be routinely practiced among patients who had completed their treatment and come for follow up. This needs to be followed by guidance and individualized interventions for improving the quality of life of the treated patients.
Keywords: Oral cancer, EORTC QLQ H and N 35, Symptoms, Quality of life Department ofCommunity Medicine, MGIMS, Sevagram, Wardha, Maharashtra, India
Received: 20 January 2019 Accepted: 01 March 2019
*Correspondence: Dr. Sourav Goswami,
E-mail: [email protected]
Copyright: © the author(s), publisher and licensee Medip Academy. This is an open-access article distributed under the terms of the Creative Commons Attribution Non-Commercial License, which permits unrestricted non-commercial use, distribution, and reproduction in any medium, provided the original work is properly cited.
be because of its late diagnosis.5 The treatment also results in tremendous pain and suffering, more so in the cancers occurring in the oral cavity, as oral cavity is associated with eating, speaking and also cosmetic soundness.6
The patients of oral cancer who have undergone the full treatment complains of a variety of symptoms like dryness of mouth, pain, drooling of saliva, problem in producing sound and talking and many more that severely affects their daily day to day life and significantly decreases their quality of life.7 Though the treating physicians prescribe symptomatic management, yet a detailed assessment of the severity of these symptoms lack behind. There are many studies conducted on the quality of life of oral cancer patients but very few of them worked on understanding the severity of symptomatology of the post treated oral cancer patients. That is the reason why we planned to conduct this study with the patients attending the hospital for their first follow up after the treatment completion using a self-administered EORTC QLQ H and N 35 (Marathi language) questionnaire.
METHODS
This is a cross sectional study. It was conducted in a tertiary care center of Wardha, Maharashtra. The study was continued from September 2015 to August 2017. The study population included the patients diagnosed histopathologically with squamous cell cancer of lip, tongue, buccal mucosa, alveolus and GB mucosa who came to the radiotherapy unit of the hospital for follow-up after 2 to 3 months of completion of their treatment.
Study subjects were recruited till a sample size of 100 was reached. This was adequate to report proportions with an error of 10%. A consecutive sampling approach was used till the desired sample size was achieved within the period of data collection. Sampling was done with replacement for non-response. Both males and females were enrolled for the study. We did not put any age barrier for selecting the study participants. Severely debilitated oral cancer patients who were not in a condition to fill up the questionnaire and those who did not give consent were excluded from the study. The questionnaire was mostly filled up by the study participants themselves and in few cases; the investigator helped them to clarify few of the terminologies used in the questionnaire. The caregiver was allowed to sit in the room where the study was undertaken but he/she was not allowed to prompt or give any hint or make any influence on the patients while marking the answers. Informed written consent was taken from each of the patients before recruiting them for the study. The patients attending the hospital understand Marathi, so we have adopted the Marathi version of the questionnaire that is freely available and is already validated.
EORTC developed this tool to provide an integrated approach for assessing the severity of clinical symptoms
of head and neck (oral) cancer.8 This tool comprised of 35 questions. This questionnaire incorporates seven multiple-item scales that assess the symptoms of pain, swallowing ability, senses (taste/smell), speech, social eating, social contact, and sexuality. Also included are six single-item scales, which survey the presence of symptomatic problems, associated with teeth, mouth-opening, dry mouth (xerostomia), sticky saliva, coughing, and feeling ill. All the questions ask about the head and neck symptoms experienced by the oral cancer patient during the past week. This questionnaire captured the impact of the disease on the psychosocial life of the oral cancer patients. It was chosen for this research, as it is one of the most widely implemented questionnaires, with over 10 years of research invested to develop an integrated, modular approach. All scales pertaining to the EORTC QLQ-H and N 35 range from 0 to 100. A high score for a symptom scale represents the presence of a symptom or problem/s.
EORTC QLQ-H and N 35 questionnaire used Likert scale, which we converted into a score from 0 to 100 using the following method that was already mentioned in the manual of EORTC questionnaires:
Step 1: calculation of the raw score (RS); in practical terms, if items II, I2, In are included in a scale then RS was calculated as RS= (II+I2+……In)/n
Step 2: a linear transformation method was used to standardize the RS so that the scores range from 0 to 100; in practical terms, if items II, I2, In are included in a scale the procedure is as follows:
The RS (raw score) was calculated as RS= (II + I2+……In)/n
The linear transformation was applied to 0–100 to obtain score S,
S= [{RS–(minimum score in the Likert scale)/range*} ×100
*Range is the difference between the maximum and minimum possible value of RS.
This technique has been designed so that all items in any scale take the same range of values (0 to 100). Therefore, the range of RS equals the range of the item values.
Data entry was done in EPI INFO version 7 and analysis was done using R.9,10 The study was initiated after obtaining approval from the institutional ethics committee.
RESULTS
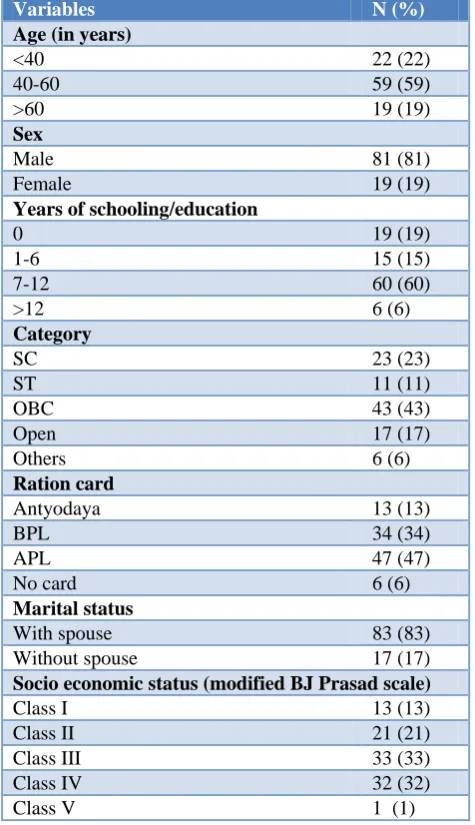
30–72 years), with majority of the study participants being male (81%). 83% of the patients stayed with their spouse and 48% of them stayed in nuclear families. We have noted the years of schooling of the study participants and it was found that 19% of them did not go to school ever, while 15% of them studied till class six. Majority of the participants studied for 7 to 12 years and only 6% of them ever went to college.
Table 1: Characteristics of patients (n=100).
Variables N (%)
Age (in years)
<40 22 (22)
40-60 59 (59)
>60 19 (19)
Sex
Male 81 (81)
Female 19 (19)
Years of schooling/education
0 19 (19)
1-6 15 (15)
7-12 60 (60)
>12 6 (6)
Category
SC 23 (23)
ST 11 (11)
OBC 43 (43)
Open 17 (17)
Others 6 (6)
Ration card
Antyodaya 13 (13)
BPL 34 (34)
APL 47 (47)
No card 6 (6)
Marital status
With spouse 83 (83)
Without spouse 17 (17)
Socio economic status (modified BJ Prasad scale)
Class I 13 (13)
Class II 21 (21)
Class III 33 (33)
Class IV 32 (32)
Class V 1 (1)
On the basis of monthly per capita income, the study population were divided into five income groups as per modified BG Prasad classification, where we found 13%, 21%, 33%, 32% and 1% of the population were from were from upper (per capita monthly income>6253 INR), upper middle (per capita monthly income 3127-6253 INR), middle (per capita monthly income 1876–3126 INR), lower middle (per capita monthly income 938– 1875 INR) and lower class (per capita monthly income<938 INR) respectively.
In this study we have included patients diagnosed with squamous cell carcinoma of lip, tongue, buccal mucosa, gingiva-buccal mucosa and alveolar cancer as shown in Figure 1, where majority of the participants of both sexes were suffering from cancer of buccal mucosa. All four stages of oral cancers were included in our study where we found 13%, 23%, 23% and 41% were in stage I, II, III and IV respectively.
Figure 1: Distribution of different types of oral cancer among the study subjects (n=100).
Table 2 shows the calculated scores for the EORTC H and N 35 for the different symptoms of oral cancer. In this head and neck module, having pain in the mouth, dry mouth, feeling ill, difficulty in opening mouth, and having sticky saliva are the worst problems. All the oral cancer patients included in the study complained of pain in the mouth during the past week for which they had to use analgesics. Figure 2 displays the findings of the head and neck symptom scores.
Figure 2: Boxplot showing head and neck symptom score.
Table 2: Calculated scores of EORTC H and N 35 for the oral cancer patients (n=100).
Scales Mean (SD)
Median
(IQR) Range
Pain (HNPA) 66.±18.8 66.7 (56.2, 83.3)
25.0-100.0 Swallowing
(HNSW) 60±23.4
58.3 (47.9, 75)
0.0-100.0 Senses problem
(HNSE) 31.8±26
58.3 (47.9, 75)
0.0-100.0 Speech problem
(HNSP) 72.±23.5
77.8 (55.6, 88.9) 0.0-100.0 Trouble with social eating (HNSO)
62.2±17.8 58.3 (50.0, 75) 25.0-100.0 Trouble with social contact (HNSC)
67±23.8 73.3 (53.3, 86.6)
6.7-100.0
Less sexuality
(HNSX) 75.5±29.1
83.3 (66.7, 100)
0.0-100.0
Teeth (HNTE) 41.3±37 33.3 (0.0, 66.7)
0.0-100.0 Opening mouth
(HNOM) 79.±29.4
100.0 (66.7, 100)
0.0-100.0 Dry mouth
(HNDR) 84±20.9
100.0 (66.7, 100)
33.3-100.0 Sticky saliva
(HNSS) 78.7±24.8
83.3 (66.7, 100)
0.0-100.0 Coughing
(HNCO) 47±35.8
66.7 (00.0, 66.7)
0.0-100.0 Feeling ill
(HNFI) 80.3±25.5
100.0 (66.7, 100)
0.0-100.0 Pain killers
(HNPK) 86±34.8
100.0 (100, 100) 0.0-100.0 Nutritional supplements (HNNU)
40±49.2 0 (0, 100)
0.0-100.0
Feeding tube
(HNFE) 28±45.1
0 (0, 100)
0.0-100.0 Weight loss
(HNWL) 61±49
100 (0, 100)
0.0-100.0 Weight gain
(HNWG) 39± 49
0 (0, 100)
0.0-100.0 SD: standard deviation; IQR: inter quartile range.
Patients of oral cancer were treated with combinations of surgery, radiotherapy, chemotherapy and palliative therapy. None of the included study participants were treated by single treatment modality. Table 4 shows the distribution of treatment pattern among the 100 oral cancer patients according to the stage of the disease. We found that 62% of the patients were treated by combination of surgery, chemotherapy and radiation therapy and this combination was mostly used for the stage IV cancer patients. 10 patients (10%) received combination of chemotherapy and radiotherapy and 10 patients (10%) received combination of radiation therapy
and surgery. Palliative therapy was used in 18% of the patients, where it was advanced oral cancer only, that is stage III and IV disease. The mean duration of completion of treatment (gap between completion of treatment and interview) of oral cancer patient was found to be 3 months. The last column shows the change in the H and N symptom scores as per the change in treatment modalities. The head and neck symptom score were found to be highest in the patients who received combination of chemotherapy, radiotherapy, surgery and palliative therapy. Table 5 shows the correlations between the different head and neck scores used in EORTC QLQ H and N 35.
Figure 3: Stage wise different EORTC H and N 35 score.
Table 3: Comparison of head and neck scores with site of cancer occurrence.
Cancer site Lip Tongue Buccal mucosa GB mucosa Alveolus
Head and neck symptom score
(Mean±SD) 54.6±9.9 58.7±11.7 55.7±13.7 64.2±13.2 60.6±12.9
SD: Standard deviation.
Table 4: Distribution of oral cancer patients of all the stages as per the treatment received and their respective head and neck symptom score.
Treatment combination Stage
Head and neck symptom score
I II III IV Total
CT RT 00 04 03 03 10 59.9±10.6
RT+SX 03 03 02 02 10 60.7±7.7
CT+RT+SX 10 16 12 24 62 61.3±12.4
CT+RT+Pall 00 00 03 06 09 58.6±14.4
RT+SX+Pall 00 00 02 02 04 56.6±14.3
CT+RT+SX+Pall 00 00 01 04 05 63.7±10.1
CT: Chemotherapy, RT: radiotherapy, SX: surgery, Pall: palliative therapy.
Table 5: Correlation between the head and neck symptom scores (EORTC QLQ H and N 35).
HNPA HNSW HNSE HNSP HNSO HNSC HNSX HNTE HNOM HNDR HNSS HNCO HNFI HNPK
HNPA 1.00
HNSW 0.51 1.00
HNSE 0.20 0.36 1.00
HNSP 0.28 0.29 0.09 1.00
HNSO 0.21 0.35 0.08 0.51 1.00
HNSC 0.31 0.33 0.07 0.70 0.54 1.00
HNSX 0.05 0.27 0.10 0.45 0.32 0.47 1.00
HNTE 0.14 0.34 0.39 0.03 0.06 0.02 0.04 1.00
HNOM 0.10 -0.00 -0.23 0.16 0.01 0.21 0.02 -0.19 1.00
HNDR 0.18 0.16 0.00 0.28 0.22 0.40 0.32 -0.09 0.32 1.00
HNSS 0.34 0.21 0.08 0.02 0.10 0.13 0.20 -0.12 0.24 0.35 1.00
HNCO 0.16 0.33 0.38 0.45 0.21 0.22 0.32 0.28 -0.25 0.07 -0.07 1.00
HNFI 0.14 0.20 0.19 0.43 0.31 0.35 0.44 0.08 0.10 0.30 0.02 0.24 1.00
HNPK 0.12 0.11 0.10 0.22 0.18 0.32 0.12 0.03 0.02 0.15 0.11 0.08 0.10 1.00
Table 6: Multivariate analysis for head and neck symptom score of oral cancer patients.
Variables β SE t- value p value
Intercept 78.70 13.5 5.8 9.58e-08***
Age 0.1 0.1 1.8 0.07
Insured: yes vs. no -6.6 3.2 -2.0 0.04*
Time gap between symptom onset and
diagnosis (months) -0.93 0.3 -3.0 <0.01*
Socio economic status
SES IV -10.8 11.0 -0.97 0.33
SES III -16.2 11.0 -1.4 0.14
SES II -16.8 11.1 -1.5 0.13
SES I -22.8 11.3 -2.0 0.04*
Stage of oral cancer (reference: stage I)
Stage II -0.8 3.8 -0.2 0.82
Stage III -3.2 3.7 -0.8 0.30
Stage: IV 5.4 3.6 1.5 0.14
DISCUSSION
According to Globocan, in India oral cancer is the second most common cancer in terms of mortality and morbidity among the males while it ranks third in occurrence both sexes combined. In our study, we found a male predominance of oral cancer.11 Other studies, e.g. Shavi et al in a study conducted in Bhopal found male: female ratio to be 4:1.12 According to the consolidated report of hospital-based cancer registry in India, like most other adult cancers, oral cancer occurs mostly in the older adults and in our study, around 60% of the patients were found to be in the age group of 40 to 60 years.13
Majority of the study participants included in our study were suffering from cancer of buccal mucosa followed by cancer tongue. This is in accordance with the findings of the study conducted by Shavi et al.12 Mathur et al explained the reason for increased occurrence of oral cancer in the buccal mucosa and tongue in both sexes.14 Buccal mucosa is the most obvious part inside oral cavity that comes in direct contact with the oral tobacco when it is being consumed. This raw tobacco, which is often consumed with raw lime is an irritant for the soft buccal mucosa that results in ulcer formation gradually leading to carcinomatous changes. Narwal et al in their epidemiological and clinico-pathological study of oral cancer patients in Haryana found increased occurrence of oral cancer in alveolus followed by buccal mucosa and tongue.15 According to their study betel quid is habitually put in alveolar region; i.e., in the inner aspect of the lips that causes a regular irritation resulting in cancer formation in the alveolar region.
Coelhi in his review article on the challenges of oral cancer burden in India stated that though oral cancer can easily be diagnosed by simple visual inspection, yet in India 60 to 80% of the patients present for the first time with advanced disease.16 This finding was in accordance with our study where 64% of the patients presented with advanced (stage III and IV) oral cancer disease.
Pain, fatigue, and insomnia were the most important complains recorded in EORTC questionnaire in our study; while dry mouth, sticky saliva, decreased opening of mouth and problems of feeding tube were other problems that the patients shared during their interviews.8 Different treatment modalities are available for oral cancer including surgery, radiation and chemotherapy and it depends upon stage of the disease. In advanced stage of the cancer, palliative therapy is required that may include supportive therapy including palliative radiotherapy and chemotherapy. Shuman et al studied the end of life care among head and neck cancer patients and stated that palliative therapy increases the end of life experience in the terminally ill cancer patients.17 Christopher et al found that each treatment option has its own advantages and side effects that have an impact on the psychosocial well-being of the patients.18 They found that patients who received chemo-radiation experienced
the lowest overall quality of life, those who had a combination of surgery and radiation experienced the highest reported pain; and those treated with only surgery experienced the highest overall quality of life. The study participants with advanced cancer who had received combination of surgery, chemotherapy, radiation and palliative therapy had high symptom scores.
CONCLUSION
Like any other cancers, patients of oral cancer also suffer from the adverse effects of radiation, chemotherapy and surgery, but the quality of life of the oral cancer patients are affected more severely as compared to any other cancer. The top symptoms that were reported after the completion of treatment were pain, fatigue and insomnia apart from dry mouth, problem in speaking and mouth opening. Many of the patients avoided the questions related to their sexual life.
The findings of this study gives us a ray of hope for improving the quality of life and better symptom management of the post treated patients of oral cancer. It can be done by routinely monitoring the symptomatology and assessing them using a valid tool, which should be followed by guidance and individualized interventions for improving the quality of life of the treated patients. A counseling center can also be set up by the side of the follow up clinic not only for the patients but also for their caregivers, that will provide them with adequate knowledge regarding the expected symptomatology of the oral cancer patients after their treatment has been completed and will also empower the caregivers with the basic first aid management skills.
Funding: No funding sources Conflict of interest: None declared
Ethical approval: The study was approved by the Institutional Ethics Committee
REFERENCES
1. Conway DI, Petticrew M. Socioeconomic inequalities and oral cancer risk: a systematic review and meta-analysis of case-control studies. Int J Cancer. 2008;122:2811-9.
2. Allgar VL, Neal RD. Sociodemographic factors and delays in the diagnosis of six cancers: Analysis of data from the 'National Survey of NHS Patients. British J Cancer. 2005;92:1971-5.
3. Gupta S, Singh R, Gupta OP, Tripathi A. Prevalence of oral cancer and pre-cancerous lesions and the association with numerous risk factors in North India: A hospital based study. Natl J Maxillofac Surg. 2014;5(2):142-8.
4. World Health Organization (1994) The WHO Health Promotion Glossary. World Health Organization, Geneva, Switzerland, 1998.
6. Morton RP, Izzard ME. Quality-of-life outcomes in head and neck cancer patients. World J Surg. 2003;27:884-9.
7. Kazi R, Cordova J. Quality of life following total laryngectomy: Assessment using the UW-QOL scales. ORL J Otorhinolaryngology Relat Spec. 2007;69:100-6.
8. Scott NW, Fayers PM, Aaronson NK, Bottomley A, De Graeff A, Groenvold M, et al. EORTC QLQ-C30 Reference Values. EORTC Qual Life Gr. Available at: https://pdfs.semanticscholar.org/71d3/ de2b6d58bf321da160a43a99777538a206d8.pdf%0 Ahttp://groups.eortc.be/qol/sites/default/files/img/ne wsletter/reference_values_manual2008.pdf. Accessed on 12 January 2019.
9. Centers for Disease Control and Prevention. Epi Info, 2016. Available at: https://www.cdc.gov/ epiinfo/index.html. Accessed on 12 January 2019. 10. Team RC. The R Project for Statistical Computing.
Available at: Http://Www.R-Project.Org/. Vienna, Austria; 2013. Available at: http://www.r-project.org/. Accessed on 12 January 2019.
11. Fitzmaurice C, Dicker D, Pain A, Hamavid H, Moradi-Lakeh M, MacIntyre MF, et al. The Global Burden of Cancer 2013. JAMA Oncol. 2015;1(4):505.
12. Shavi GR, Thakur B, Bhambal A, Jain S, Singh V, Shukla A. Oral Health Related Quality of Life in Patients of Head and Neck Cancer Attending Cancer Hospital of Bhopal City, India. J Int oral Heal JIOH. 2015;7(8):21–7.
13. Indian Council of Medical Research. Consolidated Report of Hospital Based Cancer Registries An
Assessment of the Burden and Care of Cancer Patients: 2012-14. Available at: http://www .ncrpindia.org/. Accessed on 12 January 2019. 14. Mathur PT, Dayal P, Pai KM. Correlation of
Clinical Patterns of Oral Squamous Cell Carcinoma with Age, Site, Sex and Habits. J Indian Acad Oral Med Radiol. 2011;23(2):81–5.
15. Narwal A, Devi A, Bharti A, Yadav, Bhogal A. Original Research Epidemiological and Clinico-Pathological Study of Oral Cancers in a Tertiary Care Teaching Hospital: An Institutional Study in Haryana. Int J Oral Maxillofac Pathol. 2014;5(3):2-6.
16. Coelho KR. Challenges of the oral cancer burden in India. J Cancer Epidemiol. 2012;2012:1–17. 17. Shuman A, Yang Y. End-of-life care among head
and neck cancer patients. Otolaryngol Head Neck Surg. 2011;144.
18. Christopher KM, Osazuwa-Peters N, Dougherty R, Indergaard SA, Popp C, Walker R, et al. Impact of treatment modality on quality of life of head and neck cancer patients: Findings from an academic medical institution. Am J Otolaryngol. 2017;38(2):168-73.