Published by Oriental Scientific Publishing Company © 2018
This is an Open Access article licensed under a Creative Commons Attribution-NonCommercial-ShareAlike 4.0 International License (https://creativecommons.org/licenses/by-nc-sa/4.0/ ), which permits unrestricted Non Commercial use, distribution and reproduction in any medium, provided the original work is properly cited.
Effect of Lifestyle Intervention on Medical Treatment Cost
and Health-Related Quality of Life in Type 2 Diabetes
Mellitus Patients
Girija Kumari1, 2, Vikram Singh1, 3, Ashok Kumar Jhingan2, Bimal Chhajer3 and Saurabh Dahiya1*
1Department of Pharmacy, Lingaya’s University, Faridabad (Haryana) 121002, India. 2 Department of Medicine, Delhi Diabetes Research Center, New Delhi (Delhi) 110027, India. 3Department of Preventive Cardiology, SAAOL Heart Center, New Delhi (Delhi) 110030, India.
*Corresponding author E-mail: saurabhdahiya@gmail.com
http://dx.doi.org/10.13005/bpj/1432
(Received: 09 April 2018; accepted: 28 April 2018)
Diabetes is a costly, lifestyle disorder which increases the burden of disease and deteriorates the Health-Related Quality of Life (HRQOL) of diabetes patients and this study was conducted to assess the effect of lifestyle intervention on medical treatment cost and HRQOL in type 2 diabetes mellitus (T2DM) patients. This quasi-experimental prospective study was conducted in Delhi Diabetes Research Center (DDRC), New Delhi and included 224 T2DM patients. Patients were divided into LMC and usual care group on the basis of receiving or not receiving lifestyle modification counseling. The follow-up of both groups was done at 6th and 12th months. Collected data were analyzed through IBM, SPSS software v 21 for mean, median (min-max), SD, t-test and Wilcoxon scores (rank sums) test. The results of this study showed a statistically significant reduction in diabetes medication costs, hospitalization and surgery costs in the LMC group as compared to the usual care group. The significant improvement was also observed in HRQOL domains which includes - physical functioning (62.40±6.738 to 83.67 ± 5.4920), physical health (35.30±22.069 to 64.50±13.62), emotional problem (37.90±28.93 to71.46±16.75), energy (54.31±11.858 to 80.75 ± 15.52), emotional well-being (63.06± 9.828 to 85.79±6.36), social functioning (38.848±20.805 to 65.54±8.39) and general health (54.51±11.679 to 82.398± 11.7) at 12th month follow up in LMC group. The ADS score also showed significant improvement in overall HRQOL of LMC group. This study concludes that lifestyle intervention may improve HRQOL and reduce medical treatment cost of T2DM patients.
Keywords: Lifestyle intervention; Health-Related Quality of Life; Type 2 Diabetes Mellitus; Appraisal scale of diabetes; Treatment cost, SF-36.
Diabetes mellitus (DM) is a non-infectious, silent, metabolic disorder, develops due to increasing age, obesity, unhealthy diet, physical inactivity, stress and consumption of tobacco1,4. Presently, more than 415 million people
are diabetic globally as per International Diabetes Federation (IDF) and this number is expected to increase to 642 million by 2040. Due to increasing
prevalence and, the high population, India has become the ‘Diabetic Capital’ of the world and having the second highest number (69.1 million) of diabetes patients after China2, 4. Diabetes is a
lower the quality of life of T2DM patients and increase the rate of morbidity and mortality3, 4.
The cost of diabetes treatment is increased due to long-term complications and co-morbidities, which exert enormous economic burden, both for the individual and the nation5. Diabetes is the most
common cause of death and disability around the world, caused due to secondary lifestyle and rapid globalization. Around 75% T2DM patients live in low and middle-income countries4. India is a low
and middle income developing country, where diabetes treatment cost is increasing day by day and patients faced the huge cost burden due to out of their pocket expenditure1, 5. The global economic
burden of diabetes is huge with an estimated approximately 673 billion US dollars annually in 2015, which constituted 12% of total expenditure for that year1,4.The public health expenditure on
diabetes is expected to rise to the US $ 595 billion in 2030 and the disease can be considered a risk for the world6,7.
WHO defined that health is not only the absence of disease and frailty in the body but also physical, mental and social well-being, must be present in a healthy person. The HRQOL is an important health outcome and used to assess the physical and mental health status of a person8. The
relationship between HRQOL and the number of chronic complications found a trend towards poorer
HRQOL if co-morbidities increased9, 10. Poor
QOL of patients occurred due to non-adherence to medication and self-management, which leads to uncontrolled diabetes and increased the risk of fetal complications 11. A study demonstrated
that diabetes can affect QOL in many ways: psychologically, physically, financially and socially7.
Medical treatment costs and HRQOL have shown a direct relationship. Diabetes treatment cost will be higher if the duration and number of complications due to diabetes increased,
HRQOL of patients deteriorates12, 13. A survey
done by Piette et al found that 30% of patients had difficulties in paying diabetes medication
costs due to out-of-pocket money14 and other
study revealed that out-of-pocket costs were due to diabetes-related complications and co-morbidities and experienced worse diabetes outcomes with
poor QOL15. Lifestyle modification counseling
(LMC) is the key component to achieve better
glycemic control, improve HRQOL and reduce diabetes treatment cost due to the reduction of complications16. Educated diabetic patients can
develop the skills that allow them to cope with diabetes and its related complications17. Hence,
Lifestyle modification counseling generally used as an intervention is a novel, cost-effective, non-invasive method to manage T2DM and decrease the rate of complications. LMC includes- education about self-management, healthy diet, physical activity, tobacco and smoking cessation, stress management counseling with routine medical checkups and medication adherence counseling. The purpose of this study was to assess the effect of lifestyle intervention on medical treatment cost and health-related quality of life in T2DM patients.
MATERIALS AND METHODS
This hospital-based quasi-experimental, prospective study was conducted in DDRC New Delhi. In this study, total 224 T2DM patients were enrolled based on consecutive sampling technique. The study participants were allocated to LMC group and the usual care group on the basis of patients receiving or not receiving lifestyle modification counseling. LMC group received lifestyle modification counseling with standard care (pharmacological treatment) while usual care group received only pharmacological treatment. The study was conducted in two phases. In the first phase planning, preparation for counseling components and recruitment of participants was done and in the second phase the implementation of counseling, data collection, follow-ups, and data analyses.
Eligibility criteria
year and having the mental disorder, visual, hearing problems and unwilling to give written consent.
Recruitment of study participants
Total 224 T2DM patients were enrolled as they fulfilled study eligibility criteria. The total duration of the study was 2 years (2015 to 2017) with one-year follow-up. The sample size (n=224) was calculated with an allowable error of 20% and 5% level of significance using below given standard formula.
Where p= (p_t±p_s)/2, pt is the proportion of LMC group and ps is the proportion of usual care group.
Lifestyle intervention
Lifestyle modification counseling was used as an intervention tool for participants to prevent and control T2DM. The counseling program was initiated in two phases. The first six months of the study were active period and next six months of the maintenance period, i.e. Interventional counseling was provided to the participants for previous 6 months. The LMC sessions were provided by an experienced and qualified dietitian, physical trainer and diabetes educator, under the supervision of senior diabetologist. The following five lifestyle components were explained in local language, with the help of pictures, videos and discuss with participants and the group of the participant. Lifestyle modification counseling (intervention) was repeated at every month for 6 months and follow up with the participants were done at 6th and 12th month.
Key components of the intervention Balanced diet
A qualified and experienced dietician encouraged participants to cut down high-calorie foods and advised to increase the number of fibrous foods (whole grain, green vegetables, and fruits). Participants were advised to adhere to the diet chart prescribed by the dietitian.
Physical activity
Participants were motivated by a physical trainer to increase their physical activities, i.e. brisk walk for at least 30 minutes per day and to do daily yogic exercises for at least 30 minutes (Yoga- Mudrasana, Balasana, Vajrasana, Paschimottanasana, Ardha Matsyendrasana, Supta Vajrasana, Dhanurasana, Shavasana).
Tobacco and alcohol cessation
Participants were motivated to quit tobacco (smoking and chewing tobacco) and alcohol at every counseling session. They were educated about the harmful effects of tobacco and alcohol.
Stress management
Participants were encouraged to do daily meditation and breathing exercise at least for 15 minutes to control stress and advice were given to take proper sleep.
Adherence to routine medical checkups & Medications
Diabetologist advised the participants to adhere on routine medical checkups (the clinical assessment with blood sugar fasting, PP, HbA1c, lipid profile) and regular medications without skipping.
Usual care group
Participants of the usual care group received only standard treatment. In addition, they were also provided the pamphlets and booklets for self-management of diabetes. A diary was provided to record their weight, diets, physical activities and other blood test results as it was also provided to LMC group.
Measurements
Demographic and socioeconomic details (Age, sex, locality, medical history, education, occupation, monthly income and socioeconomic status) of both the groups had been done at baseline.
Treatment cost assessment
The cost of medical treatment for diabetes and its related complications was analyzed through diabetes and its related complications questionnaire.
Health-related quality of life (HRQOL)
limitation, emotional limitation, vitality, emotional well-being, social functioning, body pain and general health18. The eight domains were scored
from 0 to 100 indicating worst to best possible health.
ADS is a diabetes-specific scale to assess QoL of diabetes patients have 7 items covering domains; stress due to diabetes, uncertainty, control over diabetes (2 questions), predictable future deterioration, coping skill and diabetes effect on life goals. The total score can range from 0 to 35. Thus, the lower score on ADS scale suggests better QOL19.
Statistical analysis
Statistical package for the social sciences (SPSS) software version 21 was used for all statistical analyses. Participants’ demographic and socioeconomic measurements were compared between groups using independent t-test. Descriptive analysis (Mean, Median (Min-Max), SD), Chi-square, sample paired and independent t-test was used to analyze data with 95 % confidence interval and a significant p-value less than 0.05. Medical treatment cost was assessed through Wilcoxon scores (rank sum) test to calculate p-value as data was not normally distributed.
Ethical approval and consent
Ethical clearance for this study was obtained from DDRC, New Delhi, and SAAOL Heart Center (Ref. No. IEC/SHRF/ PhD/P-01/29.04.2016), New Delhi. Written informed consent was obtained from all study participants before initiation of the study.
RESULTS
Recruitment and response rates of the participants
Total 312 type 2 diabetes mellitus patients were screened from DDRC, New Delhi. 224 participants were enrolled as they fulfill study eligibility criteria and agree to complete follow-up. Remaining 88 patients were excluded because 12 patients were having diabetes for less than one year, 27 patients refused to give consent, 33 refused to participate and follow-ups and 16 patients were having time commitment difficulty. Patients were allocated to LMC and the usual care group. Each group had 112 patients. 10 patients did not complete 12-month study follow-ups from LMC
group and 12 patients from the usual care group were excluded because patients did not complete follow-ups. Finally, 202 (n=100 in the usual care group and n=102 in LMC group) patients have completed the whole study with 6 and 12- month follow-up. A summary and study overview is given in Figure 1.
Baseline characteristics of participants
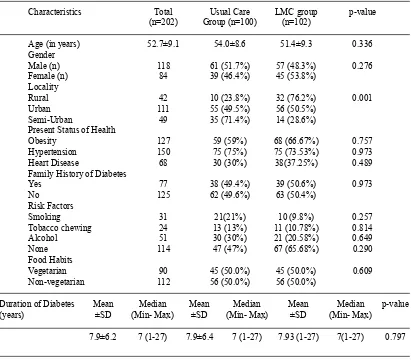
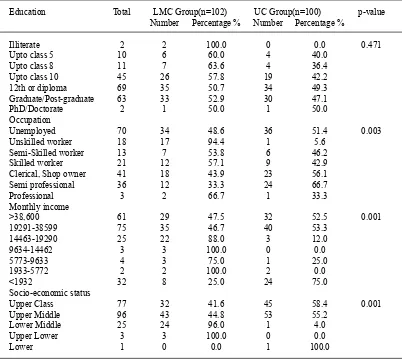
The mean (SD) age of the participants was 52.7±9.1years with age range from 35 to 70 years. The number of male participants was higher 118 (58.4%) than females 84 (41.6%). A larger number of participants were from urban (111) area as compared to rural and semi-urban 42 and 49 respectively. Patients were from the various types of occupations, most of the patients were unemployed (retired and females) (70) followed by clerical/shop owner (41). A statistically significant difference was found in income-group and most of the patients were from the income group of 19291-38599 INR followed by income group of >38,600 INR. The majority of patients were suffering from obesity (127) and hypertension (150) followed by heart disease (68). In this study, 77 patients were having a family history of diabetes and half (50%) of patients were non-vegetarian. Total 51 patients were consuming alcohol followed by tobacco chewing in 24 patients, 31 were the smoker, and no statistical difference was observed in the LMC and the usual care group. The baseline characteristics and socioeconomic profile of study subjects are presented in Table 1 & 2.
Cost analysis of various expenditures of diabetes and diabetic complications
At 12 month follow up, the result of the present study reveals that the LMC group (9627.5 ± 1938.4) spends less money on diabetes medicine as compared to the usual care group (10534.0 ± 2169.4) with significant p-value 0.0038.The surgery cost of usual care group (9212.0 ± 17464) was higher due to diabetes complications as compared to the surgery cost of LMC group patients (3186.3 ± 10595) with significant difference p 0.0046. The average hospitalization cost of usual care group (39580 INR) was approximately four times higher as compared to LMC group (10569 INR). The average mean (SD) of some variables including; other expenses for diabetes (340.0
± 573.7 vs 173.5 ± 359.0), diabetes neuropathy
Table 1. Baseline demographic characteristics of study participants
Characteristics Total Usual Care LMC group p-value (n=202) Group (n=100) (n=102)
Age (in years) 52.7±9.1 54.0±8.6 51.4±9.3 0.336 Gender
Male (n) 118 61 (51.7%) 57 (48.3%) 0.276 Female (n) 84 39 (46.4%) 45 (53.8%)
Locality
Rural 42 10 (23.8%) 32 (76.2%) 0.001
Urban 111 55 (49.5%) 56 (50.5%) Semi-Urban 49 35 (71.4%) 14 (28.6%) Present Status of Health
Obesity 127 59 (59%) 68 (66.67%) 0.757 Hypertension 150 75 (75%) 75 (73.53%) 0.973 Heart Disease 68 30 (30%) 38(37.25%) 0.489 Family History of Diabetes
Yes 77 38 (49.4%) 39 (50.6%) 0.973
No 125 62 (49.6%) 63 (50.4%)
Risk Factors
Smoking 31 21(21%) 10 (9.8%) 0.257
Tobacco chewing 24 13 (13%) 11 (10.78%) 0.814 Alcohol 51 30 (30%) 21 (20.58%) 0.649
None 114 47 (47%) 67 (65.68%) 0.290
Food Habits
Vegetarian 90 45 (50.0%) 45 (50.0%) 0.609 Non-vegetarian 112 56 (50.0%) 56 (50.0%)
Duration of Diabetes Mean Median Mean Median Mean Median p-value (years) ±SD (Min- Max) ±SD (Min- Max) ±SD (Min- Max)
7.9±6.2 7 (1-27) 7.9±6.4 7 (1-27) 7.93 (1-27) 7(1-27) 0.797
hypertension medicines cost (257.8 ± 429.6 vs
173.8 ± 267.2), diabetes retinopathy expenses (39.0 ± 390.0 vs 14.7 ± 106.6), foot complication related treatment cost (305.5 ± 976.1 vs 137.8 ± 483. 2) showed mean change, but that did not reach to the statistically significant level. Whereas LMC group spend more money on doctor’s consultation fees for diabetic complications because of the LMC group participants have more diabetic complications. Travel cost, laboratory cost, diabetes complications diagnostics cost and heart disease medicines cost were slightly higher in the LMC group because of the higher number of heart disease patients present in the LMC group as compared to the usual care group. Details of the results are given in Table 3.
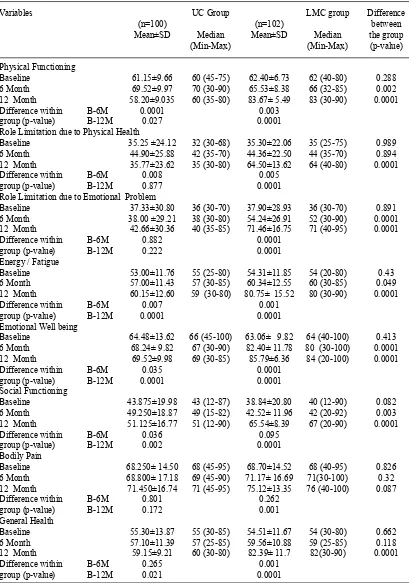
Effects of lifestyle intervention on health-related quality of life
On the assessment of the SF-36 questionnaire after 6 months, the LMC group
significant outcomes (p-value less than 0.05) as compared to the usual care group. There was no significant improvement has been observed in bodily pain (68.701±14.5295 to75.123±13.35) at 12 months follow up. Details are given in Table 4.
As per as ADS score, patients of the LMC group showed statistically significant
improvement at 6 months in all variables except in the first parameter (distress caused by diabetes). At 12 month follow up after lifestyle modification counseling most of the patients of LMC group showed significant improvement in all domains including distress caused by diabetes, uncertainty due to diabetes, control over diabetes, anticipated
Table 2. Baseline socioeconomic profile of study participants
Education Total LMC Group(n=102) UC Group(n=100) p-value Number Percentage % Number Percentage %
Illiterate 2 2 100.0 0 0.0 0.471
Upto class 5 10 6 60.0 4 40.0
Upto class 8 11 7 63.6 4 36.4
Upto class 10 45 26 57.8 19 42.2
12th or diploma 69 35 50.7 34 49.3
Graduate/Post-graduate 63 33 52.9 30 47.1
PhD/Doctorate 2 1 50.0 1 50.0
Occupation
Unemployed 70 34 48.6 36 51.4 0.003
Unskilled worker 18 17 94.4 1 5.6
Semi-Skilled worker 13 7 53.8 6 46.2
Skilled worker 21 12 57.1 9 42.9
Clerical, Shop owner 41 18 43.9 23 56.1
Semi professional 36 12 33.3 24 66.7
Professional 3 2 66.7 1 33.3
Monthly income
>38,600 61 29 47.5 32 52.5 0.001
19291-38599 75 35 46.7 40 53.3
14463-19290 25 22 88.0 3 12.0
9634-14462 3 3 100.0 0 0.0
5773-9633 4 3 75.0 1 25.0
1933-5772 2 2 100.0 2 0.0
<1932 32 8 25.0 24 75.0
Socio-economic status
Upper Class 77 32 41.6 45 58.4 0.001
Upper Middle 96 43 44.8 53 55.2
Lower Middle 25 24 96.0 1 4.0
Upper Lower 3 3 100.0 0 0.0
Lower 1 0 0.0 1 100.0
future deterioration, copying and effect of diabetes on life goals with statistically significant p values 0.05. Details of ADS are given in Table 5.
DISCUSSION
Effect of lifestyle intervention on diabetes medical treatment cost
Present study observed that patients in the usual care group who did not receive lifestyle modification counseling, spent more money on diabetes medicines as compared to LMC group and a significant difference has been observed with significant p-value 0.0038, similar finding of hospitalization cost with significant difference p-value 0.0111 and surgery cost due to diabetes complications was higher in the usual care group with significant difference p-value
0.0046 as compared to LMC group. The average hospitalization cost of usual care group (39580 INR) was approximately four times higher as compared to LMC group (10569 INR). As per our study diabetes treatment cost assessment, it can be concluded that lifestyle modification counseling used as the intervention was cost-effective therapy. Other similar lifestyle intervention studies done by Sevick et al, Upadhyay et al and Odnoletkova et al showed same evidence that lifestyle interventions were cost-effective among diabetes patients20-22. Studies done by Anne M et
al and Wolf RD et al provided the evidence that lifestyle intervention reduces the risk of diabetes complications, improves quality of life and did so without increasing health care costs, similar to present study23,24. A study by Png et al revealed
T
able 3.
Medical
T
reatment cost assessment at 12 months of usual care & LMC group of
T2DM patients
Expenditure (INR)
UC Group (n=100)
LMC Group (n=102)
p-value*
Mean ± SD
Median (Min-Max)
Mean ± SD
Median(Min-Max)
T
ravel Cost
1146.7 ± 520.5
875 (420-2170)
1200.39 ± 537.59
1455 (600-2350)
0.822
Laboratory cost
1099.2 ± 260.93
1120 (640-1920)
11
12.16 ± 291.28
1120 (620-1920)
0.739
Medicine cost
10534.0 ± 2169.35
10050 (6850-17200)
9627.45 ± 1938.42
9400 (5890-15400)
0.004
Hospitalization cost
80727.27 ± 85023.63
38000 (21000-42000)
43120 ± 55805.7
25000 (18500-48600)
0.01
1
Sur
gery Cost
41900 ± 14237.57
42500 (28500-45800)
361
11.1
1 ± 8922.5
38000 (26200-44700)
0.005
Other expenses for diabetes
880 ± 482.58
750 (560-1020)
737.5 ± 363.3
500 (400-1210)
0.104
Diabetes Complication – Doctor fees
3432.25± 1779.21
2400 (2200-6400)
4054.9 ± 1755.81
4000 (1820-7000)
0.087
Diabetes Neuropathy expenses
1650 ± 1369.91
1200 (800-2200)
1880 ± 315.52
1900 (820-2400)
0.882
Hypertension medicines cost
950 ± 1
17.59
950 (840-1060)
537.27 ± 155.04
540 (310-1
170)
0.632
Heart disease medicines cost
7593.75 ± 216.19
7550 (6900-8100)
6918.18 ± 144.59
7000 (6750-8000)
0.653
Diabetes Retinopathy expenses
900± 141.42
900 (720-1080)
750 ±212.13
750 (500-1
120)
0.504
Foot complication related treatment cost
3300 ± 141.42
3300 (3100-3820)
1756.25 ±345.82
1750 (1210-3600)
0.635
Diabetes Complications Diagnostics cost
1923.81 ± 871.15
1300 (1080-2040)
1894.54 ± 807.01
2100 (1250-2800)
0.551
*W
Table 4. Changes in SF-36 QoL of participant’s measurements from baseline to 6th and 12th month
follow-up with differences in within and between groups over time
Variables UC Group LMC group Difference
(n=100) (n=102) between Mean±SD Median Mean±SD Median the group
(Min-Max) (Min-Max) (p-value)
Physical Functioning
Baseline 61.15±9.66 60 (45-75) 62.40±6.73 62 (40-80) 0.288 6 Month 69.52±9.97 70 (30-90) 65.53±8.38 66 (32-85) 0.002 12 Month 58.20±9.035 60 (35-80) 83.67± 5.49 83 (30-90) 0.0001 Difference within B-6M 0.0001 0.003
group (p-value) B-12M 0.027 0.0001
Role Limitation due to Physical Health
Baseline 35.25 ±24.12 32 (30-68) 35.30±22.06 35 (25-75) 0.989 6 Month 44.90±25.88 42 (35-70) 44.36±22.50 44 (35-70) 0.894 12 Month 35.77±23.62 35 (30-80) 64.50±13.62 64 (40-80) 0.0001
Difference within B-6M 0.008 0.005
group (p-value) B-12M 0.877 0.0001
Role Limitation due to Emotional Problem
Baseline 37.33±30.80 36 (30-70) 37.90±28.93 36 (30-70) 0.891 6 Month 38.00 ±29.21 38 (30-80) 54.24±26.91 52 (30-90) 0.0001 12 Month 42.66±30.36 40 (35-85) 71.46±16.75 71 (40-95) 0.0001 Difference within B-6M 0.882 0.0001
group (p-value) B-12M 0.222 0.0001
Energy / Fatigue
Baseline 53.00±11.76 55 (25-80) 54.31±11.85 54 (20-80) 0.43 6 Month 57.00±11.43 57 (30-85) 60.34±12.55 60 (30-85) 0.049 12 Month 60.15±12.60 59 (30-80) 80.75± 15.52 80 (30-90) 0.0001
Difference within B-6M 0.007 0.001
group (p-value) B-12M 0.0001 0.0001
Emotional Well being
Baseline 64.48±13.62 66 (45-100) 63.06± 9.82 64 (40-100) 0.413 6 Month 68.24± 9.82 67 (30-90) 82.40± 11.78 80 (30-100) 0.0001 12 Month 69.52±9.98 69 (30-85) 85.79±6.36 84 (20-100) 0.0001 Difference within B-6M 0.035 0.0001
group (p-value) B-12M 0.0001 0.0001
Social Functioning
Baseline 43.875±19.98 43 (12-87) 38.84±20.80 40 (12-90) 0.082 6 Month 49.250±18.87 49 (15-82) 42.52± 11.96 42 (20-92) 0.003 12 Month 51.125±16.77 51 (12-90) 65.54±8.39 67 (20-90) 0.0001
Difference within B-6M 0.036 0.095
group (p-value) B-12M 0.002 0.0001
Bodily Pain
Baseline 68.250± 14.50 68 (45-95) 68.70±14.52 68 (40-95) 0.826 6 Month 68.800± 17.18 69 (45-90) 71.17± 16.69 71(30-100) 0.32 12 Month 71.450±16.74 71 (45-95) 75.12±13.35 76 (40-100) 0.087
Difference within B-6M 0.801 0.262
group (p-value) B-12M 0.172 0.001
General Health
Baseline 55.30±13.87 55 (30-85) 54.51±11.67 54 (30-80) 0.662 6 Month 57.10±11.39 57 (25-85) 59.56±10.88 59 (25-85) 0.118 12 Month 59.15±9.21 60 (30-80) 82.39± 11.7 82(30-90) 0.0001
Difference within B-6M 0.265 0.001
Table 5. ADS assessment at Baseline, 6th and 12th Months with significant differences within and between groups over study time in usual care and LMC group of T2DM patients
Variables UC Group LMC group Difference
(n=100) (n=102) between Mean±SD Median Mean±SD Median the group
(Min-Max) (Min-Max) (p-value)
Q1 How upsetting is having diabetes for you?
Baseline 3.84±0.87 3 (1-5) 3.90±0.29 3 (1-5) 0.499 6 Month 2.89±1.01 2 (1-5) 3.07±0.27 3 (1-5) 0.075 12 Month 3.78±0.90 3 (1-5) 2.80±0.67 2 (1-5) 0.0001
Difference within B-6M 0.0001 0.0001
group (p-value) B-12M 0.652 0.0001
Q2 How much control over your diabetes do you have?
Baseline 2.52±0.67 2(1-4) 2.37±0.50 2 (1-4) 0.8 6 Month 2.28±0.53 2 (1-4) 1.87±0.33 1 (1-3) 0.0001 12 Month 1.89±0.31 1 (1-3) 1.57±0.49 1 (1-3) 0.0001 Difference within B-3M 0.002 0.0001
group (p-value) B-6M 0.0001 0.0001
B-12M
Q3 How much uncertainty do you currently experience in your life as a result of being diabetic?
Baseline 4.86±0.44 4 (1-5) 4.83±0.4 4 (1-5) 0.657 6 Month 3.22±0.56 3 (1-5) 4.0±0.34 4 (1-5) 0.0001 12 Month 4.11±0.31 4(1-5) 3.18±0.54 3 (1-5) 0.0001
Difference within B-6M 0.0001 0.0001
group (p-value) B-12M 0.0001 0.0001
Q4 How likely is your diabetes to worsen over the next several years?
Baseline 3.91±0.32 3 (1-5) 3.74±0.79 3 (1-5) 0.55 6 Month 3.14±0.41 3 (1-5) 2.91±0.28 2 (1-4) 0.0001 12 Month 3.66±0.47 3 (1-5) 1.90±0.49 1 (1-3) 0.0001
Difference within B-6M 0.0001 0.0001
group (p-value) B-12M 0.0001 0.0001
Q5 Do you believe that achieving good diabetic control is due to your efforts as compared to factors which are
beyond your control?
Baseline 4.58±0.53 4 (1-5) 4.62±0.50 4 (1-5) 0.518 6 Month 3.89±0.39 3 (1-5) 2.12±0.33 2 (1-4) 0.0001 12 Month 4.60±0.60 4 (1-5) 2.09±0.29 2 (1-4) 0.0001
Difference within B-6M 0.0001 0.0001
group (p-value) B-12M 0.783 0.0001 Q6 How effective are you in coping with your diabetes?
Baseline 2.84±0.39 2 (1-5) 2.91±0.28 2 (1-5) 0.14 6 Month 2.34±0.60 2 (1-5) 2.09±0.29 2 (1-5) 0.0001 12 Month 2.11±0.44 2 (1-5) 2.90±0.29 2 (1-5) 0.0001
Difference within B-6M 0.0001 0.0001
group (p-value) B-12M 0.0001 0.798
Q7. To what degree does your diabetes get in the way of your developing life goals?
Baseline 3.24±0.62 3 (1-5) 3.38±0.56 3 (1-5) 0.9 6 Month 3.03±0.33 3 (1-5) 2.88±0.32 2 (1-5) 0.002 12 Month 2.37±0.67 2 (1-5) 2.16±0.48 2 (1-5) 0.015 Difference within B-6M 0.006 0.0001
group (p-value) B-12M 0.0001 0.0001
General Health
Baseline 55.30±13.87 55 (30-85) 54.51±11.67 54 (30-80) 0.662 6 Month 57.10±11.39 57 (25-85) 59.56±10.88 59 (25-85) 0.118 12 Month 59.15±9.21 60 (30-80) 82.39± 11.7 82(30-90) 0.0001
Difference within B-6M 0.265 0.001
delay the risk of complications25 and Katon et al
demonstrated that adherence to self-management decrease disease burden, health care cost and frequent hospitalizations26.
Effect of lifestyle intervention on Health-Related Quality of Life (HR-QoL)
The results of our study did not show any significant difference at baseline in SF-36 domain scores. At the 6th month after lifestyle
modification counseling, the participants of LMC group showed statistically significant improvement in the physical functioning, bodily pain, general health, and vitality from baseline to 6 months with all significant p-value less than 0.001 as compared to the usual care group. After 12 months of study follow up, the LMC group achieved significant improvement in all the domains, including physical functioning, role physical, bodily pain, general health, vitality, social functioning and mental health with significant p-values less than 0.001 as compared to the usual care group. As per ADS score, present study results did not show a statistically significant difference between LMC group and usual care group at baseline. After 6 months follow up the LMC group patients showed statistically significant improvement in all parameters except in one variable (distress caused by diabetes). At 12 months most of the patients of LMC group showed significant improvement in all domains with the significance p-value less than 0.05. Studies done by Norliza et al, Rajeshwari et al, and Kaskurthy et al studies have shown statistically significant improvement in glycemic control and overall QoL in T2DM patients after lifestyle modifications counseling provided by the pharmacist-patient counseling27-29. Similar studies
by Testa et al,Shareef et al, and Sriram et alhave shown significant improvement in the quality of life and significantly improved economic benefits after intervention30-32. Studies done by Reza et al
andAdepu et al observed significant improvement in all domains of HRQOL in diabetes patients after educational counseling in test group participants33, 34. Studies conducted by Carvalho et al, Marzieh
et al, and Alireza et alverified the influence of educational counseling and shown significant improvement in the overall QoL and HbA1c scores after counseling35-37. Similar studies by Ramune et
al and Adibe et alshowed significant improvements in HRQOL, and glycemic control, in T2DM
patients38, 39. In summary, our study concludes
that LMC may improve overall HRQoL of T2DM patients and supported by above-discussed studies.
Study limitations
Due to limited resources and facilities, this study was not randomized designs, but a quasi- experimental study was designed in a standardized manner. There is need of multi-centric randomized trials to solve diabetes management queries.
CONCLUSION
Results of present study conclude that LMC is effective towards diabetes management and control and can reduce the medical treatment cost, improve HRQOL and coping skills of T2DM patients. Further multi-centric randomized control trials with the large population are required, to assess the effectiveness of lifestyle intervention on medical treatment cost and HRQOL in T2DM patients.
ACKNOWLEDGMENT
The authors would like to thank the Delhi Diabetes Research Center, New Delhi, India.
REFERENCES
1. Norma S , Zaleha MI and Azmi M T. The effect of life style intervention among pre- diabetes patients in Melaka, Malaysia. IOSR-JNHS., 2: 14-21 (2013).
2. International Diabetes Federation. IDF Diabetic Atlas 7th Edition. http://www.idf.org/idf-diabetes-atlas-seventh-edition, (2016).
3. Morales MC, Navas AF and Jimenez MFR. Health- related quality of life in patients with type 2 diabetes mellitus in a rural area. J Diabetes Metab.,6:1-5 (2015).
4. Tripathy J and Thakur J. S. Prevalence and risk factors of diabetes in a large community-based study in north India: results from a STEPS survey in Punjab, India. Diabetol Metab Syndr.,9:1-8 (2017).
5. Kapur A. Influence of socio-economic factors on diabetes care. Int J Diab Dev Countries.,21 :77-85 (2001).
6. Australian institute of health and welfare, Diabetes: Australian facts 2008. Diabetes series No. 8. Cat. no. CVD 40. Canberra: AIHW. 7. Mustapha W, Hossain ZS and Loughlin KO.
life among the Lebanese community of Sydney: A quantitative study. J Diabetes Metab.,5: 1-10 (2014).
8. Stanetic K, Savic S and Racic M. The quality of life of patients with type 2 diabetes mellitus.
Omnuta.,18:70-77 (2012).
9. Thommasen HV and Zhang W. Impact of chronic disease on quality of life in the Bella Coola Valley. Rural remote health.,6: 528 (2006). 10. Crouchley KD and Alison. Chronic disease and
quality of life in western Australia. Department of health, western Australia., 5–8 (2007). 11. Aghamollaei T and Eftekhar H. Behavior,
metabolic control and health-related quality of life in diabetic patients at Bandar Abbas diabetic clinic. Iranian J Publ Health.,32:54–59 (2003). 12. Caro JJ, Ward AJ and Brien JA. Lifetime costs
of complications resulting from type 2 diabetes in the U.S. Diabetes Care.,25:476–481 (2002). 13. Nichols GA, Arondekar B and Herman Wh.
Medical care costs one year after identification of hyperglycemia below the threshold for diabetes.
Med Care.,46:287–292 (2008).
14. Piette JD, Heisler M and Wagner TH. Problems paying out-of-pocket medication costs among older adults with diabetes. Diabetes Care.,
27:384–391 (2004).
15. Piette JD, Wagner TH, Potter MB and Schillinger D. Health insurance status, cost related medication underuse, and outcomes among diabetes patients in three systems of care. Med Care., 42:102–109 (2004).
16. Bodenheimer T, Wagner EH and Grumbach K. Improving primary care for patients with chronic illness: the chronic care model, Part 2. J Am Med Assoc., 288: 1909–1914 (2002).
17. Tuomilehto J, Lindstrom J, Eriksson JG and Valle. Prevention of type 2 diabetes mellitus by changes in lifestyle among subjects with impaired glucose tolerance. N Engl J Med., 344: 1343-1350 (2001).
18. Ware JE and Sherbourne CD. The MOS 36-item short-form health survey (SF-36). Conceptual frame work and item selection. Med Care.,30: 473-483 (1992).
19. Carey MO. RCMAR measurement tools, Appraisal of diabetes scale. http://www.musc. edu/dfm/RCMAR/ADS.html 2006.
20. Sevick MA, Dunn AL, Morrow MS, Marcus BH, Chen GJ and Blair SN. Cost effectiveness of lifestyle and structured exercise intervention in sedentary adults: Results of project ACTIVE.
Am J Prev Med.,19:1-8 (2000).
21. Upadhyay D K, Ibrahim M, Mishra P and Vijay M. Does pharmacist supervised intervention through pharmaceutical care program influence
direct healthcare cost burden of newly diagnosed diabetics in a tertiary care teaching hospital in Nepal: A non-clinical randomized controlled trial approach DARU. J. Pharm. Sci., 24:1-9 (2016). 22. Odnoletkova I, Ramaekers D, Nobels F,
Goderis G, Aertgeerts B and Annemans L. Delivering diabetes education through nurse-led telecoaching. cost-effectiveness analysis. PLoS One.,11: e0163997 (2016).
23. Anne M and Wolf MS RD. Effects of lifestyle intervention on health care costs: improving control with activity and nutrition (ICAN). J Am Diet Assoc.,107:1365-1373 (2007).
24. Wolf AM, Conaway MR and Crowther JQ. Translating lifestyle intervention to practice in obese patients with type 2 diabetes: Improving control with activity and nutrition (ICAN).
Diabetes Care.,27:1570-1576 (2004).
25. Png ME and Yoong JS-Y. Evaluating the cost-effectiveness of lifestyle modification versus metformin therapy for the prevention of diabetes in Singapore. Plos One., 9:e107225 (2014). doi:10.1371/journal.pone.0107225
26. Lin EH, Katon W and Rutter C. Effects of enhanced depression treatment on diabetes self-care. Ann Fam Med., 4: 46-53 (2006).
27. Ibrahim N, Ming Moy F and Awalludin IAN. Effects of a community-based healthy lifestyle intervention program (co-help) among adults with pre-diabetes in a developing country: a quasi-experimental study. PLoS One., 11: e0167123 (2016).
28. Rajeshwari S. Adhikari Prabha MR and Pai MRSM. Drug utilization study in geriatric Type 2 diabetic patients. J Clin Diagn Res.,5:440-443 (2009).
29. Kaskurthy S Nalluri H L and Thanait D R. Influence of education on quality of life in type 2 diabetic patients in a tertiary care teaching hospital. World J Pharm Pharm Sci., 3(11), 1344-1353 (2014).
30. Testa MA, Simonson DC and Turner RR. Valuing quality of life and improvement in glycemic control in people with type-2 diabetes. Diabetes Care., 21:44-52 (1998).
31. Shareef J, Fernandes J and Samaga L. Impact of pharmacist’s intervention on improving quality of life in patients with diabetes mellitus.
J Diabetes Metab Disord Control.,3: 00076 (2016). DOI: 10.15406/jdmdc.2016.03.00076 32. Sriram S, Damodharan S and Akhila S. A. Impact
of pharmaceutical care activities on diabetic patients at a private corporate hospital. IJMRHS.,
5: 66-74 (2016).
self-empowerment through educational package and workshop in quality of life of diabetic patients. Jundishapur. J. Chronic. Dis. Care., 5:e37186 (2016).
34. Adepu R, Rasheed A and Nagavi BG. Effect of patient counseling on quality of life in Type 2 diabetes mellitus patients in two selected south Indian community pharmacies : A study. Indian J. Pharm. Sci.,69:519 524 (2007).
35. Carvalho S and Nagavi BG. Impact of community pharmacy based patient education on the quality of life of hypertensive patients. Indian J Pharm Edu Res. 41:164 169 (2007).
36. Jahromi M K, Somayeh Ramezanl S and Taheri L. Effectiveness of diabetes self-management education on quality of life in diabetic elderly
females. Glob J Health Sci.,7(1): 10-15 (2015). 37. Didarloo A, Shojaeizadeh D and Alizadeh M.
Impact of educational intervention based on interactive approaches on beliefs, behavior, hemoglobin A1c, and quality of life in diabetic women. Int J Prev Med., 7: 1-8 (2016). 38. Jacobsen R, VadstrupE and Roder M. Predictors
of effects of lifestyle intervention on diabetes mellitus type 2 patients. Sci. World J., 2012; Article ID 962951,1- 8.
39. Maxwell O, Adibe and Chinwe V. The impact of pharmaceutical care intervention on the quality of life of nigerian patients receiving treatment for type 2 diabetes. Value Health Reg Issues., 2