http://www.ijcmph.com pISSN 2394-6032 | eISSN 2394-6040
Original Research Article
Correlation of weight for age of children and knowledge about
growth chart among mothers
Aruna P. Tubachi
1*, Shalini Nooyi
2, N. S. Murthy
2INTRODUCTION
India is developing country, even with vast improvement in country’s economy malnutrition remains a challenge. Nearly half of the children in India are malnourished according toNFHS.1 The amount of malnourishment has hardly shown any improvement from NHFS 2 to NFHS 3.
To combat with malnutrition Governments have implemented many measures like providing food to the
antenatal mothers and children, fortifying of the food, immunization, free maternal and child care services. For growth monitoring WHO introduced simple and effective tool called growth charts.
The growth chart is essentially visual and provides the nurse with a useful instrument for educating the mother and the family.2
Monitoring of growth started in 1950s. Weighing and the charting of a weight-for-age graph was started in West Africa in the late 1950s (Morley, 1960). In this birth ABSTRACT
Background: India is developing country, even with vast improvement in country’s economy malnutrition remains a challenge. Growth chart gives easy way of monitoring the growth of the child and hence help in early diagnosis and early correction of malnutrition. This study is intended to assess the knowledge of mothers about the growth chart and educate them in the same.
Methods: A hospital -based, cross-sectional descriptive study. Conducted among mothers of children aged less than five years attending health centres for immunization during July and August 2013 by complete enumeration till sample size is met.
Results: The study shows 28.4% of the children were underweight. The figure is similar to NFHS 3 results. Only 20 i.e. 14.9% of mothers had seen the growth chart before. Only 5 could tell the use of growth chart. None of the mothers were able to name the chart. Only one mother knew how it is used and could interpret the colors. Attitude and practice regarding growth chart is very poor. The study shows that mother’s occupation and father’s education had significant effect on weight of the child.
Conclusions: The present study shows poor knowledge regarding the use of growth chart among mothers. With the high percentage of under nutrition among under 5 one of the easy and cheap method of monitoring the weight is by explaining mothers how to monitor the weight of the child. Further there is need to motivate health workers to help mothers in understanding the same.
Keywords: Growth chart, Weight for age, Undernourished
Department of Community Medicine, 1RVMMIM & RC, Laxmakkapally, Telangana, 2Ramaiah Medical College, Bangalore, Karnataka, India
Received: 14 February 2018
Revised: 12 March 2018
Accepted: 14 March 2018
*Correspondence:
Dr. Aruna P. Tubachi,
E-mail: [email protected]
Copyright: © the author(s), publisher and licensee Medip Academy. This is an open-access article distributed under the terms of the Creative Commons Attribution Non-Commercial License, which permits unrestricted non-commercial use, distribution, and reproduction in any medium, provided the original work is properly cited.
month of the child was plotted against which the weights. These charts were home-based and held by the mother of the child. During the 1970s became part of the growth monitoring, oral rehydration, breastfeeding and immunization (GOBI) effort initiated by UNICEF to prioritize primary health care. UNICEF and NGOs made large investments to provide dial weighing scales, distribute growth charts and train personnel.3
It is recommended that the weight of the child should be recorded every month in first year, every two months in second year and every three months thereafter.4
There are many growth charts which are used according to the zones. But most popular one is WHO growth chart which has been adopted by many countries and modified according to the areas. Many countries adopted these growth chart and introduced in mother and child protection card. But unfortunately it is rarely used by mothers. Literature produced by international organizations and major NGOs rarely mention growth monitoring. Studies of food and nutrition made by the WHO(1998), United Children’s Fund and FAO make little mention of growth faltering and do not refer to growth monitoring. Involvement of mothers and families in growth monitoring will help in promoting better nutrition.
Hence this study is intended to assess the knowledge of mothers about the growth chart and educate them in the same to improve the nutrition among children.
Objectives
1. To study the association between weight for age of under five children attending health centres and knowledge about the growth chart among mothers. 2. To study the association between weight for age of
under five children attending health centres and socio-demographic factors.
3. To assess the knowledge about growth charts in mothers of under five children attending B K Nagar, Cholanayakanahalli urban health centres, M. S. Ramaiah field practice area.
METHODS
Study design
A hospital-based, cross-sectional descriptive study in Cholanayakanahalli and B. K. Nagar, two Urban Health Centres of M. S. Ramaiah Medical College. Conducted among mothers of children aged less than five years attending health centres for immunization during July and August 2013 by complete enumeration till sample size is met.
Study area
Cholanayakanahalli and B. K. Nagar are two Urban Health Centres which are field practice area of M. S.
Ramaiah Medical College. Cholanayakanahalli urban health centre has two wards. Ward 21 has population of 33,061 and ward 22 has 52,453 population. Number of children between 0-5 years in each wards is 2302 and 1851 respectively. B K Nagar has two wards 17 and 36. Populations in each ward are 49,936 and 37,323 respectively.
Study population
Mothers of under five children attending two urban health centres.
Inclusion criteria
Inclusion criteria were all mothers of under-five children attending two urban health centres for immunization.
Exclusion criteria
Exclusion criteria were mothers not willing to participate; mothers of children with chronic illnesses and or undergoing treatment in hospitals.
Sampling technique
Complete enumeration of all the mothers of under five children attending two urban health centres for immunization with no history of chronic illness are enumerated till sample size is attained.
Sample size
In absence of any previous study in the state a pilot study was conducted to know the knowledge of mothers about the growth chart. Proportion of mothers with knowledge was 12%. With absolute precision of 5.5% and confidence limit of 95% sample size was calculated to be 134.
Study period: July and August 2013.
Ethical clearance was obtained from the ethical committee. Informed consent was taken from study population. Pre designed semi structured questionnaire was administered to all mothers of children below five years of age who attend immunization sessions in B K Nagar and Cholanayakahalli health centres after pilot testing.
Socio-demographic characters like age, education, occupation of mother and father was taken. Socioeconomic status was calculated using Modified Kuppuswami classification.
Weight is calculated using Salter’s scale. Weight was measured with an “Indian Standards Organization” certified Salter weighing scale with minimum clothes and without footwear with an accuracy of upto 100 gms.
Education about the growth chart like how it should be used and how it is interpreted was taught. Awareness about the importance of maintaining the chart for each child will be ensured.
The importance of periodically rising line and dangers of flat line or dipping line was taught.
Statistical analysis
Descriptive statistics was used to summarise the quantitative variables such as age, weight etc. Qualitative variables were expressed in terms of proportion and 95% confidence interval. Chi-square test/Fischer’s exact test was used to test for difference in knowledge of the mothers about understanding the growth chart in two centres studied.
RESULTS
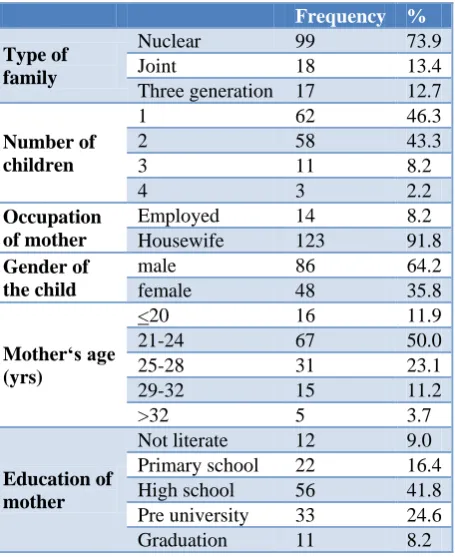
Table 1: Demographic details.
Frequency %
Type of family
Nuclear 99 73.9
Joint 18 13.4
Three generation 17 12.7
Number of children
1 62 46.3
2 58 43.3
3 11 8.2
4 3 2.2
Occupation of mother
Employed 14 8.2 Housewife 123 91.8
Gender of the child
male 86 64.2
female 48 35.8
Mother‘s age (yrs)
<20 16 11.9
21-24 67 50.0
25-28 31 23.1
29-32 15 11.2
>32 5 3.7
Education of mother
Not literate 12 9.0 Primary school 22 16.4 High school 56 41.8 Pre university 33 24.6 Graduation 11 8.2
Study showed that most of the study population (73.9%) belonged to nuclear family. Most of the family had one or two children. 50% of mothers were in the age group of 21-24 years 91.3% of the mothers were housewives. Only 9% of the mothers were not literate.
Table 2: Age distribution of children.
Frequency %
Age of the child (in months)
<6 69 51.5 7-12 27 20.1 13-24 26 19.4
25-36 7 5.2
49-60 5 3.7
Above table shows age distribution of the children in months. 51.5% of the children were below the age of 6 months.
Table 3: Weight for age of children according to colour zoning.
Frequency %
Color category of weight of the child
Green 79 59.0 Yellow 30 22.4
Red 8 6.0
Above green 17 12.7
The study shows 28.4% of the children were underweight. 6% of total children were severely malnourished.
Table 4: Knowledge regarding utilization of growth chart.
Frequency %
Seen chart Yes 20 14.9
Can tell its use Yes 5 3.7
Where growth chart was seen
Not seen 114 85.1 Anganwadi 4 3.0
UHC 2 1.5
MCP card 13 9.7 Other cards 1 0.7
Knowledge on
how it is used Yes 1 0.7
The mothers had were poor knowledge regarding the growth chart. Only 20 i.e. 14.9% of mothers had seen the growth chart before. Only 5 could tell the use of growth chart. None of the mothers were able to name the chart. Only one mother knew how it is used and could interpret the colors. Mothers had mainly seen it in the MCP cards. It was observed that healthcare workers did not create awareness about growth chart among mothers.
As knowledge itself was very poor attitude and practice regarding growth chart was not satisfactory. Only 3 mothers agreed that it should be used for growth monitoring. Only one mother used growth chart for monitoring the weight (Table 5).
Table 5: Attitude and practice regarding growth chart for growth monitoring.
Attitude Frequency %
Chart should be used for growth monitoring
Did not know 131 97.8
Agree 3 2.2
Total 134 100.0
Practice Not used 133 99.3
Always 1 0.7
Table 6: Association of weight with socio-demographic factors.
Undernourished Normal P value
Mother’s occupation
Professional Count 0 1
0.007* % of total 0.0% 0.7%
Semi professional Count 5 1
% of total 3.7% 0.7%
Clerical/farm/shop Count 1 2
% of total 0.7% 1.5%
Skilled Count 1 0
% of total 0.7% 0.0%
Unskilled Count 31 92
% of total 23.1% 68.7%
Father’s occupation
Professional Count 3 6
0.855* % of total 2.2% 4.5%
Semi professional Count 7 15
% of total 5.2% 11.2%
Clerical/farm/shop Count 4 8
% of total 3.0% 6.0%
Skilled Count 24 67
% of total 17.9% 50.0%
Gender
male Count 28 58
0.167 % of total 20.9% 43.3%
female Count 10 38
% of total 7.5% 28.4%
Mother’s age (years)
<20 Count 2 14
0.191 % of total 1.5% 10.4%
21-24 Count 25 42
% of total 18.7% 31.3%
25-28 Count 6 25
% of total 4.5% 18.7%
29-32 Count 4 11
% of total 3.0% 8.2%
>32 Count 1 4
% of total .7% 3.0%
Father’s education
Professional degree Count 7 5
0.002* % of total 5.2% 3.7%
Graduate Count 12 10
% of total 9.0% 7.5% Intermediate/diploma Count 12 44
% of total 9.0% 32.8%
High school Count 5 28
% of total 3.7% 20.9%
Middle school Count 2 9
% of total 1.5% 6.7%
Undernourished Normal P value
Seen chart
No Count 28 86
0.030 % of total 20.9% 64.2%
Yes Count 10 10
% of total 7.5% 7.5%
*Fischer’s exact test.
DISCUSSION
There is lack of such similar studies done. There is need for creating awareness among mothers for growth monitoring as well as increasing awareness among healthcare workers to help mothers understand growth chart. A study done in Ethiopia shows 53% of mothers found to have poor knowledge and 42.6% of mothers had poor attitude.5 The study shows very poor knowledge, attitude and practice regarding growth chart among mothers. It shows that undernourishment is high among under 5 children. There is great need to improve nutrition.
CONCLUSION
The growth chart offers simple and inexpensive means of monitoring child health and nutritional status, and can be used by community health workers with very little supervision. Even though many such low cost interventions are developed by Government for better health of society its utilization is very poor. Hence there is need to increase awareness among the population to make use in their life. With malnutrition being so widespread simple measures like monitoring baby’s weight by mother will give lot of head start in preventing malnutrition and promoting health.
Funding: No funding sources Conflict of interest: None declared
Ethical approval: The study was approved by the Institutional Ethics Committee
REFERENCES
1. United Nations Children’s Fund National Institute of Medical Statistics UNICEF, New Delhi 110029. Available at URL www.unicef.in. Accessed on 23 July 2013.
2. Nombe E. An Investigation Into The Knowledge Mothers Have About Children’s Growth charts. Curationis. 1992;15(1):26-8.
3. Morley D, Elmore-Meegan M. Growth monitoring a forgotten subject. Available at: www.fao.org/ docrep/003/x8576m/x8576m03htm. Accessed on 12 July 2013.
4. Park K. Park’s textbook of preventive and social medicine. 22nd ed. Bhanot publications, Jabalpur; 2009.
5. Daniel B, Tesfaye N, Mekonin E, Kassa A, Mensur K, Zerihun E, et al. Knowledge and Attitude on Growth Monitoring and its Associated Factors among Mothers/Guardians of Children Less than Two Years in Areka Town, Southern Ethiopia, 2017. J Nutr Disorders Ther. 2017;7:3.