Bioactive compounds and antioxidant activity evolution
during the ripening process of 12 Opuntia spp. fruit
accessions
José Manuel Pinedo-Espinoza1,3, Cesar Leobardo Aguirre-Mancilla3, Rubén Jiménez-Alvarado2, Juan Carlos Raya-Pérez3, Gabriel Iturriaga3, Juan Gabriel Ramírez-Pimentel3, Alma Delia Hernández-Fuentes2*
1Universidad Autónoma de Zacatecas, Unidad Académica de Agronomía, km 15.5 Carretera Zacatecas-Guadalajara, C.P. 98170, Zacatecas,
Zacatecas, México, 2Universidad Autónoma del Estado de Hidalgo, Instituto de Ciencias Agropecuarias. Av. Universidad km 1 Rancho
Universitario, C. P. 43000, Tulancingo de Bravo, Hidalgo, 3Tecnológico Nacional de México, Instituto Tecnológico de Roque, México. Km 8
Carretera Celaya-Juventino Rosas, Apartado Postal 508, C. P. 38110
INTRODUCTION
The genus Opuntia comprises approximately three hundred species. They belong to the family Cactaceae, which are
plants that utilize water efficiently, even five times more than conventional crops, requiring low amounts of water.
For these reasons, Opuntia spp. are easily adaptable to arid
and semiarid regions, and have been considered by the FAO as a valuable alternative for the agricultural development
in dry regions where the rains are scarce (Pimienta, 2001).
This plant is cultivated in Mexico, Italy, South Africa
and other countries, with different species of Opuntia
predominating in each country, and it is well known that the weather, region and cultural practices can affect the content of nutrients and mineral composition, as well as
quantities of bioactive compounds in plants. However, there are some differences among the cultivars respect
to their fruits, such as size, maturation time and number of seeds. Recently, Opuntia spp. has gained considerable
attention due to the bioactive components it contains, and many researchers have contributed to the characterization
of Opuntia spp. fruits (prickly pear fruits), and they have
extracted natural pigments not only from their pulp but
also from their skin. Stintzing (2005), published information
about antioxidants and phytochemicals present in fruits
of different cultivars of Opuntia ficus-indica (L.) Mill. The
Opuntia stricta fruit showed an intense purple color due to its high concentration of betacyanins (80 mg/100 g of
fresh weight) (Castellar, 2003). Moreover, juice of Opuntia
stricta fruit(fresh, dried or concentrated) can be used as a natural food ingredient, and the pigments, antioxidants and
others bioactive compounds it contains, help to improve the overall quality of the final food product in which it is added,
increasing the acceptability of the consumer (Castellar, 2003;
Opuntia spp. is easily adaptable to arid and semiarid climates, and represents a valuable alternative for the agricultural development in
dry regions. The aim of this work was to know the evolution of bioactive compounds concentration such as phenolics, flavonoids and
pigments (Isobetanins, betanins, indicaxanthins and total betalains) during the ripening process of twelve accessions of Opuntia spp. fruits. DPPH and ABTS radical scavenging capacity were determined and correlated with pigments and bioactive compounds concentration. Bioactive compounds and pigments concentration increased along ripening. Higher concentration of total betalains were found in ripe
ꞌBondaꞌ (O. guerrana Griffiths) and ꞌRojo Tolucaꞌ (Opuntia robusta var. Larreyi) accessions, being of 78.96 ± 0.54 mg 100 g-1 DW and 69.87 ± 0.29 mg 100 g-1 DW respectively. Findings in this work can help to select Opuntia spp. accessions with high potential to be established as a valuable crop in the arid zones of Mexico.
Keywords: Antioxidant activity; Betalains; Bioactive compounds; Cactus pear; Opuntia spp.
A B S T R A C T
http://www.ejfa.me/
R E G U L A R A R T I C L E
*Corresponding author:
Alma Delia Hernández-Fuentes, Universidad Autónoma del Estado de Hidalgo, Instituto de Ciencias Agropecuarias. Av. Universidad km 1 Rancho Universitario, C. P. 43000, Tulancingo de Bravo, Hidalgo. Phone/Fax: +52 01 (771) 717 2000. E-mail:[email protected]
Castellar, 2006; Obón, 2009). These compounds differ
depending upon the species and clones studied, and they
have not been completely explored. In comparison with
beet root, where betalains can also be found, prickly pear
fruits offer a wide variety of colors, which could be used in foods due to its natural character (Stintzing et al., 2002). Some species of the genus Opuntia have shown bioactivity as analgesic, anti-inflammatory, antioxidant, hypoglycemic, and neuroprotective effect, and could be useful in cancer chemoprevention (Tesoriere et al., 2005; Bensadón, 2010).
The fresh prickly pear fruits are used to elaborate different
products as jams, candies, liqueurs, sauces and juices among others. Nevertheless, some species of the genus Opuntia
produce red fruits containing big seeds or a large number of seeds, which are not consumed by people but there is a great interest about they in order to obtain natural pigments for food applications, because the opening of new markets
for functional food and beverage industry has become an important area of opportunity (Mobhammer et al., 2005 and Stintzing, 2007). In order to know what specie and ripening
state produces the highest concentration of pigments
and bioactive compounds, the record of changes in their concentration along the maturity time is very important. It has been reported that pigmentation of red prickly pear fruits occurs first in the center, long before fruit ripening
and skin pigmentation. Pigmentation is full when the fruit is ripe, and it is correlated with the maximum content of total soluble solids (Felker et al., 2008). Therefore, an
adequate ripening state at the moment of the harvest is very important for the fruit quality. For these reasons, the
aim of this work was to know changes in pigments content and antioxidant compounds occurring along the ripening
of twelve accessions of red prickly pear fruits.
MATERIALS AND METHODS
Plant materialTwelve accessions of Opuntia spp. red prickly pears: ꞌCacaloteꞌ (O. cochinera Griffiths), ꞌBondaꞌ (O. guerrana
Griffiths), ꞌRojo Tolucaꞌ (Opuntia robusta var. Larreyi),
ꞌTapón Aguanosoꞌ (O. robusta var. robusta), ꞌGrifaꞌ (Opuntia
megacantha Salm-Dick), ꞌRojo Insurgentesꞌ (O. megacantha
Salm-Dick), ꞌOrejónꞌ (O. megacantha Salm-Dick), ꞌSangre de
Toroꞌ (O. megacantha Salm-Dick), ꞌCardonaꞌ (O. streptacantha Lem.), ꞌRojo Pelónꞌ (O. ficus indica (L.) Mill.), ꞌSandíaꞌ (Opuntia streptacantha) and ꞌBurra la Cruzꞌ (O. robusta var. robusta), were harvested from the National Repository of Opuntias, in the Regional North-central Universitary Center (CRUCEN-Zacatecas) of the Autonomous University Chapingo, in Zacatecas, Zacatecas, Mexico, located at 22° 44’ 49.6’’ North latitude and 102° 46’ 28.2’’ West longitude; at an altitude of 2,296 meters above sea level. The characteristic climate of this region is classified
as BS1kw(w), which corresponds to a dry climate, the least dry of the BS, with an annual average temperature ranging between 12 and 18 °C, and an annual average rainfall of 472 mm. Most of the rainfall (65 %) occurs from June to August.
Chemicals
Liquid chromatography grade solvents: Acetone, methanol,
and acetonitrile were purchased from EMD Millipore Chemicals (Billerica, MA, USA), and formic acid, glacial
acetic acid, and phosphoric acid were obtained from
Anachemia (Canada). Ultrapure water was obtained from a Millipore Milli-Q water purification system (Billerica, MA, USA).
G a l l i c a c i d , S e p h a d e x - L H - 2 0 , 2 , 2 - a z o b i s
(2-methylproprionamidine) dihydrochloride, Folin–
Ciocalteu reagent, sodium carbonate, quercetin, epicatechin,
p-hydroxybenzoic acid, protocatechuic acid, p-coumaric acid, m-coumaric acid, caffeic acid, ferulic acid, shikimic
acid, ellagic acid, and 5-caffeoylquinic acid were purchased from Sigma–Aldrich (St. Louis, MO, USA).
Fruits harvesting and samples preparation
The twelve prickly pear accessions ꞌCacaloteꞌ (CL), ꞌBondaꞌ
(BO), ꞌRojo Tolucaꞌ (RT), ꞌTapón Aguanosoꞌ (TA), ꞌGrifaꞌ (GR), ꞌRojo Insurgentesꞌ (RI), ꞌOrejónꞌ (OR), ꞌSangre de
Toroꞌ (ST), ꞌCardonaꞌ (CA), ꞌRojo Pelónꞌ (RP), ꞌSandíaꞌ
(SA) and ꞌBurra la Cruzꞌ (BC) were harvested during eight
dates after anthesis until their complete ripe. Fifty fruits
were randomly collected from five plants (ten of each). Samples were codified as AD, where A means the prickly pear accession, and the subscript D means the days after anthesis, resulting 96 samples. Fruits were ultrafreezed at -70 °C (Ultrafreezer THERMO SCIENTIFIC 303, USA) and lyophilized at 133x10-3 mBar for quantification
of total phenolics, total flavonoids, antioxidant activity, and
betalains. Lyophilized samples were ground in a cutter mill
(RTSCH GM 200, Germany) at 9000 rpm per 50 s until a fine powder of 150 mm was obtained.
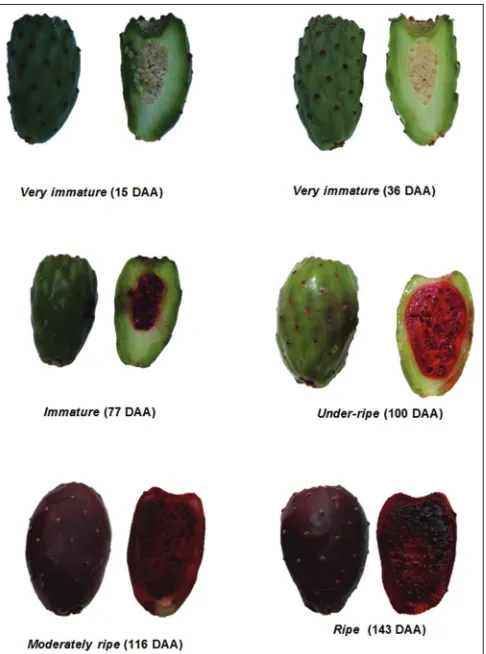
Maturity index
The fruits were washed carefully with distilled water in order to eliminate the glochids. The images of each longitudinally cut fruit were recorded in photographs in order to make a comparison between them. These
observations together with the external color of the fruits allowed the establishment of a visual scale with the following five values: 1) very immature; 2) immature;
3) moderately mature and 4) mature (Fig. 1).
Total phenolics content
Mole, 1994) with slight modifications. A lyophilized sample of 0.5 g was mixed with 20 mL of 80% methanol and vortexed per 10 min. After which, it was centrifuged at 17500xg per 10 min at 5 °C (centrifuge Thermo Scientific Mod. ST 16R, Germany). 1 mL of the supernatant was mixed with 5 mL of the Folin-Ciocalteu reagent diluted 1:10 (v: v) with distilled water and it was left stand per 7 min. 4 mL of a solution of sodium carbonate (7.5 %) was added
and left to react in the darkness per 2 h. The absorbance was
measured at 760 nm using a spectrophotometer (Jenway 6715 UV/VIS, Jenway Techne Inc. USA). A calibration curve was prepared using gallic acid as standard. Results were expressed as mg Gallic Acid Equivalents (GAE)/g Fresh Weight (FW). Moisture of fresh fruits was used to convert from dry weight to fresh weight. All the
experiments were done by triplicate.
Total flavonoids content
The total flavonoids content was determined according to the method described by Dowd and adapted by Arvouet-Grand et al., (1994). Briefly, 0.1 g of lyophilized sample was mixed with 10 mL of 80% methanol; this mixture was vortexed 10 min and filtered through filter paper Whatman grade 1. After which, 2 mL of filtrate was mixed with 2 mL of a methanolic solution of AlCl3 (2% in
methanol). This mixture was left stand for 20 min in the
darkness. The absorbance was measured at 415 nm using a spectrophotometer (Jenway 6715 UV/VIS, Jenway Techne Inc. USA). A calibration curve was prepared (0-40 mg/L) using quercetin as standard. Results were expressed as mg Equivalents of Quercetin (EQ)/100 g of Fresh Weight (FW). Moisture of fresh fruits was used to convert from
dry weight to fresh weight.
Preparation of samples for radical scavenging capacity assays
0.5 g of lyophilized fruit was mixed with 20 mL of 80% methanol. This mixture was vortexed per 20 min and centrifuged at 17500 xg per 10 min at 5°C in a centrifuge (Thermo Scientific Mod. ST 16R, Germany). The
supernatant was used for the determination of radical
scavenging assays.
DPPH radical scavenging capacity
The radical scavenging capacity was performed by the DPPH method described by Brand-Williams et al., (1995). Briefly, 0.5 mL of sample was mixed with a methanolic solution of DPPH (6X10⁻⁵ M), which was previously left to stand per 2 h under constant agitation in the darkness.
The mixture was vortexed 15 s and left to stand in the darkness per 1 h at 4°C. Absorbance was measured in a spectrophotometer (Jenway 6715 UV/VIS, Jenway Techne Inc. USA) at 515 nm. Trolox was used as standard, and results were expressed as mmol Trolox equivalents (TE)/g
fresh weight (FW). Moisture of fresh fruits was used to convert from dry weight to fresh weight.
ABTS radical scavenging capacity
The radical scavenging capacity was determined by the ABTS assay described by Re, et al., (1999) with slight modifications. An aqueous solution of ABTS (7 mM) was mixed with an aqueous solution of potassium persulfate (2.45 mM) at 1:1 (v: v) ratio. This mixture was left in the
darkness under constant agitation during 16 h in order
to produce the ABTS radical (ABTS+). The solution
containing ABTS+ was diluted with acetate buffer until
reach an absorbance value of 0.700 ± 0.02 at 754 nm. 100 mL of the extract was added to 3900 mL of the ABTS+
solution. The absorbance was measured at 754 nm after
6 min storing the mixture in the darkness. Trolox was used
as standard preparing a standard curve (0-15 mM Trolox). Results were expressed as Trolox equivalent antioxidant capacity (TEAC) in µM Trolox equivalent (TE)/100 g fresh weight (FW). Moisture of fresh fruits was used to convert
from dry weight to fresh weight.
Analysis of indicaxanthin, betanin and isobetanin
Preparation of samples
Lyophilized samples (500mg) were extracted with 80% aqueous methanol (20 mL) in an ultrasonic bath for 20 min at 37°C. Then, samples were vortexed 30 seconds and centrifuged (AllegraTM 25R centrifuge) at 4000 xg for 4 min at room temperature. The supernatant was placed
into a 50 mL tube. The residue was re-extracted using
the same procedure. The supernatants were combined
and completed at 50mL using water. The mixture was subsequently filtered through a 0.2 µm nylon filter and filtrate was assayed for total betalains and specific indicaxanthin, betanin and isobetanin analysis (Kujala
et al., 2001).
UPLC-ESI-MS/MS analysis
The UPLC analysis was performed using a Waters Acquity Ultra-PerformanceTM LC system (Waters), equipped with a quaternary pump system (Waters). An Acquity solid-core particle Cortecs column (150mmX2.1mm id, 1.6 µm
particle size) from Waters was used for the separation. The pigments were separated with a mobile phase that consisted
of 2% Formic acid (eluent A) and acetonitrile (eluent B), The flow-rate was 0.4 mL/min and the gradient elution was initial, 2% B; 0-6.0 min, isocratic 2% B; 6.0-15.0 min, 2-30% B; 15-15.1 min, 30-100% B;15.1-18.0 min isocratic 100% B; 18.0-18.1 min 100-2% B; 18.1-23.0 min isocratic 2% B. The MS analyses were carried out on a Xevo TQD mass spectrometer (Waters) equipped with a Z-spray
electrospray interface. The analyses were performed in
Fig 1. Evolution of internal and external color of ꞌOrejónꞌ (O. megacantha
Salm-Dick) accession, harvested since 15 to 143 days after anthesis (DAA).
indicaxanthin (309 m/z), betanin (551 m/z) and isobetanin (551 m/z) were used for identification and quantification. Betanin and isobetanin were differentiated based on Kujala et al. (2002) elution order. Molecules were quantified as betanin equivalent. The ionization source parameters were capillary voltage, 3.5 kV; source temperature, 110 °C and desolvation gas flow rate, 650 L/h; desolvation temperature, 250 °C. Nitrogen (99% purity) and argon (99% purity) were used as nebulizing and collision gases, respectively. Data acquisition was carried out with the MassLynx 4.1 software.
Quantification of total betalains
Betalains content was calculated according to Tsai et al. (2011) with slight modifications (Equation 3). All determinations were performed on a UV/Vis spectrometer (Helios, Thermo). The UV/vis absorption spectra were recorded at 536 nm.
Betalains mg g Abs MW DF V
L W
( / )
(3)
Where Abs is the absorbance value at a wavelength of 536 nm for betacyanins, DF is the dilution factor, V is the
volume of solution (mL), W is the dry weight (g), and L is the path-length (1 cm) of the cuvette. The molecular weight (MW= 550 g/mol) and the molar extinction coefficient (ε= 61,600 L/mol cm) were applied in order to quantify
betalains.
Statistical analysis
A completely randomized design was used. Means and standard deviations were calculated. The statistical software SAS (software JMP 5.0, V. 9.0) (2002) was used for the analysis of variance (ANOVA). The Tukey test was used
for the comparison of means (P≤ 0.05) with a 95% of confidence. Correlation analysis was carried out using Pearson’s correlation coefficient. All the experiments except
maturity, size and color were done by triplicate.
RESULTS AND DISCUSSION
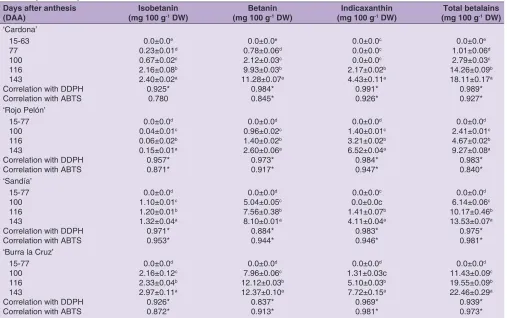
Changes in pigments concentration during the ripening Pigments (isobetanins, betanins, and indicaxanthins) were
detected in immature fruits BO63, RT63, CL77, RI77, OR77 and CA77 (Table 1). Nevertheless, in the other accessions,
the pigments appeared until the fruits were under-ripe,
as in TA100, GR100, RP100, SA100 and BC100 or even until they were moderately ripe as ST116. Betacyanin was the
main pigment found in these fruits, meanwhile lower
levels of isobetanins, betanins and indicaxanthins were
found. The highest concentration of isobetanins was
found in ripe fruits, being of 3.58 ± 0.15 mg/100 g dry basis (DB) and 4.58 ± 0.38 mg/100 g DB for BO143 and RT143 respectively. The accessions BO143 and RT143 showed
also the highest concentrations of betanins (45.71 and 38.09 ±1.81 mg/100 g DB respectively) and indicaxanthins (29.67 ± 0.45 and 27.20 ± 0.10 mg/100 g DB respectively).
Therefore, the highest concentration of total betalains
was found in BO143 and RT143, being of 78.96 ± 0.54 and 69.87 ± 0.29 mg 100-1 g DB respectively. Several studies highlight the antioxidant properties of betalains and the importance of Opuntia spp. fruits containing high
levels of these bioactive compounds (Fernández-López et al., 2010; Sumaya-Martínez et al., 2011). Moreover, significantly positive correlations were found between the DPPH or ABTS radical scavenging activity and pigments
concentration for these two accessions (Tables 4 and 5). These results indicate that the free radical scavenging activity was increased directly proportional to the increment of pigments concentration in all accessions. So it can be
inferred that these pigments play an important role on
the antioxidant activity showed by BO and RT accessions, nevertheless the Opuntia spp. fruits contain other
compounds with antioxidant activity such as phenolics.
These pigments are appreciated as nutraceutical ingredients
Days after anthesis
(DAA) (mg 100 gIsobetanin-1 DW) (mg 100 gBetanin-1 DW) (mg 100 gIndicaxanthin-1 DW) (mg 100 gTotal betalains-1 DW)
‘Cacalote’ 15-63 77 100 116 143
Correlation with DDPH Correlation with ABTS
0.0±0.0e 0.22±0.01d 0.83±0.05c 2.45±0.02b 3.33±0.04a 0.948* 0.979* 0.0±0.0e 0.94±0.14d 4.03±0.06c 19.84±0.05b 26.63±0.24a 0.924* 0.965* 0.0±0.0c 0.0±0.0c 0.0±0.0c 8.54±0.04b 18.23±0.05a 0.882* 0.918* 0.0±0.0e 1.17±0.15d 4.11±0.11c 29.83±0.08b 48.19±0.26a 0.917* 0.956* ‘Bonda’ 15-49 63 77 100 116 143
Correlation with DDPH Correlation with ABTS
0.0±0.0e 1.38±0.03d 2.08±0.03c 3.05±0.03b 3.12±0.02b 3.58±0.15a 0.988* 0.946* 0.0±0.0e 25.20±0.11d 36.74±0.26c 40.17±0.08b 40.38±0.13b 45.71±0.05a 0.961* 0.895* 0.0±0.0e 3.90±0.01d 5.41±0.04c 15.75±0.10b 29.62±0.26a 29.67±0.45a 0.925* 0.968* 0.0±0.0f 30.48±0.15e 44.23±0.32d 58.97±0.15c 73.12±0.36b 78.96±0.54a 0.988* 0.987* ‘Rojo Toluca’ 15-49 63 77 100 116 143
Correlation with DDPH Correlation with ABTS
0.0±0.0e 1.79±0.07d 2.45±0.07c 2.61±0.03c 3.74±0.05b 4.58±0.34a 0.925* 0.957* 0.0±0.0d 2.60±0.06d 16.42±0.04c 30.07±0.16b 32.32±0.90b 38.09±1.81a 0.985* 0.939* 0.0±0.0f 10.66±0.15e 13.26±0.06d 14.30±0.08c 23.53±0.11b 27.20±0.10a 0.833* 0.894* 0.0±0.0e 15.05±0.15d 32.13±0.17c 46.98±0.20b 61.59±0.26a 69.87±0.29a 0.967* 0.969* ‘Tapon Aguanoso’ 15-77 100 116 143
Correlation with DDPH Correlation with ABTS
0.0±0.0c 0.85±0.02b 3.75±0.10a 3.79±0.15a 0.817* 0.903* 0.0±0.0d 5.34±0.22c 34.25±0.28b 36.34±0.11a 0.839* 0.920* 0.0±0.0c 0.0±0.0c 6.11±0.03b 6.46±0.07a 0.832* 0.913* 0.00d 6.190.22c 44.110.30b 46.590.24a 0.836* 0.918* ‘Grifa’ 15-77 100 116 143
Correlation with DDPH Correlation with ABTS
0.0±0.0c 0.37±0.03b 0.34±0.05b 0.53±0.04a 0.756 0.647 0.0±0.0c 2.56±0.61b 6.14±0.04a 6.31±0.17a 0.800* 0.897* 0.0±0.0d 3.11±0.02c 12.17±0.09b 21.67±0.08a 0.984* 0.976* 0.0±0.0d 6.04±0.64c 18.65±0.10b 28.51±0.24a 0.971* 0.981* ‘Rojo Insurgentes’ 15-63 77 100 116 143
Correlation with DDPH Correlation with ABTS
0.0±0.0d 0.15±0.01c 2.04±0.07b 2.11±0.03b 3.36±0.07a 0.974* 0.933* 0.0±0.0e 0.49±0.02d 9.91±0.06c 15.00±0.02b 25.56±0.06a 0.983* 0.939* 0.0±0.0d 0.0±0.0d 2.72±0.04c 4.12±0.06b 22.83±0.10a 0.830* 0.823* 0.0±0.0e 0.64±0.02d 14.67±0.06c 21.23±0.09b 51.75±0.18a 0.939* 0.882* ‘Orejón’ 15-63 77 100 116 143
Correlation with DDPH Correlation with ABTS
0.0±0.0e 0.43±0.02d 0.76±0.02c 1.62±0.01b 2.73±0.15a 0.933* 0.948* 0.0±0.0e 2.92±0.01d 3.70±0.05c 14.15±0.06b 27.22±0.19a 0.891* 0.924* 0.0±0.0d 0.0±0.0d 2.60±0.01c 4.21±0.01b 25.42±0.19a 0.820* 0.815* 0.0±0.0e 2.96±0.02d 7.06±0.06c 19.98±0.03b 55.37±0.39a 0.873* 0.886* ‘Sangre de Toro’
15-100 116 143
Correlation with DDPH Correlation with ABTS
0.0±0.0c 0.45±0.01b 0.88±0.10a 0.968* 0.918* 0.0±0.0c 3.05±0.04b 11.71±0.26a 0.988* 0.923* 0.0±0.0c 2.71±0.02b 8.59±0.16a 0.989* 0.923* 0.0±0.0c 6.21±0.03b 21.18±0.39a 0.989* 0.824*
Table 1: Evolution of isobetanin, betanin, indicaxanthin and total betalains of twelve red prickly pear fruit accessions from very immature to ripe
effect against oxidative stress (Livrea and Tesoriere, 2006). Moreover, the highest content of total betalains can be an
indicator of ripeness in prickly pear fruits.
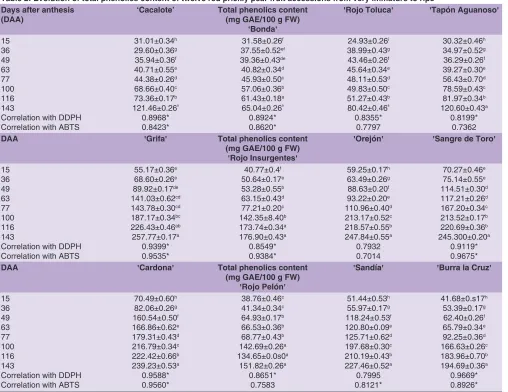
Changes in total phenolics content during the ripening
TPC increased over the ripening process, ranging between 24.93 ± 0.26 mg GAE/100 g FW for RT15, to
257.77 ± 0.17 mg GAE/100 g FW for GR143 (Table 2).
Nevertheless, the most significantly increment in TPC was found between 77 and 100 DAA, when the fruit was from
immature to under-ripe for almost all the accessions except
for CL, RT, and TA, whose maximum change in TPC was found between 116 and 143 DAA, when the fruit changed from moderately ripe to ripe, and for GR and ST, whose maximum changes in TPC were between 49 and 63 DAA for the former and between 63 and 77 DAA for the latter,
when both accessions were immature. The TPC for ripe
fruits varied widely among the accessions, showing as low contents as 65.04 ± 0.17 mg GAE/100 g FW in BO143.
Nevertheless, they were found also high levels of TPC in six out of the twelve accessions studied (GR143, OR143,
ST143, CA143, SA143 and BC143), showing values higher than 194.69 ± 0.36 mg GAE/100 g FW (found in BC143), which are at least twice the TPC displayed by other fruits as peach (Prunus persica(L)Batsch), plum (Prunus salicina var. Santa
Rosa) and nectarine (Prunus persica var. Nectarin) (Gil, et al., 2002; Cantín, et al., 2009; Belhadj, et al., 2016). These high concentrations of phenolics were significantly correlated (positively) with DPPH and/or ABTS radical scavenging activity, except for OR accession, which was not significant neither for DPPH nor for ABTS radical scavenging activity. This result can be due to the antioxidant activity in OR
may be influenced mainly by other compounds such
as flavonoids or betalains. Variations in TPC could be
due to chemical changes of phenolic compounds as the
maturation process occurs, and due to genetic variability among the different accessions, since the cultivation
conditions were controlled and the climate conditions were the same for all the accessions.
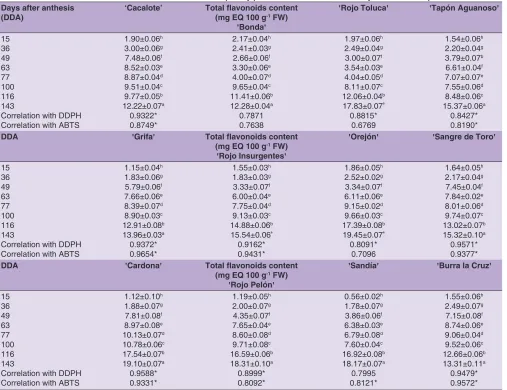
Changes in total flavonoids content during the ripening Significantly statistical differences were found in TFC
during the ripening process of fruits, ranging from
0.56 ± 0.02 mg EQ/100g FW for SA15 to 19.45 ± 0.07 mg EQ/100g FW for OR143 (Table 3). Six out of the twelve accessions studied (GR, RI, OR, CA, RP, and SA)
exhibited the biggest change in TFC between 100 and
116 DAA, when the fruits changed from under-ripe to moderately ripe. The accessions CA, ST, and BC showed the major change in TFC between 36 and 49 DAA, when
Days after anthesis
(DAA) (mg 100 gIsobetanin-1 DW) (mg 100 gBetanin-1 DW) (mg 100 gIndicaxanthin-1 DW) (mg 100 gTotal betalains-1 DW)
‘Cardona’ 15-63 77 100 116 143
Correlation with DDPH Correlation with ABTS
0.0±0.0e
0.23±0.01d
0.67±0.02c
2.16±0.08b
2.40±0.02a
0.925* 0.780
0.0±0.0e
0.78±0.06d
2.12±0.03c
9.93±0.03b
11.28±0.07a
0.984* 0.845*
0.0±0.0c
0.0±0.0c
0.0±0.0c
2.17±0.02b
4.43±0.11a
0.991* 0.926*
0.0±0.0e
1.01±0.06d
2.79±0.03c
14.26±0.09b
18.11±0.17a
0.989* 0.927* ‘Rojo Pelón’
15-77 100 116 143
Correlation with DDPH Correlation with ABTS
0.0±0.0d
0.04±0.01c
0.06±0.02b
0.15±0.01a
0.957* 0.871*
0.0±0.0d
0.96±0.02c
1.40±0.02b
2.60±0.06a
0.973* 0.917*
0.0±0.0d
1.40±0.01c
3.21±0.02b
6.52±0.04a
0.984* 0.947*
0.0±0.0d
2.41±0.01c
4.67±0.02b
9.27±0.08a
0.983* 0.840* ‘Sandía’
15-77 100 116 143
Correlation with DDPH Correlation with ABTS
0.0±0.0d
1.10±0.01c
1.20±0.01b
1.32±0.04a
0.971* 0.953*
0.0±0.0d
5.04±0.05c
7.56±0.38b
8.10±0.01a
0.884* 0.944*
0.0±0.0c
0.0±0.0c 1.41±0.07b
4.11±0.04a
0.983* 0.946*
0.0±0.0d
6.14±0.06c
10.17±0.46b
13.53±0.07a
0.975* 0.981* ‘Burra la Cruz’
15-77 100 116 143
Correlation with DDPH Correlation with ABTS
0.0±0.0d
2.16±0.12c
2.33±0.04b
2.97±0.11a
0.926* 0.872*
0.0±0.0d
7.96±0.06c
12.12±0.03b
12.37±0.10a
0.837* 0.913*
0.0±0.0d
1.31±0.03c 5.10±0.03b
7.72±0.15a
0.969* 0.981*
0.0±0.0d
11.43±0.09c
19.55±0.09b
22.46±0.29a
0.939* 0.973*
Means in each column with different letters are statistically different (Tukey, P≤0.05). *: Significant at P≤0.05. Values are means±standard deviations
the fruit changed from very immature to immature. The accessions RT and TA showed the most marked change between 116 and 143 DAA, when the fruits changed from moderately ripe to ripe. The concentration of flavonoids was significantly correlated (positively) with DPPH and/ or ABTS radical scavenging activity for almost all the accessions, except for BO, which showed a significant correlation between pigments or TPC and DPPH or ABTS radical scavenging activity (as discussed above). The BO accession displayed a marked change in TFC between 77 and 100 DAA, when the fruits change from immature to under-ripe. Times at which the major changes occurred
in TPC did not coincide with those occurred in TFC, this
behavior can be displayed because flavonoids are not the unique type of phenolics present in prickly pear fruits. Opuntia spp. fruits contain flavonoids commonly found in other fruits and vegetables, the type of flavonoid and its content depends on the species and accession (Miean and Mohamed, 2001).
Radical scavenging activity
Independently of the assay (DPPH or ABTS), it was found an increment of the antioxidant activity along the
ripening process. This increment was due to the presence of different kind of chemical compounds with antioxidant
activity in prickly pear fruits. The study of correlation between the bioactive compounds presenting antioxidant activity and the DPPH or ABTS assay reveals that the free radical scavenging activity was dependent on the accession
studied, since each one synthetizes different compounds at different stages of the ripening process, leading a higher
antioxidant activity as the maturity occurs.
Results about DPPH assay showed an increment of the radical scavenging activity over the ripening process in the twelve accessions of prickly pear fruits studied
(Table 4), for example, the radical scavenging activity for RT ranged from1.25 ± 0.02 µmol TE/g FW at 15 DAA to 6.30 ± 0.02 µmol TE/g FW at 143 DAA. In fact, all
Table 2: Evolution of total phenolics content of twelve red prickly pear fruit accessions from very immature to ripe Days after anthesis
(DAA) ‘Cacalote’ Total phenolics content(mg GAE/100 g FW)
ꞌBondaꞌ
ꞌRojo Tolucaꞌ ꞌTapón Aguanosoꞌ
15 36 49 63 77 100 116 143
Correlation with DDPH Correlation with ABTS
31.01±0.34h
29.60±0.36g
35.94±0.36f
40.71±0.55e
44.38±0.26d
68.66±0.40c
73.36±0.17b
121.46±0.26ª
0.8968* 0.8423*
31.58±0.26f
37.55±0.52ef
39.36±0.43de
40.82±0.34d
45.93±0.50c
57.06±0.36b
61.43±0.18a
65.04±0.26ª
0.8924* 0.8620*
24.93±0.26i
38.99±0.43g
43.46±0.26f
45.64±0.34e
48.11±0.53d
49.83±0.50c
51.27±0.43b
80.42±0.46ª
0.8355* 0.7797
30.32±0.46h
34.97±0.52g
36.29±0.26f
39.27±0.30e
56.43±0.70d
78.59±0.43c
81.97±0.34b
120.60±0.43a
0.8199* 0.7362
DAA ꞌGrifaꞌ Total phenolics content (mg GAE/100 g FW)
ꞌRojo Insurgentesꞌ
ꞌOrejónꞌ ꞌSangre de Toroꞌ
15 36 49 63 77 100 116 143
Correlation with DDPH Correlation with ABTS
55.17±0.36e
68.60±0.26e
89.92±0.17de
141.03±0.62cd
143.78±0.30cd
187.17±0.34bc
226.43±0.46ab
257.77±0.17a
0.9399* 0.9535*
40.77±0.4f
50.64±0.17e
53.28±0.55b
63.15±0.43d
77.21±0.20c
142.35±8.40b
173.74±0.34a
176.90±0.43a
0.8549* 0.9384*
59.25±0.17h
63.49±0.26g
88.63±0.20f
93.22±0.20e
110.96±0.40d
213.17±0.52c
218.57±0.55b
247.84±0.55a
0.7932 0.7014
70.27±0.46e
75.14±0.55e
114.51±0.30d
117.21±0.26d
167.20±0.34c
213.52±0.17b
220.69±0.36b
245.300±0.20a
0.9119* 0.9675*
DAA ꞌCardonaꞌ Total phenolics content (mg GAE/100 g FW)
ꞌRojo Pelónꞌ
ꞌSandíaꞌ ꞌBurra la Cruzꞌ
15 36 49 63 77 100 116 143
Correlation with DDPH Correlation with ABTS
70.49±0.60h
82.06±0.26g
160.54±0.50f
166.86±0.62e
179.31±0.43d
216.79±0.34c
222.42±0.66b
239.23±0.53a
0.9588* 0.9560*
38.76±0.46c
41.34±0.34c
64.93±0.17b
66.53±0.36b
68.77±0.43b
142.69±0.26a
134.65±0.0s0a
151.82±0.26a
0.8651* 0.7583
51.44±0.53h
55.97±0.17g
118.24±0.53f
120.80±0.09e
125.71±0.62d
197.68±0.30c
210.19±0.43b
227.46±0.52a
0.7995 0.8121*
41.68±0.s17h
53.39±0.17g
62.40±0.26f
65.79±0.34e
92.25±0.36d
166.63±0.26c
183.96±0.70b
194.69±0.36a
0.9669* 0.8926*
the accessions reached a similar value of free radical scavenging capacity at 143 DAA (when ripe), ranging from 5.77 ± 0.03 µmol TE/g FW for BC143 to 6.60 ± 0.02
for GR143. Correlation of TPC or TFC with DPPH was significant for almost all the accessions, except for the SA accession, which was significantly correlated only with ABTS.
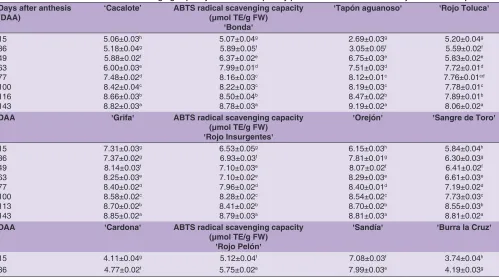
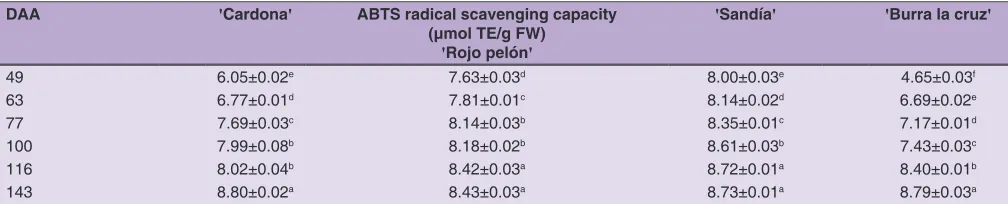
Results about ABTS assay (Table 5) were expressed in the same units used for DPPH in order to make a better comparison between them. It was found the same trend in ABTS than DPPH assay over the ripening process. Nevertheless, the ABTS assay displayed higher values of radical scavenging activity when compared with DPPH. For the same example given above, RT15 displayed
2.69 ± 0.03 µmol TE/g FW increasing until 9.19 ± 0.02 µmol TE/g FW for RT143. For ABTS assay, as in DPPH, all the accessions reached a similar value of free radical scavenging capacity at 143 DAA, ranging from 8.06 ± 0.02 µmol TE/g FW for TA143 to that shown in
RT143. These greater values found when the ABTS radical was used can be explained by the higher selectivity of the DPPH radical. The ABTS radical reacts with any
hydroxylated aromatic molecule, independently of its real
antioxidant potential (Kopjar et al., 2015).
CONCLUSIONS
The antioxidant activity of prickly pear fruits increases along the ripening process, this increment is positively
correlated with the increase in concentration of the
bioactive compounds present in fruits such as phenolics, flavonoids and pigments. The pigments appeared in
different stages of the ripening process, depending on the
accession studied, nevertheless, once the fruit is ripe, their
concentration remains constant. This fact makes possible to propose the measurement of betalains concentration as a parameter of ripeness, additionally to traditional parameters as total soluble solids concentration, titratable acidity and
Table 3: Evolution of total flavonoids content of twelve red prickly pear fruit accessions from very immature to ripe
Days after anthesis
(DDA) ‘Cacalote’ Total flavonoids content(mg EQ 100 g-1 FW) ꞌBondaꞌ
ꞌRojo Tolucaꞌ ꞌTapón Aguanosoꞌ
15 36 49 63 77 100 116 143
Correlation with DDPH Correlation with ABTS
1.90±0.06h
3.00±0.06g
7.48±0.06f
8.52±0.03e
8.87±0.04d
9.51±0.04c
9.77±0.05b
12.22±0.07a
0.9322* 0.8749*
2.17±0.04h
2.41±0.03g
2.66±0.06f
3.30±0.06e
4.00±0.07d
9.65±0.04c
11.41±0.06b
12.28±0.04a
0.7871 0.7638
1.97±0.06h
2.49±0.04g
3.00±0.07f
3.54±0.03e
4.04±0.05d
8.11±0.07c
12.06±0.04b
17.83±0.07ª
0.8815* 0.6769
1.54±0.06h
2.20±0.04g
3.79±0.07b
6.61±0.04f
7.07±0.07e
7.55±0.06d
8.48±0.06c
15.37±0.06a
0.8427* 0.8190*
DDA ꞌGrifaꞌ Total flavonoids content
(mg EQ 100 g-1 FW) ꞌRojo Insurgentesꞌ
ꞌOrejónꞌ ꞌSangre de Toroꞌ
15 36 49 63 77 100 116 143
Correlation with DDPH Correlation with ABTS
1.15±0.04h
1.83±0.06g
5.79±0.06f
7.66±0.06e
8.39±0.07d
8.90±0.03c
12.91±0.08b
13.96±0.03a
0.9372* 0.9654*
1.55±0.03h
1.83±0.03g
3.33±0.07f
6.00±0.04e
7.75±0.04d
9.13±0.03c
14.88±0.06b
15.54±0.06ª
0.9162* 0.9431*
1.86±0.05h
2.52±0.02g
3.34±0.07f
6.11±0.06e
9.15±0.02d
9.66±0.03c
17.39±0.08b
19.45±0.07ª
0.8091* 0.7096
1.64±0.05h
2.17±0.04g
7.45±0.04f
7.84±0.02e
8.01±0.06d
9.74±0.07c
13.02±0.07b
15.32±0.10a
0.9571* 0.9377*
DDA ꞌCardonaꞌ Total flavonoids content
(mg EQ 100 g-1 FW) ꞌRojo Pelónꞌ
ꞌSandíaꞌ ꞌBurra la Cruzꞌ
15 36 49 63 77 100 116 143
Correlation with DDPH Correlation with ABTS
1.12±0.10h
1.88±0.07g
7.81±0.08f
8.97±0.08e
10.13±0.07d
10.78±0.06c
17.54±0.07b
19.10±0.07a
0.9588* 0.9331*
1.19±0.05h
2.00±0.07g
4.35±0.07f
7.65±0.04e
8.60±0.08d
9.71±0.08c
16.59±0.06b
18.31±0.10a
0.8999* 0.8092*
0.56±0.02h
1.78±0.07g
3.86±0.06f
6.38±0.03e
6.79±0.08d
7.60±0.04c
16.92±0.08b
18.17±0.07a
0.7995 0.8121*
1.55±0.06h
2.49±0.07g
7.15±0.08f
8.74±0.06e
9.06±0.04d
9.52±0.06c
12.66±0.06b
13.31±0.11a
0.9479* 0.9572*
Table 4: Evolution of DPPH radical scavenging capacity of twelve red prickly pear fruits from very immature to ripe Days after anthesis
(DAA) ‘Cacalote’ DPPH radical scavenging capacity(µmol TE/g FW)
ꞌBondaꞌ
ꞌRojo Tolucaꞌ ꞌTapón Aguanosoꞌ 15 36 49 63 77 100 116 143 2.69±0.03g 2.60±0.03h 3.89±0.02f 3.98±0.03e 4.52±0.01d 4.62±0.03c 5.75±0.02b 6.48±0.03a 2.46±0.03g 3.69±0.03f 4.53±0.04e 4.90±0.02d 6.14±0.01c 6.28±0.02b 6.32±0.02b 6.54±0.03a 1.25±0.02g 1.61±0.04f 2.07±0.02e 2.34±0.04d 5.19±0.02c 5.77±0.03b 6.24±0.01c 6.30±0.02d 3.07±0.04f 4.00±0.03e 4.30±0.02d 4.49±0.02c 5.94±0.01b 5.97±0.01b 5.99±0.01b 6.07±0.01a
DAA ꞌGrifaꞌ DPPH radical scavenging capacity (µmol TE/g FW)
ꞌRojo Insurgentesꞌ
ꞌOrejónꞌ ꞌSangre de Toroꞌ
15 36 49 63 77 100 116 143 3.34±0.03h 4.49±0.04g 5.19±0.02f 5.44±0.04e 5.67±0.02d 6.35±0.02c 6.46±0.01b 6.60±0.02a 3.58±0.04h 4.11±0.04g 5.02±0.04f 5.33±0.02e 5.46±0.03d 5.76±0.02c 6.12±0.02b 6.42±0.01a 3.26±0.05h 4.11±0.04g 4.73±0.02f 6.01±0.01e 6.21±0.02d 6.37±0.02c 6.46±0.01b 6.57±0.02a 3.00±0.03h 3.98±0.05g 4.49±0.03f 4.73±0.02e 4.93±0.02d 5.08±0.02c 5.53±0.02b 5.99±0.01ª
DAA ꞌCardonaꞌ DPPH radical scavenging capacity (µmol TE/g FW)
ꞌRojo Pelónꞌ
ꞌSandíaꞌ ꞌBurra la Cruzꞌ
15 36 49 63 77 100 116 143 1.98±0.03h 2.60±0.03g 3.16±0.03f 3.67±0.02e 4.65±0.02d 5.21±0.01c 5.92±0.02b 6.15±0.06a 2.64±0.05g 3.26±0.04f 3.94±0.03e 4.42±0.02d 5.87±0.02c 6.01±0.01b 6.26±0.03a 6.30±0.02a 3.98±0.05g 4.73±0.02f 5.45±0.03e 6.15±0.03d 6.15±0.02d 6.26±0.02c 6.42±0.01b 6.57±0.03a 1.25±0.02h 1.98±0.03g 2.88±0.03f 3.22±0.03e 3.57±0.02d 5.15±0.02c 5.52±0.01b 5.77±0.03a Means in each column with different letters are statistically different (Tukey, P≤0.05). Values are means±standard deviations
Days after anthesis
(DAA) ‘Cacalote’ ABTS radical scavenging capacity(µmol TE/g FW)
ꞌBondaꞌ
ꞌTapón aguanosoꞌ ꞌRojo Tolucaꞌ
15 36 49 63 77 100 116 143 5.06±0.03h 5.18±0.04g 5.88±0.02f 6.00±0.03e 7.48±0.02d 8.42±0.04c 8.66±0.03b 8.82±0.03a 5.07±0.04g 5.89±0.05f 6.37±0.02e 7.99±0.01d 8.16±0.03c 8.22±0.03c 8.50±0.04b 8.78±0.03a 2.69±0.03g 3.05±0.05f 6.75±0.03e 7.51±0.03d 8.12±0.01c 8.19±0.03c 8.47±0.02b 9.19±0.02a 5.20±0.04g 5.59±0.02f 5.83±0.02e 7.72±0.01d 7.76±0.01cd 7.78±0.01c 7.89±0.01b 8.06±0.02a
DAA ꞌGrifaꞌ ABTS radical scavenging capacity (µmol TE/g FW)
ꞌRojo Insurgentesꞌ
ꞌOrejónꞌ ꞌSangre de Toroꞌ
15 36 49 63 77 100 113 143 7.31±0.03g 7.37±0.02g 8.14±0.03f 8.25±0.03e 8.40±0.02d 8.58±0.02c 8.70±0.02b 8.85±0.02a 6.53±0.05g 6.93±0.03f 7.10±0.03e 7.10±0.02e 7.96±0.02d 8.28±0.02c 8.41±0.02b 8.79±0.03a 6.15±0.03h 7.81±0.01g 8.07±0.02f 8.29±0.03e 8.40±0.01d 8.54±0.02c 8.70±0.02b 8.81±0.03a 5.84±0.04h 6.30±0.03g 6.41±0.02f 6.61±0.03e 7.19±0.02d 7.73±0.03c 8.55±0.03b 8.81±0.02a
DAA ꞌCardonaꞌ ABTS radical scavenging capacity (µmol TE/g FW)
ꞌRojo Pelónꞌ
ꞌSandíaꞌ ꞌBurra la Cruzꞌ
15 4.11±0.04g 5.12±0.04f 7.08±0.03f 3.74±0.04h
36 4.77±0.02f 5.75±0.02e 7.99±0.03e 4.19±0.03g
Table 5: Evolution of ABTS radical scavenging capacity of twelve red prickly pear fruit accessions from very immature to ripe
color. It is hoped that this work contributes to select the
accessions with the better potential to be established in
arid zones of Mexico in order to take in advantage these fruits as an important source of pigments. Moreover, this
work can contribute to the knowledge of the stage of the ripening process at which would be possible to obtain a
major concentration of bioactive compounds taking as
reference the anthesis.
ACKNOWLEDGEMENTS
The authors thank FOMIX-CONACYT-HIDALGO for the financial support (project number 195462).
Author's contributions
J.M.P.E: Carried out the experiments. C.L.A.M: Supervised and planned the research. R.J.A: Wrote the manuscript and was involved in critical revision. J.C.R.P: Designed
experimental procedures and did the statistical analyses.
G.I. de la F: Participate in the supervision and critical revision. J.G.R.P: Harvested the prickly pear accessions and did their selection and classification. A.D.H.F: Proposed the research topic, was involved in the overall planning and supervision, and submitted the manuscript.
REFERENCES
Arvouet-Grand, A., B. Vennat, A. Pourrat and P. Legret. 1994. Standardization d’une extrait de propolis et identification des principaux constituents. J. Pharm. Belg. 49: 462-468.
Belhadj, F., I. Somrani, N. Aissaoui, C. H. Messaoud, M. Boussaid and M. N. Marzouki. 2016. Bioactive compounds contents, antioxidants and antimicrobial activities during ripening of
Prunus persica L. Varieties from the North West of Tunisia. Food Chem. 204: 29-36.
Bensadón, S., D. Hervert-Hernández, S. G. Sáyago-Ayerdi and I. Goñi. 2010. By-products of Opuntia ficus-indica as a source of antioxidant dietary fiber. Plant Food Hum. Nutr. 65: 210-216. Brand-Williams, W., M. E. Cuvelier and C. Berset. 1995. Use of a free
radical method to evaluate antioxidant activity. LWT-Food Sci. Technol. 28(1): 25-30.
Cantin, C. M., M. A. Moreno and Y. Gogorcena. 2009. Evaluation of the antioxidant capacity, phenolic compounds, and vitamin C content of different peach and nectarine [Prunus persica (L.) Batsch]
breeding progenies. J. Agric. Food Chem. 57(11): 4586-4592. Castellar, M. R., J. M. Obón, M. Alacid and J. A. Fernández-López.
2003. Color properties and stability of betacyanins from Opuntia
fruits. J. Agric. Food Chem. 51: 2772-2776.
Castellar, M., R. Obón, J. M. Alacid and J. A. Fernández-López. 2006. The isolation and properties of a concentrated red-purple betacyanin food colorant from Opuntiastricta fruits. J. Sci. Food Agric. 86: 122-128.
Felker, P., F. C. E. Stintzing, E. Müssig, M. Leitenberger, R. Carle, T. Vogt and R. Bunch. 2008. Colour inheritance in cactus pear (Opuntia ficus-indica) fruits. Ann. Appl. Biol. 152: 307-318. Fernández-López, J. A., L. Almela, J. M. Obón and M. R. Castellar.
2010. Determination of antioxidant constituents in cactus pear fruits. Plant. Food Hum. Nutr. 65: 253-259.
Gil, M. I., F. A. Tomás-Barberán, B. Hess-Pierce and A. A. Kader. 2002. Antioxidant capacities, phenolic compounds, carotenoids and vitamin C contents of nectarine, peach and plum cultivars from California. J. Agric. Food Chem. 50(17): 4976-4982. Kopjar, M., M. Tadić and V. Piližota. 2015. Phenol content and
antioxidant activity of green, yellow and black tea leaves. Chem. Biol. Technol. Agric. 2: 1-6.
Kujala, T., J. Loponen and K. Pihlaja. 2001. Betalains and phenolics in red beet root (Beta vulgaris) peel extracts: Extraction and characterization. Z. Naturforsch B. 56: 343-348.
Kujala, T. S., M. S. Vienola, K. D. Klika, J. M. Loponen and K. Pihlaja. 2002. Betalain and phenolic compositions of four beetroot (Beta vulgaris) cultivars. Eur. Food Res. Technol. 214: 505-510. Livrea, M. A. and L. Tesoriere. 2006. Health benefits and bioactive
components of the fruits from Opuntia ficus-indica (L.) Mill. J. Prof. Assoc. Cactus. 8: 73-90.
Miean, K. H. and S. Mohamed. 2001. Flavonoid (myricetin, quercetin, kaempferol, luteolin and apigenin) content of edible tropical plants. J. Agric. Food Chem. 49: 3106-3112.
Moßhammer, M. R., F. C. Stintzing and R. Carle. 2005. Development of a process for the production of a betalain-based colouring foodstuff from cactus pear. Innov. Food Sci. Emerg. 6(2): 221-231. Obón, J. M., M. R. Castellar, M. Alacid and J. A. Fernández-López.
2009. Production of a red-purpled food colorant from Opuntia stricta fruits by spray drying and its application in food model systems. J. Food Eng. 90: 471-479.
Pimienta, E. 2001. Preface. In: Mondragon-Jacobo, C. and S. Pérez-González, (Ed.), Cactus (Opuntia spp.) As Forage. FAO Plant Production and Protection Paper No. 169, FAO, Rome. Re, R., N. Pellegrini, A. Proteggente, A. Pannala, M. Yanga and C.
A. Rice-Evans. 1999. Antioxidant activity applying an improved ABTS radical cation decolorization assay. Free Radic. Biol. Med. 26: 1231-1237.
SAS®. 2002. System Version 9 for Microsoft Windows, Institute Inc.,
49 6.05±0.02e 7.63±0.03d 8.00±0.03e 4.65±0.03f
63 6.77±0.01d 7.81±0.01c 8.14±0.02d 6.69±0.02e
77 7.69±0.03c 8.14±0.03b 8.35±0.01c 7.17±0.01d
100 7.99±0.08b 8.18±0.02b 8.61±0.03b 7.43±0.03c
116 8.02±0.04b 8.42±0.03a 8.72±0.01a 8.40±0.01b
143 8.80±0.02a 8.43±0.03a 8.73±0.01a 8.79±0.03a
Means in each column with different letters are statistically different (Tukey, P≤0.05). Values are means±standard deviations
DAA ꞌCardonaꞌ ABTS radical scavenging capacity (µmol TE/g FW)
ꞌRojo pelónꞌ
ꞌSandíaꞌ ꞌBurra la cruzꞌ
Cary, North Carolina, USA.
Stintzing, F. C., A. Schieber and R. Carle. 2002. Betacyanins in fruits of deep-purple pitaya, Hylocereus polyrhizus (Weber) Britton & Rose. Food Chem. 77: 101-106.
Stintzing, F. C. and R. Carle. 2005. Cactus stems (Opuntia spp.): Areview on their chemistry, technology, and uses. Mol. Nutr. Food Res. 49(2): 175-194.
Stintzing, F. C. and R. Carle. 2007. Betalains emerging prospects for food scientists. Trends Food Sci. Technol. 18: 514-525. Sumaya-Martínez, M. T., S. Cruz-Jaime, E. Madrigal-Santillán, J. D.
García-Paredes, R. Cariño-Cortés, N. Cruz-Cansino, C. Valadez-Vega, L. Martínez-Cárdenas and E. Alanís-García. 2011. Betalain, acid ascorbic, phenolic contents and antioxidant
properties of purple, red, yellow and white cactus pears. Int. J. Mol. Sci. 12: 6152-6168.
Tesoriere, L., M. Fazzari, M. Allegra and M. A. Livrea. 2005. Biothiols, taurine, and lipid- soluble antioxidants in the edible pulp of Sicilian cactus pear (Opuntia ficus-indica) fruits and changes of bioactive juice components upon industrial processing. J. Agric. Food Chem. 53: 7851-7855.
Tsai, P. J., Y. S. Chen, C. H. Sheu and C. Y. Chen. 2011. Effect of nanogrinding on the pigment and bioactivity of djulis (Chenopodium formosanum Koidz.). J. Agric. Food Chem. 59: 1814-1820.