IJSRSET1738144 | Received : 20 April 2018 | Accepted : 30 April 2018 | March-April-2018 [(4) 4 : 1509-1514 ]
Student Performance and Academic Pattern Analysis
Dr. Siddhartha Ghosh1, Kandula Neha2, Ballari Saha31Professor in CSE and Head of Placements, Vidya Jyothi Institute of Technology, Aziz Nagar, Hyderabad,
Telangana, India
2M.Tech, Assistant Professor, Department of CSE, Vidya Jyothi Institute of Technology, Aziz Nagar,
Hyderabad, Telangana, India
3Assistant TPO & Soft Skills Trainer, Department of Placements, Vidya Jyothi Institute of Technology, Aziz
Nagar, Hyderabad, Telangana, India
ABSTRACT
Education being the most important factor influencing the society, it has to be carried out in an organised and effective way. The students who are part of any educational institution should be analysed and treated in the ways that best suits them rather than treating all of them with a single ideology. Data Analytics being the field of science, of analysing the present data trends to come to a conclusion which can be used for future improvements, can be used in this scenario to understand the student’s ideology and respond accordingly. By analysis the student’s academic performance data we can draw patterns of their behaviour and can then draw conclusive changes that may help lead them to a better performance scope. Traditional academic approaches rarely analyse the student’s performance data and look upon them for any conclusive changes to be implemented for the enhanced academic results. This leads to treating all the students with a single ideology without any involvement of improvement and without looking into the sectors which needs to be improved. This type of approach are very ineffective when compared to an analysed approach. In this fast pace world of analysis, we can apply data analysis to elucidate this gap by analysis the student’s performance data and then draw effective conclusions and prediction from them By applying data analysis over the student performance data we can get a clear picture of student’s participation/involvement in the programs conducted by the institute. We will also get a clear idea of the performance curve of the students and their behavioural patterns. At last we can use these results to take the best move accordingly which helps them to improve their performance and lead them to an effective academic approach.
Keywords : Routing, non-repudiation, Byzantine failure, MANET, Security, Authentication, Integrity, Non-repudiation, Confidentiality, Key and Trust Management(KTM).
I.
INTRODUCTIONData analysis is a process of inspecting, cleansing, transforming, and modelling data with the goal of discovering useful information, suggesting conclusions, and supporting decision making. Data analysis has multiple facets and approaches, encompassing diverse techniques under a variety of
names, in different business, science, and social science domains.
solutions and customer experience management solutions that utilize data analysis to transform data into actionable insights.
Data mining is a particular data analysis technique that focuses on modeling and knowledge discovery for predictive rather than purely descriptive purposes, while business intelligence covers data analysis that relies heavily on aggregation, focusing on business information. In statistical applications, data analysis can be divided into descriptive statistics, exploratory data analysis (EDA), and confirmatory data analysis (CDA). EDA focuses on discovering new features in the data and CDA on confirming or falsifying existing hypotheses. Predictive analytics focuses on application of statistical models for predictive forecasting or classification. The process of data analysis refers to breaking a whole into its separate components for individual examination. Data analysis is a process for obtaining raw data and converting it into information useful for decision-making by users. Data is collected and analysed to answer questions, test hypotheses or disprove theories.
There are several phases that can be distinguished, described below. The phases are iterative, in that feedback from later phases may result in additional work in earlier phases.
Data Requirements: The data is necessary as inputs to the analysis, which is specified based upon the requirements of those directing the analysis or customers. The general type of entity upon which the data will be collected is referred to as an experimental unit Specific variables regarding a population may be specified and obtained. Data may be numerical or categorical.
Data Collection: Data is collected from a variety of sources. The requirements may be communicated by analysts to custodians of the data, such as information technology personnel within an organization. The data may also be collected from sensors in the
environment, such as traffic cameras, satellites, recording devices, etc.
Data Cleaning: The first step in data analysis is to improve data quality. Data scientists correct spelling mistakes, handle missing data and weed out nonsense information. This is the most critical step in the data value chain, even with the best analysis, junk data will generate wrong results and mislead the business.
Exploratory Data Analysis: Once the data is cleaned, it can be analysed. Analysts may apply a variety of techniques referred to as exploratory data analysis to begin understanding the messages contained in the data..
Data Modelling: Data scientists build models that correlate the data with the business outcomes and make recommendations regarding changes to the levers identified in the first step. This is where the unique expertise of data scientists becomes critical to business success, correlating the data and building models that predict business outcomes
Communication: Once the data is analysed, it may be reported in many formats to the users of the analysis to support their requirements. The users may have feedback, which results in additional analysis.
Data visualization uses information displays (such as tables and charts) to help communicate key messages contained in the data. Tables are helpful to a user who might lookup specific numbers, while charts (e.g., bar charts or line charts) may help explain the quantitative messages contained in the data.
Present Scenario in Data Analysis
understand ability of the data it makes it very complex to draw any concrete conclusions from it.
Apart from the analysis part, the current day system doesn’t provide a method/component which can store these huge amounts of important data in an ordered way. There is no proper mechanism of data storage in the current system. The data is not stored in a centrally modelled way and there is no proper access hierarchy to these data. The working mechanism of the existing system is very outdated and lacks a lot of improvement in the field of data storage, data cleaning, data filtering, data modelling and data analysis. It works on a very small scale and cannot be applied when there is an involvement of huge data sectors.
The following are some disadvantages of the current scenario:
1. Lack of a proper data storing system: The data is not stored in a proper database and is not filtered and cleaned prior to the analysis part which may lead to inaccurate results.
2. Lack of Visibility: As the data is not cleaned and filtered it makes it very difficult to view the data and get a clear picture of it. It makes the data very difficult to understand and draw any concrete conclusions from it.
3. Lack of Data Analysis: The data is rarely analysed and looked upon on a larger perspective to draw a predictive conclusions. These leads to an ineffective way of understanding the data on a whole and drawing conclusions which may not be effective in nature.
Data Visualisation Techniques Used
By making use of the data analysis methodologies we can analyse the student’s academic data and making a generalized view of the progress pattern which will help us to understand the causes and area of improvement to increase the progress and also the
factors effecting the progress and the patterns influencing them.
The proposed system can be defined as a platform/system which take the student’s academic data, filters and model them, stores them in a centralized storage location and then use this
centralized storage to fetch the data, analyse it, and draw effective conclusions from it.
The present system has the following features:
1) An effective mechanism to store the data in a centralized storage area, reducing the risk of being manipulated or removed.
2) The data stored are filtered and cleaned prior to the storing which makes it normalized and reduces any latency.
3) The student’s academic data is then further analysed by the data analysis tools like Qlik Sense in-order to get an effective analysed reports/visualised sheets.
4) These sheets are then integrated into dynamic web project which provides an upper edge in sharing the results. These results can be viewed by everyone and can give them the scope to understand the performance curve and improve themselves.
5) The web project provided will also have access hierarchy to maintain the data integrity and authenticity.
Techniques Implemented for Patterns analysis
Qlik Sense: Qlik Sense is a platform for data analysis. With Qlik Sense you can analyse data and make data discoveries on your own. You can share knowledge and analyse data in groups and across organizations.
Qlik Sense Working Mechanism: Qlik Sense generates views of information on the fly for you. Qlik Sense does not require predefined and static reports or you being dependent on other users. It instantly responds, updating every visualization and view in the app with a newly calculated set of data and visualizations specific to your selections.
Collaboration and mobility: Qlik Sense further enables you to collaborate with colleagues no matter when and where they are located. All Qlik Sense capabilities, including the associative experience and collaboration, are available on mobile devices..
Feature of Qlik Sense: Qlik Sense has many dynamic features that are flexible enough for all types of users. Some of its best features are listed below:
1) Smart search – The search bar function allows you to type in keywords and phrases to quickly locate data sets, graphs/charts, reports and more.
2) Self-service creation – Drag-and-drop capabilities offer easy dashboard and report creation without the need for scripting, complex queries or joins.
3) Centralized management – Qlik Sense acts as one central location for users to develop and share apps, data stories and insights quickly and efficiently.
4) Data integration – Unify disparate data sources on a single platform. Also, Qlik Sense doesn’t “hide” any data. When manipulating views and dimensions, irrelevant data is “greyed out” instead of disregarded, so you’re still able to discover hidden trends.
5) Interactive visualizations – Qlik Sense offers users simple visualization creation that instantly responds to changes in dimensions and data context.
6) Data storytelling – Easily share multiple viewpoints at once while assigning context to data. Storytelling features can also access the original analysis so users can quickly drill
down into data to answer questions and change viewpoints.
7) Responsive design – Whether on desktop, tablet or smartphone (or if you’re simply changing the size of your browser window), Qlik Sense automatically adjusts to give you the best view of its apps.
8) Qlik Sense is made for all kinds of users (from the least tech-savvy executive to the data expert) in all types of organizations. Qlik Sense has been used in finance, IT, engineering support services, HR and more
Data Visualization Experimental Results for student performance and academic pattern analysis
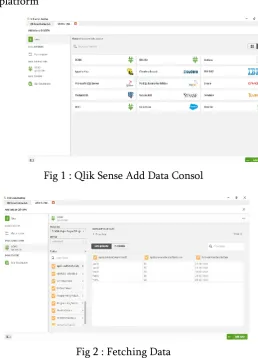
The below results shows the Acquiring data from database steps being implemented in the Qlik Sense platform
Fig 1 : Qlik Sense Add Data Consol
Fig 2 : Fetching Data
These data will be fetched from the database and will be used for the analysis.
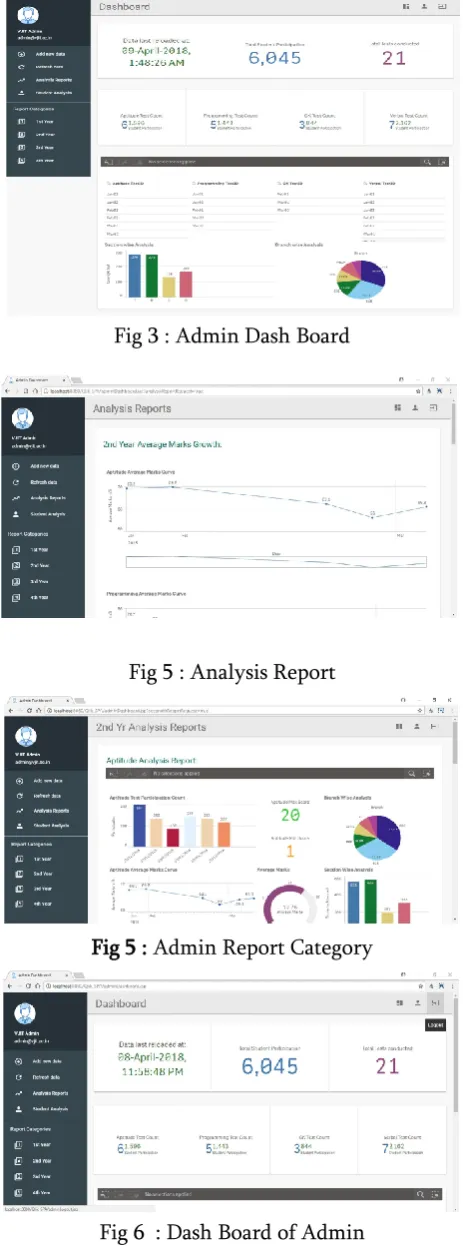
Fig 3 : Admin Dash Board
Fig 5 : Analysis Report
Fig 5 : Admin Report Category
Fig 6 : Dash Board of Admin
The above figure gives the summary report of the students and their academic performance.
II.
ConclusionBy integrating and applying data analysis over the student academic data, we are getting the analysed reports of the academic progress. With the help of these reports we can tract down the progress curve of the student and then can take the necessary steps required to improve the curve. This analysis also helps us to get an exact figure of the student’s involvements in the academic programs.
The project also helps in providing a platform for a centralized data storage system. This data storage system is self-sustainable and can take inputs from all the platforms. This project also helps to track down the academic progress of one particular student though the “Student Module” feature. Apart from this, it also shows the overall status of all the branches of an institute/college. This view is again further segmented into branches and sections. The user can choose the parameter based of their interest. Hence with the help of data analysis and the effective data modelling module, this project strives to full fill all the gaps that prevails in the data analysis field of most of the current day institute.
III.
Future EnhancementThe current system developed can be further enhanced by integrating the module that performs and cross validates data analysis over the student attendance over the student academic progress. By doing so we can further predict the performance curve of the student and take the appropriate steps that can improve the student’s performance.
can be extended in multiple dimensions in order to make it more self-sufficient and more self-predictive
IV.
REFERENCES1. Ajjan, H., & Hartshorne, R. (2009). Investigating faculty decisions to adopt Web 2.0 technologies: Theory and empirical tests. Internet and Higher Education, 11(2), 71- 80. Retrieved from http://www.elsevier.com/wps/find/journaldescri ption.cws_home/620187/descriptio #description. https://doi.org/10.1016/j.iheduc.2008.05.002 2. Arnold, K. E. (2010). Signals: Applying academic
analytics. Educause Quarterly, 33 (1) Retrieved from
http://www.educause.edu/EDUCAUSE+Quarterl y/EDUCAUSEQuarterlyMagazineVolu
m/SignalsApplyingAcademicAnalyti/199385. 3. Black, E. W., Dawson, K., & Priem, J. (2008).
Data for free: Using LMS activity logs to measure community in online courses. Internet and Higher Education, 11(2), 65- 70. http://www.elsevier.com/wps/find/journaldescri ption.cws_home/620187/description
#description.
https://doi.org/10.1016/j.iheduc.2008.03.002 4. Campbell, J. P. (2007). Utilizing student data
within the course management system to determine undergraduate student academic success: An exploratory study. Unpublished doctoral dissertation, Purdue University.
5. Data Analytics in Academics, International Conference On Data Science And Analytics (ICDSA’17). 23 September 2017
6. Educause, 2010. 7 Things you should know about analytics, EDUCAUSE 7 things you should know series. Retrieved October 1, 2010 from http://www.educause.edu/ir/library/pdf/ELI7059. pdf
7. Enhancing Traditional Academic Processes Using Analytics, IICMR International Research Journal I4,Vol.12, Issue 1,Feb 2018,ISSN No.0975 2757 SJIF 2016:4.8
8. Gasevic, D., Conole, G., Siemens, G., Long, P. (Eds). (2011) LAK11: International Conference on Learning Analytics and Knowledge, Banff, Canada, 27 February - 1 March 2011
9. Siemens, G. (2011). How data and analytics can improve education, July 2011. Retrieved August
8, October 30, 2014, from
http://radar.oreilly.com/2011/07/education-data-analytics-learning.htmlGoogle Scholar
10. Xu, B. & Recker, M. (2012). Teaching analytics: a clustering and triangulation study of digital library user data. Educational Technology & Society, 15, 3, 103–115.Web of Science®Google Scholar
Websites
1. https://www.ibm.com/communities/analytics/ 2. https://vjit.ac.in
3. https://www.qlik.com/us
4. https://www.qlik.com/us/products/qlik-sense 5. https://en.wikipedia.org/wiki/Data_analysis 6. https://www.techopedia.com/definition/26202/dat
a-filtering
7. http://materializecss.com
8. https://www.mkyong.com/java/apache-poi-reading-and-writing-excel-file-in-java
Books
9. Data Analytics Made Accessible, by A. Maheshwari.
10. Database modeling, by Robert C. Blattberg, Byung-Do Kim, Scott A. Neslin.
11. Data driven analysis, by Mark Jeffery,
12. An introduction to Data Modeling, by W. N. Venables, D. M. Smith and the Ray Core Team. 13. Predictive analysis: The power to predict who