R E S E A R C H
Open Access
Recurrent genetic alterations in hepatitis
C-associated hepatocellular carcinoma detected
by genomic microarray: a genetic, clinical and
pathological correlation study
Yajuan J Liu
*, Yang Zhou and Matthew M Yeh
Abstract
Background:In the US, approximately 50% of hepatocellular carcinoma (HCC) is caused by hepatitis-C virus (HCV) infection. The molecular mechanism of a malignant transformation of hepatocyte induced by HCV infection is still largely unclear. There are several clinical and pathological staging systems for HCC, but none of them include biological parameters as predictors for prognosis and there has not been a standardized molecular classification of HCC. To understand the underlying pathogenic genetic alterations in HCV-associated HCC and aid in molecular classification of HCC and patient prognosis, microarray analysis of DNA copy number alterations in HCC were conducted using whole genome microarray with DNA from formalin-fixed paraffin-embedded (FFPE) specimens of both cancer tissues and paired nearby cirrhotic non-neoplastic tissues.
Results:Our results show that the most common chromosomal aberrations (>5 Mb) observed in HCC were chromosomal gains of 1q (80%), 8q (60%), 7q (40%), 5p (33%), 7p (33%), Xq (33%), 5q (27%), and Xp (20%), as well as chromosome losses of 17p (40%), 4q21.21-q26 (33%), 8p (33%), 1p36.11-pter (20%), and 9p (20%). Statistically significant smaller copy number alterations (3.9 kb to 644 kb) were identified using STAC algorithm, including losses ofFGFR3, RECQL4,NOTCH1, PTEN, TSC2, and/orASPSCR1and gains ofETV1and/orMAF. Correlation analysis between genetic data and pathological data showed that gain of 1q21.1-q23.2 and gain of 8q11.1q13.1 are significantly associated with grade 2–4 and moderately or poorly differentiated HCCs, and gain of chromosome 5q was significantly associated with HCCs with vascular invasion, while gain of chromosome 7q is significantly associated with stage I HCCs.
Conclusions:This study has provided a detailed map of genomic aberrations occurring in HCV-associated HCC and has suggested candidate genes. In addition, gene enrichment analysis on the recurrent abnormal regions indicated NF- kappaB and BMP signaling pathways in HCC development and progression. This study demonstrated that genomic microarray test can be used to distinguish HCC from non- neoplastic cirrhotic nodules and to identify prognostic factors associated with HCC progression using pathologically characterized FFPE samples. Our data support the utility of genomic microarray test for the diagnosis, risk stratification, and pathogenic studies of HCC.
Keywords:Hepatocellular carcinoma, Hepatitis-C virus, Copy number aberration, Copy number variants, Genomic microarray, Prognosis, Pathological correlation
* Correspondence:[email protected]
Department of Pathology, University of Washington, 1959 NE Pacific Street, Box 357470, Seattle, WA 98195, USA
© 2014 Liu et al.; licensee BioMed Central Ltd. This is an Open Access article distributed under the terms of the Creative Commons Attribution License (http://creativecommons.org/licenses/by/4.0), which permits unrestricted use, distribution, and reproduction in any medium, provided the original work is properly credited. The Creative Commons Public Domain Dedication waiver (http://creativecommons.org/publicdomain/zero/1.0/) applies to the data made available in this article, unless otherwise stated.
Liuet al. Molecular Cytogenetics2014,7:81
Background
Hepatocellular carcinoma (HCC) is one of the most common malignant neoplasm and represents the third leading cause of cancer-related death worldwide [1,2]. The incidence of HCC is increasing in the United States and Europe, mostly because of the high preva-lence of hepatitis C virus (HCV) infection [3,4]. The molecular mechanism of a malignant transformation of hepatocyte induced by HCV infection is still largely unclear. The lack of good cellular and animal models of HCV hepatocarcinogenesis further hampers the un-derstanding of the underlying mechanisms. Given that HCV is an RNA virus which replicates in the cyto-plasm and has little potential for integration of its genome into host DNA [5,6], liver cirrhosis has gener-ally been considered a prerequisite for HCV-infected livers to develop HCC. The pathogenesis of HCC in chronic HCV infection is generally accepted as chronic in-flammation and injury, which leads to fibrosis with even-tual progression to cirrhosis and subsequent development of HCC [7]. There are several clinical and pathological sta-ging systems for HCC, but none of them include bio-logical parameters as predictors for prognosis [8], and there has not been a standardized molecular classification of HCC. The low efficacy of systemic chemotherapies for HCC (<40%) [7] encourage intensive investigation to iden-tify the molecular mechanisms implicated in the carcino-genesis of HCV associated HCC, an area of great need.
This study aimed to determine the patterns of recur-rent genetic alterations and common pathways involved in the development and progression of HCV-associated HCC using high resolution genomic microarray analysis
and the correlations of genetic alterations with tumor phenotype, clinical presentation and outcome to im-prove the identification of risk factors in molecular HCC subtypes. Although genomic studies for characterization of DNA copy number alterations of HCV-associated HCC [9,10] or HCC due to various or unspecified etiolo-gies [11-14] have been conducted, these studies used ei-ther conventional comparative genome hybridization (CGH) on metaphase cells or low density Bacterial Arti-ficial Chromosome (BAC) clone array-based CGH ana-lysis, therefore, submicroscopic and small copy number alterations could be undetected. In addition, no correl-ation analysis between genetic altercorrel-ations and clinical and pathological data of HCC was conducted to define clinically relevant subtypes for prognosis. Furthermore, all the specimens used in this study were formalin-fixed paraffin-embedded (FFPE) HCC tissues, demonstrating the feasibility of whole genome microarray analysis using FFPE HCC specimens, and paired non-neoplastic cir-rhotic nodules were also examined for comparison.
Results
Clinical and pathologic characterizations of HCC specimens
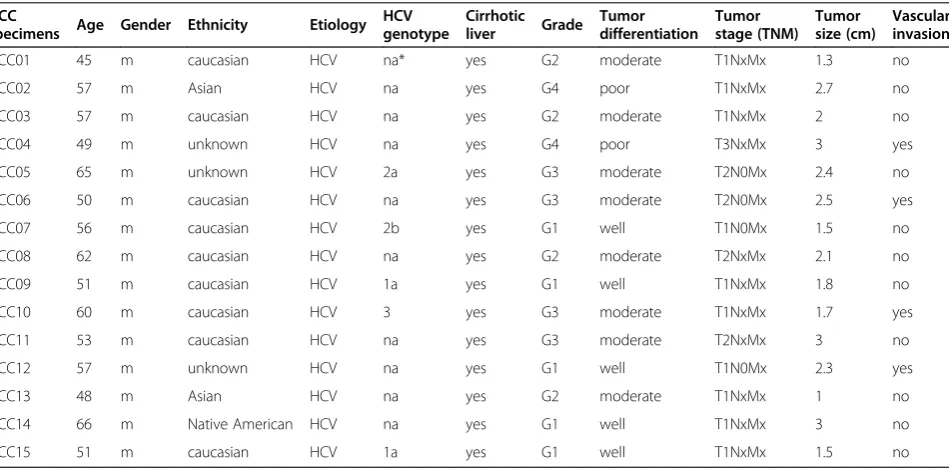
A total of 15 cases from which the paraffin blocks con-tained enough tumors for DNA isolation were included. The patients’ demographics, clinical and pathologic fea-tures of the specimens are summarized in Table 1. The age of these patients ranged from 45 to 67 years with an average of 56 years. The tumor size ranged from 1 to 4 cm with an average of 2.2 cm. Pathological examinations of the background livers in the explanted specimens showed
Table 1 Summary of the patient demographics, clinical and pathologic features of the HCC specimens
HCC
specimens Age Gender Ethnicity Etiology HCV genotype
Cirrhotic liver Grade
Tumor differentiation
Tumor stage (TNM)
Tumor size (cm)
Vascular invasion
HCC01 45 m caucasian HCV na* yes G2 moderate T1NxMx 1.3 no
HCC02 57 m Asian HCV na yes G4 poor T1NxMx 2.7 no
HCC03 57 m caucasian HCV na yes G2 moderate T1NxMx 2 no
HCC04 49 m unknown HCV na yes G4 poor T3NxMx 3 yes
HCC05 65 m unknown HCV 2a yes G3 moderate T2N0Mx 2.4 no
HCC06 50 m caucasian HCV na yes G3 moderate T2N0Mx 2.5 yes
HCC07 56 m caucasian HCV 2b yes G1 well T1N0Mx 1.5 no
HCC08 62 m caucasian HCV na yes G2 moderate T2NxMx 2.1 no
HCC09 51 m caucasian HCV 1a yes G1 well T1NxMx 1.8 no
HCC10 60 m caucasian HCV 3 yes G3 moderate T1NxMx 1.7 yes
HCC11 53 m caucasian HCV na yes G3 moderate T2NxMx 3 no
HCC12 57 m unknown HCV na yes G1 well T1N0Mx 2.3 yes
HCC13 48 m Asian HCV na yes G2 moderate T1NxMx 1 no
HCC14 66 m Native American HCV na yes G1 well T1NxMx 3 no
HCC15 51 m caucasian HCV 1a yes G1 well T1NxMx 1.5 no
*na - not available.
Liuet al. Molecular Cytogenetics2014,7:81 Page 2 of 15
that all the cases had cirrhosis. All 15 cases were negative for hepatitis B co-infection by serology or viral DNA test, and occult hepatitis B was also excluded by PCR. Due to the retrospective nature of the study, only a subset of these specimens has HCV genotype data.
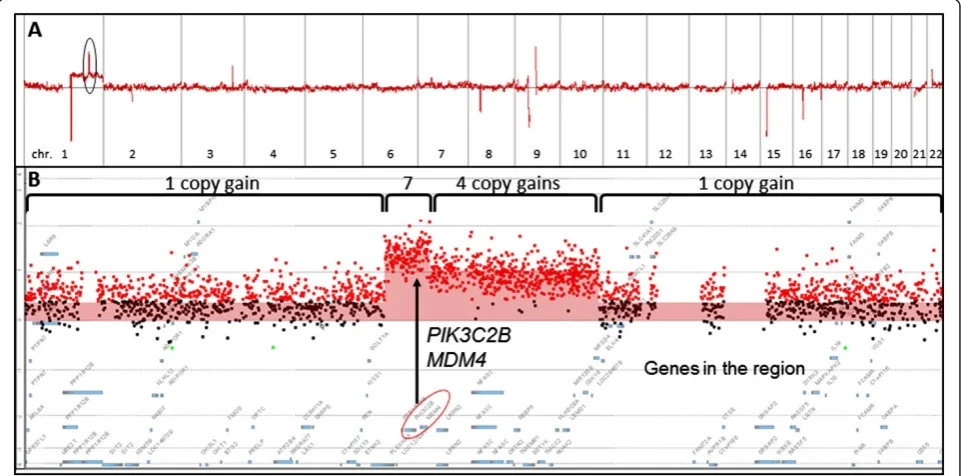
Whole genome microarray analysis using FFPE specimens DNA was extracted from FFPE tissues of 16 HCCs and 10 paired non-neoplastic cirrhotic liver tissues. Except for one HCC specimen, microarray analysis for copy number changes were successful for 15 HCC specimens and 10 paired non-neoplastic cirrhotic liver tissues, giv-ing a 96.2% successful rate for microarray analysis usgiv-ing FFPE specimens. As an example, HCC01 showed a copy gain of the long arm of chromosome 1 (1q) (Table 1, Figure 1A,) and amplified regions containing multiple genes on 1q (Figure 1B). Tumor cellularity, the relative proportion of tumor and normal cells in a sample, af-fects the sensitivity of copy number detection, and can be estimated based on the review of H & E stained slide by the pathologist. In addition, the log2 ratio and copy number line fit plots by Cytogenomics can also be used to indicate clonal diversity and estimate tumor cellularity for each clone. For instance, the tumor cellularity in HCC01 was estimated to be approximately 57% based on the pathologist’s review of the H & E stained slide and the log2 ratio and copy number line fit plot by Cyto-genomics. In addition, no clonal diversity in HCC01 was indicated by the log2 ratio and copy number line fit plot.
Based on the values of log2 ratios and 57% tumor cellu-larity, the numbers of copy gains in the amplified regions on 1q of HCC01 were estimated to be four and seven copies (including gains of MDM4 and PIK3C2B), re-spectively (Figure 1B).
Recurrent copy number alterations in HCC
Clonal chromosomal abnormalities were detected in all HCC samples but not in their paired non-neoplastic tis-sues. Accumulative and individual chromosomal imbal-ances in the HCV-HCC genomes are summarized in Figure 2. Recurrent copy gains and losses of genomic re-gions that were larger than 5 Mb in the HCV-HCC specimens were summarized in Table 2. The common chromosomal aberrations (>5 Mb) observed in HCC were chromosomal gains of 1q (80%), 8q (60%), 7q (40%), 5p (33%), 7p (33%), Xq (33%), 5q (27%), and Xp (20%), as well as chromosome losses of 17p (40%), 4q21.21-q26 (33%), 8p (33%), 1p36.11-pter (20%), and 9p (20%). The numbers of chromosomal imbalance larger than 5 Mb in each case ranged from 2 to 12 copy num-ber changes per case with 7 copy numnum-ber changes per case on average. No chromosomal aberrations were ob-served in the 10 paired non-neoplastic cirrhotic liver tis-sues that were available for examination.
Statistically significant smaller copy number alterations were identified and ranged from 3.9 kb to 644 kb using STAC algorithm implemented in Nexus 7.5 (Table 3). Among the genes in these regions, known cancer genes
Figure 1Whole genomic profile of HCC using formalin-fixed paraffin-embedded (FFPE) specimen. A. Genomic profile of HCV associated HCC (HCC01, Table 1), and the zoomed in area is in the black circle.B. Amplified gene regions on 1q32.1 with one, four or seven copy gains. Gene locations ofPIK3C2BandMDM4are indicated with a circle.X-axis represents genomic intervals of chromosomes 1–22 (1A) or genes in amplified regions (1B). Y-axis represents log2Ratios.
Liuet al. Molecular Cytogenetics2014,7:81 Page 3 of 15
based on the Sanger Census cancer gene list (http:// cancer.sanger.ac.uk/cancergenome/projects/census/) in-cluded losses of FGFR3, RECQL4, NOTCH1, PTEN, TSC2, and/orASPSCR1and gains ofETV1and/orMAF. In addition, copy gain involving Androgen receptor (AR) were observed in five of 15 HCCs analyzed.
Correlation of recurrent genetic alterations with clinical and pathologic data
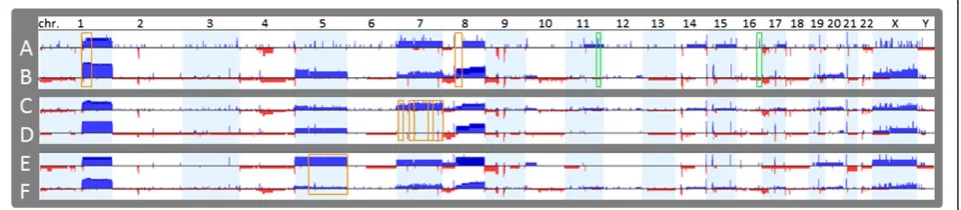
Three comparison/correlation analyses were conducted and the difference in frequency for gains and losses in each group are shown in Figure 3 and significant gen-omic aberrations identified are summarized in Tables 4, 5 and 6. A subset of signature copy number alterations associated with specific HCC pathologic features was identified.
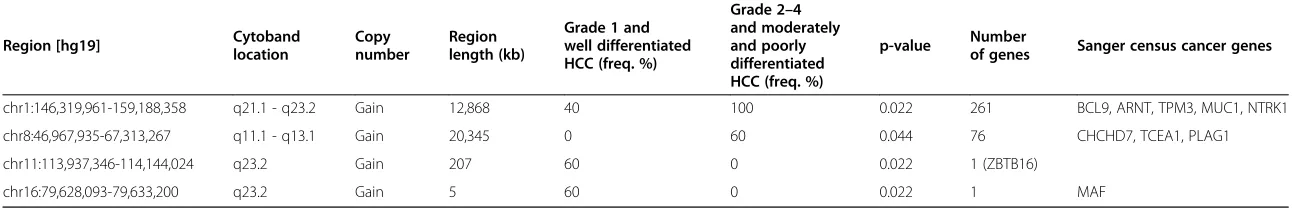
In comparison analysis I, five grade 1 and well differ-entiated HCCs (A, Figure 3) were compared with ten grade 2–4 and moderately or poorly differentiated HCCs (B, Figure 3). Significant copy number aberrations associ-ated with grade 1 and well differentiassoci-ated HCCs are gain of 11q23.2 containingZBTB16and gain of 16q23.2 contain-ing MAF (Table 4). Significant copy number aberrations associated with grade 2–4 and moderately or poorly differ-entiated HCCs are gain of 1q21.1-q23.2 containing 261 genes including 5 cancer genes BCL9, ARNT, TPM3, MUC1, and NTRK1 and gain of 8q11.1q13.1 containing 76 genes including 3 cancer genesTCEA1, PLAG1, and CHCHD7(Table 4). In addition, gains of chromosomes 5 and X and loss of 9p were only found in grade 2–4 and moderately or poorly differentiated HCCs although they did not reach statistical significance (Figure 3A and B).
Gene enrichment analysis on significant common ab-errations identified by the comparison analysis I showed that the genes that are significantly enriched in grade 2–4 and moderately or poorly differentiated HCCs were
involved in positive regulation of NF-kappaB transcrip-tion factor activity, including gains of S100A9, S100A12, S100A8, IL6R, NTRK1, AIM2, andNLRP3on 1q, and in regulation of chemokine production, including gains of DARCon 1q andSNAI2on 8q.
Furthermore, the numbers of chromosomal imbal-ance larger than 5 Mb in each case ranged from 2 to 6 copy number changes per case (on average 3.8 copy number changes per case) for grade 1 and well differen-tiated tumors when compared with 3 to 12 copy num-ber changes per case (on average 7.1 copy numnum-ber changes per case) for grade 2–4 or moderate or poorly dif-ferentiated tumors. The copy number variants (CNV) bur-den in terms of average number of CNVs for each category is significantly different with p-value of 0.023 using student’s t-test.
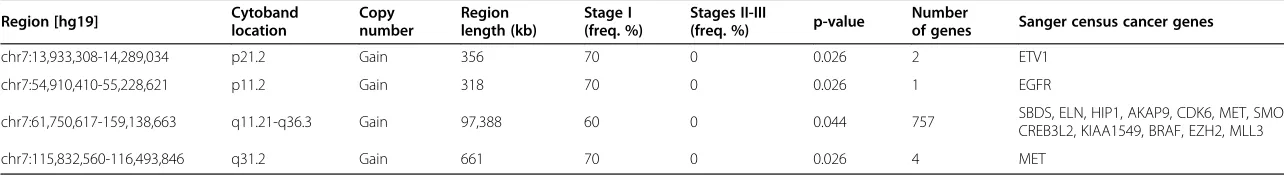
In comparison analysis II, ten stage I HCCs (C, Figure 3) were compared with five stage II or III HCCs (D, Figure 3). Significant copy number aberrations associated with stage I tumors are gain of the long arm of chromosome 7 (7q), gain of 7p11.2 containingEGFR, and gain of 7p21.2 con-tainingETV1 (Table 5). Among the genes in the signifi-cantly enriched in stage I on chromosome 7q are genes involved in negative regulation of hydrogen peroxide-mediated programmed cell death including HGF and MET, and genes in androgen metabolic process including CYP3A4, AKR1D1, andSHH, and mismatch repair com-plex and single strand binding protein genePMS2P5 and PMS2P1,MCM7andSSBP1. In addition, loss of chromo-some 17p containing geneTP53was found in five of ten stage I HCCs, including three HCCs with whole arm dele-tion of 17p and two HCCs with deledele-tions of most part of 17p (17p11.2-p13.2 of 18.5 Mb and 17p11.2-pter of 18.3 Mb respectively). However, this association did not reach statistical significance (Figure 4). TP53 deletion is commonly associated with poor prognosis in neoplasm; Figure 2Genomic profile of HCC specimens showing recurrent chromosomal gains and losses. A. The accumulative frequency (or aggregate) plot for the HCC specimens with rate (%) labeled for the most frequent recurrent clonal chromosomal gains and losses in 15 HCV-associated HCC specimens. Blue bars indicate gains and red bars indicate losses.B. Genomic profiles of copy number alterations in individual HCC specimens.
Liuet al. Molecular Cytogenetics2014,7:81 Page 4 of 15
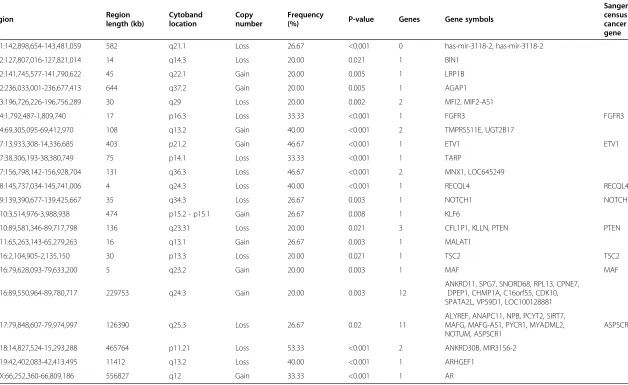
Table 2 Summary of regions of recurrent chromosome imbalance (>5 Mb), frequencies, and Sanger Census cancer genes in the region
Region
Region length (kb)
Cytoband location
Copy number
Frequency (%)
Number of genes
Number of sanger census cancer gene
Sanger census cancer gene
chr1:732,712-24,356,209 23,624 p36.33 - p36.11 Loss 20.00 375 7 TNFRSF14, PRDM16, RPL22, CAMTA1, SDHB, PAX7, MDS2
chr1:143,582,356-249,250,621 105,668 q21.1 - q44 Gain 80.00 1155 17
PDE4DIP, BCL9, ARNT, TPM3, MUC1, PRCC, NTRK1, SDHC, FCGR2B, PBX1, ABL2, TPR, MDM4, ELK4, SLC45A3, H3F3A, FH
chr4:80,505,114-115,297,840 34,793 q21.21 - q26 Loss 33.33 167 2 RAP1GDS1, TET2
chr5:0–46,279,735 46,280 p15.33 - p11 Gain 33.33 181 2 IL7R, LIFR
chr5:49,584,189-180,704,505 131,120 q11.1 - q35.3 Gain 26.67 846 11 IL6ST, PIK3R1, APC, PDGFRB, CD74, ITK, EBF1, RANBP17,
TLX3, NPM1, NSD1
chr7:0–57,675,692 57,676 p22.3 - p11.2 Gain 33.33 381 10 CARD11, PMS2, ETV1, HNRNPA2B1, HOXA9, HOXA11,
HOXA13, JAZF1, IKZF1, EGFR
chr7:61,750,617-159,138,663 97,388 q11.21-q36.3 Gain 40.00 757 12 SBDS, ELN, HIP1, AKAP9, CDK6, MET, SMO, CREB3L2,
KIAA1549, BRAF, EZH2, MLL3
chr8:13,403,518-29,636,237 16,233 p22 - p12 Loss 33.33 116 1 PCM1
chr8:46,967,935-145,730,376 98,762 q11.1 - q24.3 Gain 60.00 501 13 CHCHD7, TCEA1, PLAG1, NCOA2, NBS1, HEY1, CBFA2T1,
UBR5, COX6C, EXT1, MYC, NDRG1, RECQL4
chr9:0–45,983,160 45,983 p24.3 - p11.2 Loss 20.00 278 6 JAK2, CD274, NFIB, MLLT3, FANCG, PAX5
chr17:3,728,554-12,900,807 9,172 p13.2 - p12 Loss 40.00 205 5 USP6, TP53, PER1, GAS7, MAP2K5
chr17:13,297,102-18,590,696 5,293,594 p12 - p11.2 Loss 33.33 77 0
chrX:2,471,123-48,865,144 46,394 p22.33 - p11.23 Gain 20.00 257 7 ZRSR2, BCOR, KDM6A, SSX1, SSX4, WAS, GATA1
chrX:61,828,910-99,931,689 38,103 q11.1 - q22.1 Gain 26.67 156 4 MSN, MED12, NONO, ATRX
chrX:99,931,690-154,975,693 55,044 q22.1 - q28 Gain 33.33 613 5 SEPT6, ELF4, GPC3, PHF6, MTCP1
Liu
et
al.
Molecular
Cytogeneti
cs
2014,
7
:81
Page
5
o
f
1
5
http://ww
w.molecularc
ytogenetic
s.org/conten
Table 3 Summary of statistically significant smaller copy number alterations (p-value < = 0.05) and genes in the region
Region Region
length (kb)
Cytoband location
Copy number
Frequency
(%) P-value Genes Gene symbols
Sanger census cancer gene
chr1:142,898,654-143,481,059 582 q21.1 Loss 26.67 <0.001 0 has-mir-3118-2, has-mir-3118-2
chr2:127,807,016-127,821,014 14 q14.3 Loss 20.00 0.021 1 BIN1
chr2:141,745,577-141,790,622 45 q22.1 Gain 20.00 0.005 1 LRP1B
chr2:236,033,001-236,677,413 644 q37.2 Gain 20.00 0.005 1 AGAP1
chr3:196,726,226-196,756,289 30 q29 Loss 20.00 0.002 2 MFI2, MIF2-AS1
chr4:1,792,487-1,809,740 17 p16.3 Loss 33.33 <0.001 1 FGFR3 FGFR3
chr4:69,305,095-69,412,970 108 q13.2 Gain 40.00 <0.001 2 TMPRSS11E, UGT2B17
chr7:13,933,308-14,336,685 403 p21.2 Gain 46.67 <0.001 1 ETV1 ETV1
chr7:38,306,193-38,380,749 75 p14.1 Loss 33.33 <0.001 1 TARP
chr7:156,798,142-156,928,704 131 q36.3 Loss 46.67 <0.001 2 MNX1, LOC645249
chr8:145,737,034-145,741,006 4 q24.3 Loss 40.00 <0.001 1 RECQL4 RECQL4
chr9:139,390,677-139,425,667 35 q34.3 Loss 26.67 0.003 1 NOTCH1 NOTCH1
chr10:3,514,976-3,988,938 474 p15.2 - p15.1 Gain 26.67 0.008 1 KLF6
chr10:89,581,346-89,717,798 136 q23.31 Loss 20.00 0.021 3 CFL1P1, KLLN, PTEN PTEN
chr11:65,263,143-65,279,263 16 q13.1 Gain 26.67 0.003 1 MALAT1
chr16:2,104,905-2,135,150 30 p13.3 Loss 20.00 0.021 1 TSC2 TSC2
chr16:79,628,093-79,633,200 5 q23.2 Gain 20.00 0.003 1 MAF MAF
chr16:89,550,964-89,780,717 229753 q24.3 Gain 20.00 0.003 12
ANKRD11, SPG7, SNORD68, RPL13, CPNE7, DPEP1, CHMP1A, C16orf55, CDK10, SPATA2L, VPS9D1, LOC100128881
chr17:79,848,607-79,974,997 126390 q25.3 Loss 26.67 0.02 11
ALYREF, ANAPC11, NPB, PCYT2, SIRT7, MAFG, MAFG-AS1, PYCR1, MYADML2, NOTUM, ASPSCR1
ASPSCR1
chr18:14,827,524-15,293,288 465764 p11.21 Loss 53.33 <0.001 2 ANKRD30B, MIR3156-2
chr19:42,402,083-42,413,495 11412 q13.2 Loss 40.00 <0.001 1 ARHGEF1
chrX:66,252,360-66,809,186 556827 q12 Gain 33.33 <0.001 1 AR
Liu
et
al.
Molecular
Cytogeneti
cs
2014,
7
:81
Page
6
o
f
1
5
http://ww
w.molecularc
ytogenetic
s.org/conten
however, the follow-up information is not available for most of the patients in this cohort.
In comparison analysis III, four HCCs with vascular in-vasion (E, Figure 3) were compared with eleven HCCs without vascular invasion (F, Figure 3). Significant copy number aberrations associated with HCCs with vascular invasion are gain of chromosome 5q (Table 6). Among the genes in the significantly enriched in tumors with vascular invasion on 5q are genes involved in BMP signaling path-way including genes FST, ZFYVE16, RGMB, SMAD5, EGR1, and NKX2-5 on chromosome 5q, and genes in-volved in gamma-catenin binding including FER, APC, andCTNNA1on chromosome 5q.
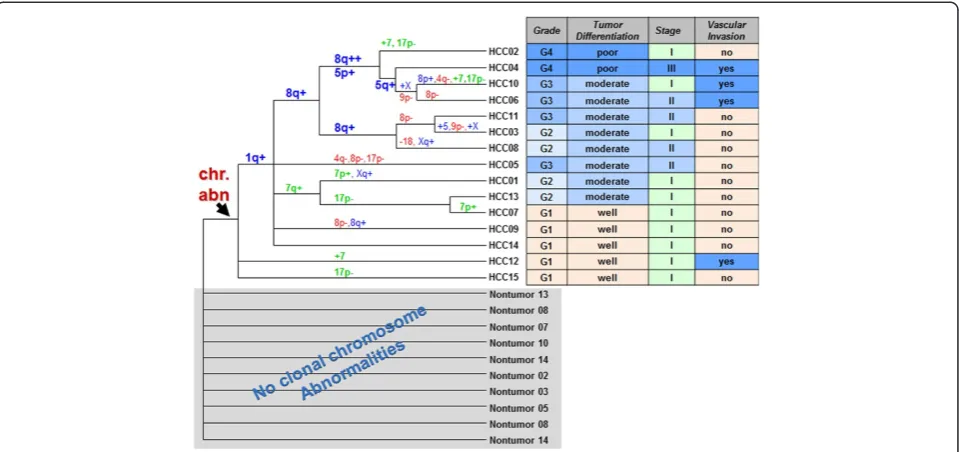
Cluster analysis
The dendrogram was generated based on recurrent chromosome aberrations of HCCs to construct genetic subgroups which reflected their genetic similarities in clusters (groups) (Figure 4). Chromosomal abnormalities partitioned well with HCCs which formed a clad (indi-cated by the arrow in Figure 4) with their paired non-neoplastic specimens at the base of the dendrogram. In the HCC clad, grade 1 and well differentiated HCCs were distributed as basal branches, while most of higher grade and less differentiated HCCs formed more orga-nized clusters. Gain of 1q (80%) was most common and found in all HCCs with grade 2–4 and three of 5 HCCs with grade 1. The cluster of HCCs with gains of 1q, 8q, and trisomy 5 were associated with higher grades (2–4) and moderate to poor tumor differentiation, which were consistent with the results of comparison analysis (Tables 4, 5 and 6).
Discussion
In this study, our data demonstrated the feasibility of whole genome microarray analysis using FFPE samples of hepatocellular carcinoma, as all of specimens used in this study were FFPE samples, including HCCs and paired non-neoplastic cirrhotic liver tissues. Using FFPE speci-mens for molecular and genomic studies are technically
challenging due to the chemical crosslinks and degrad-ation of DNA and RNA in these samples. However, it is important to establish the methods for molecular characterization using genomic approaches with FFPE tissue samples as they make up a vast archive of patho-logically well-characterized clinical samples and are an immense resource that can be used for conducting bio-marker investigation.
Contrary to many previous copy number aberration studies of HCC using conventional CGH with 10– 20 Mb resolution or BAC array with 1–2 Mb resolution for genetic characterization of HCCs with various or un-known etiologies (Table 7) [9-14], this study focuses on HCV associated HCCs using high density whole genome oligo microarray analysis which provides higher reso-lution (>2 kb) to facilitate gene discovery. In addition, the levels of amplifications involving known oncogenic genes are readily detected. The copy number amplifica-tion can also be calculated based on the values of log2
ratio and tumor cellularity, as in specimen HCC01 which had 7-copy amplification ofMDM4andPIK3C2B (Figure 1). MDM4 is known to contain a p53 binding domain at the N-terminus and a RING finger domain at the C-terminus, and has been shown to interact with E2F1 [15], MDM2 [16,17] and P53 tumor suppressor protein [18], and overexpress in a variety of human can-cers.PIK3C2B belongs to the phosphoinositide 3-kinase (PI3K) family which play certain roles in signaling path-ways involved in cell proliferation, oncogenic transform-ation, cell survival, cell migrtransform-ation, and intracellular protein trafficking. Co-amplification of the adjacent genes may provide an additional growth advantage in HCC. In addition, PIK3C2B may serve as a potential therapeutic target. The protein encoded by PIK3C2B was demonstrated to play an essential role in HCV propagation in human HCC cells, and knockdown of PIK3C2Babolished HCV propagation in the cell [19].
Clonal chromosomal abnormalities were detected in all HCC samples but not found in their paired non-neoplastic tissues (Figure 4), demonstrating that Figure 3Frequency difference plot for gains and losses between groups in the comparison analysis.Comparison I: five of grade 1 and well differentiated HCCs (Figure 3A) vs ten of grade 2, 3 or 4 and moderately or poorly differentiated HCCs (Figure 3B). Comparison II: ten of Stage I HCC (Figure 3C) vs five of Stage II or III HCCs (Figure 3D). Comparison III: four of HCCs with vascular invasion (Figure 3E) vs eleven of HCCs without vascular invasion (Figure 3F). Regions of loss are indicated by red bars and regions of gains by blue bars.
Liuet al. Molecular Cytogenetics2014,7:81 Page 7 of 15
Table 4 Result summary of the comparison analysis between grade 1/well differentiated HCCs and grade 2-4/moderately or poorly differentiated HCCs (Figure 3A and B)
Region [hg19] Cytobandlocation Copynumber Regionlength (kb)
Grade 1 and well differentiated HCC (freq. %)
Grade 2–4 and moderately and poorly differentiated HCC (freq. %)
p-value Numberof genes Sanger census cancer genes
chr1:146,319,961-159,188,358 q21.1 - q23.2 Gain 12,868 40 100 0.022 261 BCL9, ARNT, TPM3, MUC1, NTRK1
chr8:46,967,935-67,313,267 q11.1 - q13.1 Gain 20,345 0 60 0.044 76 CHCHD7, TCEA1, PLAG1
chr11:113,937,346-114,144,024 q23.2 Gain 207 60 0 0.022 1 (ZBTB16)
chr16:79,628,093-79,633,200 q23.2 Gain 5 60 0 0.022 1 MAF
Liu
et
al.
Molecular
Cytogeneti
cs
2014,
7
:81
Page
8
o
f
1
5
http://ww
w.molecularc
ytogenetic
s.org/conten
Table 5 Result summary of the comparison analysis between Stage I HCC and Stage II or III HCCs (Figure 3C and D)
Region [hg19] Cytobandlocation Copynumber Regionlength (kb) Stage I(freq. %) Stages II-III(freq. %) p-value Numberof genes Sanger census cancer genes
chr7:13,933,308-14,289,034 p21.2 Gain 356 70 0 0.026 2 ETV1
chr7:54,910,410-55,228,621 p11.2 Gain 318 70 0 0.026 1 EGFR
chr7:61,750,617-159,138,663 q11.21-q36.3 Gain 97,388 60 0 0.044 757 SBDS, ELN, HIP1, AKAP9, CDK6, MET, SMO,
CREB3L2, KIAA1549, BRAF, EZH2, MLL3
chr7:115,832,560-116,493,846 q31.2 Gain 661 70 0 0.026 4 MET
Liu
et
al.
Molecular
Cytogeneti
cs
2014,
7
:81
Page
9
o
f
1
5
http://ww
w.molecularc
ytogenetic
s.org/conten
Table 6 Result summary of the comparison analyses between HCCs with vascular invasion and without vascular invasion (Figure 3E and F)
Region [hg19] Cytoband location Copy number
Region length (kb)
Vascular invasion (freq. %)
No vascular invasion (freq. %)
p-value Number
of genes Sanger census cancer genes
chr5:49,584,189-180,704,505 q11.1 - q35.3 Gain 131,120 75 9.091 0.033 846 IL6ST, PIK3R1, APC, PDGFRB, CD74, ITK,
EBF1, RANBP17, TLX3, NPM1, NSD1
Liu
et
al.
Molecular
Cytogeneti
cs
2014,
7
:81
Page
10
of
15
http://ww
w.molecularc
ytogenetic
s.org/conten
chromosomal copy number aberrations detected by whole genome microarray analysis were tumor-associated som-atic changes and may serve as good genetic markers to distinguish tumors from non-neoplastic cirrhotic nodules.
The frequent chromosomal aberrations (>5 Mb) found in this study, including gains of 1q and 8q and loss of 1p, 4q, 8p, 9p, and 17p, were largely consistent with pre-vious reports for HCCs with various etiologies, including virus-associated and non-viral HCCs (Table 7) [9-14]. Similar pattern of chromosomal imbalances with differ-ent etiology suggests a common basic state for HCC de-velopment, most likely the chronic process of cirrhosis due to non-specific inflammatory and regenerative pro-cesses. However, frequent gains of chromosomes 5 (33%) and/or 7 (33-40%) found in this cohort (Table 2, Figures 2
and 4) have not been reported previously as common chromosomal aberrations in HCC (Table 7), suggesting that trisomy 5 and/or trisomy 7 could be the specific aber-rations for HCV associated HCCs and future studies are warranted.
In addition, smaller deletions (3.9 – 582 kb) were identified to be statistically significant in this HCV-HCC cohort. These deletions contained known cancer genes based on the Sanger Census cancer gene list, in-cluding FGFR3, RECQL4, NOTCH1, PTEN, TSC2, and/ or ASPSCR1 (Table 3) which suggested their roles as tumor suppressor genes in the development of HCC. These genetic alterations were undetected by previous studies with conventional CGH and BAC arrays, most likely due to the low resolution of the analyses.
Figure 4The dendrogram generated from cluster analysis.Genetic subgroups shown as clads/clusters were labeled with shared chromosomal aberrations on the branches leading to the clades or the HCC specimen. Chromosomal abnormalities partitioned with HCCs and formed a clad that was indicated by the arrow. Their paired non-neoplastic specimens were at the base of the dendrogram without clonal chromosomal aberrations detected. Clinical and pathological features associated with each HCC were listed in the table next to it.
Table 7 Comparison of frequencies of major gains and losses of genomic regions from this study and previous reports
Method Etiology Chromosomal gain (frequency, %) Chromosomal loss (frequency, %) References 1q 5p 5q 7p 7q 8q 17q 20q 1p 4q 6q 8p 9p 17p
Conventional CGH HCV, HBV, or non-viral 46 27 <5 <5 <5 69 46 31 35 42 15 58 27 31 [12]
BAC or Oligo CGH HCV, HBV, or non-viral >25 NA* NA NA NA >25 >25 NA NA >25 >25 >25 >25 >25 [11]
Conventional CGH HCV, HBV, or non-viral 49 <5 6 13 15 55 13 12 18 33 33 55 13 22 [13]
Conventional CGH HCV or HBV 46 <5 <5 <5 <5 41 37 <5 24 39 61 44 24 <5 [14]
Conventional CGH HCV only 46 5 5 9 9 31 43 27 37 48 23 28 9 37 [10]
Conventional CGH HCV only 79 16 11 16 11 37 16 11 32 53 21 32 11 79 [9]
oligo CGH HCV only 80 33 27 33 40 60 <5 <5 20 33 7 33 20 40 This study
*NA - note available.
Liuet al. Molecular Cytogenetics2014,7:81 Page 11 of 15
FGFR3appears to have dual actions in cancers.FGFR3 can have both tumor suppressive and oncogenic proper-ties. It was shown that FGFR3 signal can limit tumor growth with epithelial origin. Therefore, for tumors of epithelial origin, loss of FGFR3 was found in higher grade tumor while activating mutations of FGFR3 were found in benign or low grade tumor with good prognosis [20]. Although little is known on FGFR3 actions in HCC, FGFR3 deletion was found mostly in grade 2–3 HCC in this cohort, indicating FGFR3 as a tumor sup-pressor gene in HCC and is associated with HCC of higher grade. FGFR3 oncogenic property is crucial for targeted therapy involving specific tyrosine kinase inhibi-tors. Loss ofNOTCH1resulted in a continuous prolifera-tion of hepatocytes and nodular regenerative hyperplasia in conditional NOTCH1 knockout mouse model [21]. PTEN as a tumor suppressor, negatively regulating AKT/ PKB signaling pathway by preferentially dephosphorylates phosphoinositide substrates, is mutated in a large number of cancers including 40-50% of human liver cancers such as HCC and cholangiocarcinoma [22]. TSC2 is a tumor suppressor and is able to stimulate specific GTPases. Loss of TSC2 leads to activation of MTOR and downstream signaling elements, causes endoplasmic reticulum (ER) stress, activates the unfolded protein response, and results in tumor development [23].TSC2deletions were found in HCV-associated HCC with grade 2–3 and moderate dif-ferentiation and without vascular invasion in this cohort. This finding is consistent with the finding that decreased TSC2expression was found to be significantly correlated with higher grade and poor prognosis, but is inconsistent with the association with vascular invasion in a recent study [24]. The discrepancy may be explained by the population difference as all HCC cases are soly HCV asso-ciated in this study while the majority cases in Huang’s study were HBV associated HCCs with only two HCV-associated HCCs [24].RECQL4, a DNA helicase that be-longs to the RecQ helicase family, has not been previously recognized to be involved in HCC development. This study also showed that deletions involving whole gene ASPSCR1 (alveolar soft part sarcoma chromosome re-gion, candidate 1) were detected in HCC with statistical significance. The deletions of ASPSCR1 most likely re-sulted in the loss of function and decreased expression of ASPSCR1, suggesting its role as a potential tumor suppressor gene in the development of HCC. In addition, loss of function and decreased expression of ASPSCR1 has also been implicated in synthetic lethal interactions in cancer [25]. Gene ASPSCR1is relatively uncharacterized. An ASPSCR1–TFE3 fusion protein due to an unbalanced translocation der(17) t(X;17) has been associated with alveolar soft-part sarcoma (ASPS), which resulted in unregulated transcription of TFE3 and TFE3-regulated genes and a truncated allele of
ASPSCR1 with loss of function [26]. Future studies of the role ofASPSCR1 in HCC are warranted.
There is great interest in identifying genetic markers of HCC that qualify for risk stratification. Most previ-ous studies did not have detailed pathological data and correlation analysis between the genetics data and pathological data have not been conducted. We found several correlations between genetic data and clinico-pathological data by comparison analysis. Gain of 1q21.1-q23.2 and gain of 8q11.1q13.1 were significantly associated with grade 2–4 and moderately or poorly differentiated HCCs (Table 4), including genes that are significantly enriched in positive regulation of nuclear factor-kappa B (NF-kappaB) transcription factor activity and regulation of chemokine production. This result suggests that NF- kappaB plays a role in the progres-sion of HCC. The NF-κB transcription factor family is known to play an important role in many immune and inflammatory responses, and inflammation is consid-ered a hallmark of cancer [27]. Enhanced expression of inflammatory cytokines and chemokines as key coordi-nators of the cross talk between hepatocytes and acti-vated hepatic stellate cells was shown to be crucial in HCC development and progression, either by direct sig-naling or by recruiting immune cells [27,28] .
Comparison analysis also showed that gain of chromo-some 5q was significantly associated with HCCs with vascular invasion (Table 6), which is a poor prognostic indicator for tumor spread. Gene enrichment analysis detected genes in bone morphogenetic proteins (BMP) signaling pathway including genes FST, ZFYVE16, RGMB, SMAD5, EGR1, andNKX2-5on chromosome 5q and in gamma-catenin binding includingFER, APC, and CTNNA1 on chromosome 5q (Table 6), suggesting that copy number gain and increased expression of BMP sig-naling may contribute to tumor progression and inva-sion. BMPs comprising the largest family within the TGF-βsuperfamily, originally reported as factors that in-duce bone and cartilage formation and development, have been shown to be critical for cancer development and progression [29]. Elevated expression levels of BMPs have been detected in many types of solid tumors, and BMP signaling pathway are intimately involved in both the inhibition and promotion of cancer progression [30]. A similar dual role for the superfamily member TGFβis known to act as a tumor suppressor during the initial steps of tumorigenesis, but later found to promote tumor progression and invasion [31].
Furthermore, copy number variant (CNV) burden in terms of number of observed acquired CNV events (>5 Mb) in each case was greater in HCCs with grade 2–4 or moderate or poorly differentiated tumors (aver-age 7.1 CNVs per case) compared to HCCs with grade 1 and well differentiated tumors (average 3.8 CNVs per
Liuet al. Molecular Cytogenetics2014,7:81 Page 12 of 15
case), indicating higher genomic instability in more ad-vanced HCCs.
HCC has gender disparity with an increased frequency in males. Copy gain involving androgen receptor (AR) were observed in five HCCs of male patients in this co-hort, including gain of Xq in four HCCs, and a gain con-taining only gene AR in one HCC. In addition, a gain containing the promoter region and first two exons of ARwas observed in one HCC. It has been proposed that higher activity of androgen pathway functions as a tumor-promoting factor in male hepatocarcinogenesis, as knockout ofARexpression in hepatocytes delayed the development of N’,N’-diethylnitrosamine (DEN)-induced HCC [32].
Conclusions
This study has provided a detailed map of genomic aber-rations occurring in HCV-associated HCC and has sug-gested candidate genes. As many frequent gains and losses are also common in HCCs with various etiologies, gains of chromosomes 5 and/or 7 appeared to be the specific aberrations for HCV-associated HCCs. While gain of 1q21.1-q23.2 and gain of 8q11.1q13.1 are signifi-cantly associated with grade 2–4 and moderately or poorly differentiated HCCs, gain of chromosome 7q is significantly associated with stage I HCCs, and gain of chromosome 5q was significantly associated with HCCs with vascular invasion which is poor prognosis indicator for tumor spreading. NF- kappaB and BMP signaling pathways were indicated for HCC development and pro-gression. This study demonstrated that genomic micro-array test can be used to distinguish HCC from non-neoplastic cirrhotic nodules and to identify signaling pathways involved in HCC development and prognostic factors associated with HCC progression using patho-logically characterized FFPE samples. Our data support the utility of genomic microarray test for the diagnosis, risk stratification, and pathogenic studies of HCC.
Methods
FFPE tissue specimens
The pathological archives of representative number of hepatocellular carcinoma (HCC) were retrospectively reviewed and selected from the Department of Pathology at the University of Washington Medical center, includ-ing 15 HCV-associated HCC in cirrhotic livers, all from explanted liver specimens. The study protocol was reviewed and approved by the institutional review boards (University of Washington, Human Subjects Division). All specimens used in this study were formalin-fixed paraffin-embedded (FFPE) tissue specimens. Hematoxylin and eosin stained slides were reviewed to confirm the diag-nosis and to grade and subclassify the HCC accordingly [33]. In addition, both cancer tissues and nearby
cirrhotic non-neoplastic tissues were processed for the genetic characterization for 10 of 15 HCV-associated HCC cases, while in five of 15 cases, only HCC tissues were available for analysis.
We reviewed the clinical records of these patients and retrieved the data on demographic characteristics and clinical outcomes (Table 1). The tumor-node-metastasis (TNM) staging system of American Joint Committee on Cancer (Edition 7) was used to determine the T stage of the tumors [34].
DNA extraction
Tumor and non-neoplastic areas were identified in H & E-stained slides and corresponding areas were dissected with a scalpel from the paraffin slides. Genomic DNA from FFPE tissue was extracted using manufacture rec-ommended procedure (Agilent Technologies, Santa Clara, CA, USA) which is based on the method de-scribed by van Beers et al. [35] using the Qiagen DNeasy Blood & Tissue Kit (Qiagen Inc, Valencia, CA, USA). This procedure is optimized for 5 sections of 4–5 micron FFPE section containing about 1 cm2 of tissue. The concentration and the quality of genomic DNA were determined using Spectrophotometer NanoDrop ND-1000 (Thermo Fisher Scientific Inc., Wilmington, DE, USA).
Genomic microarray analysis
Purified genomic DNA and the normal control refer-ence DNA were then digested with restriction enzymes, labeled separately with contrasting fluorescence, and competitively hybridized to the custom designed high density oligonucleotide microarray as specified by the manufacturer (Agilent Technologies, Santa Clara, CA, USA). Chromosomal microarray analysis was per-formed on genomic DNA using the Agilent SurePrint G3 Cancer CGH + SNP 4x180K Array, a cancer-specific CGH + SNP microarray designed by Cancer Genomics Consortium (CGC) (http://www.chem-agilent.com/pdf/ 5990-9183en_lo_CGH+SNP_Cancer.pdf ). Arrays were scanned using a DNA Microarray Scanner with SureS-can High-Resolution technology (Agilent Technologies, Santa Clara, CA, USA). Whole genome microarray data were analyzed using Agilent CytoGenomics 2.5 to iden-tify copy number changes. The global ADM2 algorithm with a threshold 6.0 and aberration filter for a mini-mum of five probes per region were applied. The CGH array data were also evaluated independently with sec-ond software Nexus Copy Number 7.5 (BioDiscovery, Inc. Hawthorne, CA, USA) to confirm the copy number changes identified by Cytogenomics. The log2R ratios provide information regarding copy number. These were determined by visual inspection. Genomic linear positions were given relative to NCBI build 37 (hg19,
Liuet al. Molecular Cytogenetics2014,7:81 Page 13 of 15
http://genome.ucsc.edu/). Analysis was limited to de-tect copy number changes that include at least 5 probes (markers) for deletions or duplications.
Statistical analysis
To identify nonrandom gains and losses across multiple samples that are more likely to drive cancer pathogen-esis, genetic aberrations in this cohort were evaluated for their statistically significance using statistical ap-proaches with STAC algorithm adopted in Nexus 7.5 (BioDiscovery, Inc. Hawthorne, CA, USA). Significance Testing for Aberrant Copy number (STAC) is a method for testing the significance of DNA copy number aberra-tions across multiple microarray experiments to identify a set of aberrations that are aggregate in the overlapping regions such that it would not occur randomly [36]. The method applies two statistics, the frequency of aberra-tion at a locaaberra-tion across the entire sample set and p-value assigned to each location on the genome by using a multiple testing corrected permutation approach. The p-Value cut-off of 0.05 and the Aggregate % cut-off of 20% were used in the analyses.
Comparison analysis was conducted to correlate re-current genetic alterations observed with clinical and pathologic data using Nexus 7.5 (BioDiscovery, Inc. Hawthorne, CA, USA). Statistical comparison using Fisher Exact test was performed to determine the p-value of certain genetic aberration in one group vs the other group in comparison. Scores exceeding the significant threshold with p-Value cut-off of 0.05 and below the differential threshold cut-off of 25% were used in the analyses. Comparisons between different groups of tumors based on the pathologic features were conducted to detect genomic regions that were signifi-cant different between the groups in a comparison based on the p-value. The factor sets compared in this study included tumor grade and differentiation, tumor stage, and vascular invasion.
Using significant common aberrations identified by comparison analysis, gene enrichment analysis on these selected regions of interest was conducted to attain the biological implications of these aberrations using Nexus 7.5 (BioDiscovery, Inc. Hawthorne, CA, USA). Enrich-ment analysis identifies gene ontology (GO) terms that are significantly overrepresented and identifies the genes annotated with these terms within this aberrant region [37,38].
Clustering analysis
The genetic similarity between the tumor samples were evaluated using parsimony analyses by clustering similar recurrent aberration of genetic data using PAUP, version 3.1.1 [39,40] to generate a dendrogram that illustrated the arrangement of the clusters. The identified clusters
with recurrent genetic aberrations were correlated with clinical and pathological features.
Competing interests
The authors declare that they have no competing interests.
Authors’contributions
YJL contributed to the conception and design of the study, performed microarray data analysis and interpretation, performed the statistical analysis, wrote and revised the manuscript. YZ carried out genomic microarray analysis. MMY obtained the specimens and provided the pathology diagnosis, and participated in the study design and involved in revising the manuscript. All authors read and approved the final manuscript.
Authors’information
Yajuan J. Liu PhD FACMG
Board certified in Clinical Cytogenetics and Clinical Molecular Genetics. Co-Director of Cytogenetics and Genomics Laboratory
University of Washington Medical Center Assistant Professor
Department of Pathology, University of Washington School of Medicine, Seattle, WA, USA
Yang Zhou MS Technologist
Cytogenetics and Genomics Laboratory. University of Washington Medical Center. Matthew M. Yeh, MD, PhD
Board certified in Anatomic and Clinical Pathology
Director, Gastrointestinal and Hepatic Pathology Fellowship Program. Professor
Department of Pathology, University of Washington School of Medicine, Seattle, WA, USA.
Received: 16 July 2014 Accepted: 26 October 2014
References
1. Munoz N, Bosch X:Epidemiology of Hepatocellular Carcinoma.In Neoplasms of the Liver.Edited by Okuda K, Ishak KG. Tokyo: Springer; 1989:3. 2. Bosch F, Munoz N:Hepatocellular Carcinoma in the World: Epidemiologic Questions.InEtiology, Pathology and Treatment of Hepatocellular Carcinoma in America, Advances in Applied Technology Series. Edited by Tabor E, DiBisceglie AM, Purcell RH. Gulf, Houston; 1991:35.
3. Hashem BE-S:Hepatocellular carcinoma: recent trends in the United States.Gastroenterology2004,127:S27–S34.
4. Fattovich G, Stroffolini T, Zagni I, Donato F:Hepatocellular carcinoma in cirrhosis: incidence and risk factors.Gastroenterology2004,127:S35–S50. 5. Bralet MP, Regimbeau JM, Pineau P, Dubois S, Loas G, Degos F, Bralet MP,
Regimbeau JM, Pineau P, Dubois S, Loas G, Degos F:Hepatocellular carcinoma occurring in nonfibrotic liver: epidemiologic and
histopathologic analysis of 80 French cases.Hepatology2000,32:200–204. 6. Niederau C, Lange S, Heintges T:Prognosis of chronic hepatitis C: results
of a large, prospective cohort study.Hepatology1998,28:1687–1695. 7. Bruix J, Sherman M:Management of hepatocellular carcinoma.
Hepatology2005,42:1208–1236.
8. Villanueva A, Newell P, Chiang DY, Friedman SL, Llovet JM:Genomics and signaling pathways in hepatocellular carcinoma.Semin Liver Dis2007, 27:055,076.
9. Hashimoto K, Mori N, Tamesa T, Okada T, Kawauchi S, Oga A, Furuya T, Tangoku A, Oka M, Sasaki K:Analysis of DNA copy number aberrations in hepatitis C virus-associated hepatocellular carcinomas by conventional CGH and array CGH.Mod Pathol2004,17:617–622.
10. Sakakura C, Hagiwara A, Taniguchi H, Yamaguchi T, Yamagishi H, Takahashi T, Koyama K, Nakamura Y, Abe T, Inazawa J:Chromosomal aberrations in human hepatocellular carcinomas associated with hepatitis C virus infection detected by comparative genomic hybridization.Br J Cancer 1999,80:2034–2039.
11. Guo X, Yanna, Ma X, An J, Shang Y, Huang Q, Yang H, Chen Z, Xing J:A meta-analysis of array-CGH studies implicates antiviral immunity pathways in the development of hepatocellular carcinoma.PLoS One 2011,6:e28404.
Liuet al. Molecular Cytogenetics2014,7:81 Page 14 of 15
12. Zondervan PE, Wink J, Alers JC JNIJ, Schalm SW, de Man RA, van Dekken H: Molecular cytogenetic evaluation of virus-associated and non-viral hepatocellular carcinoma: analysis of 26 carcinomas and 12 concurrent dysplasias.J Pathol2000,192:207–215.
13. Homayounfar K, Schwarz A, Enders C, Cameron S, Baumhoer D, Ramadori G, Lorf T, Gunawan B, Sander B:Etiologic influence on chromosomal aberrations in European hepatocellular carcinoma identified by CGH. Pathol Res Pract2013,209:380–387.
14. Tornillo L, Carafa V, Richter J, Sauter G, Moch H, Minola E, Gambacorta M, Bianchi L, Vecchione R, Terracciano LM:Marked genetic similarities between hepatitis B virus-positive and hepatitis C virus-positive hepatocellular carcinomas.J Pathol2000,192:307–312.
15. Strachan GD, Jordan-Sciutto KL, Rallapalli R, Tuan RS, Hall DJ:The E2F-1 transcription factor is negatively regulated by its interaction with the MDMX protein.J Cell Biochem2003,88:557–568.
16. Kadakia M, Brown TL, McGorry MM, Berberich SJ:MdmX inhibits Smad transactivation.Oncogene2002,21:8776–8785.
17. Tanimura S, Ohtsuka S, Mitsui K, Shirouzu K, Yoshimura A, Ohtsubo M: MDM2 interacts with MDMX through their RING finger domains. FEBS Lett1999,447:5–9.
18. Badciong JC, Haas AL:MdmX is a RING finger ubiquitin ligase capable of synergistically enhancing Mdm2 ubiquitination.J Biol Chem2002, 277:49668–49675.
19. Maehama T, Fukasawa M, Date T, Wakita T, Hanada K:A class II phosphoinositide 3-kinase plays an indispensable role in hepatitis C virus replication.Biochem Biophys Res Commun2013,440:150–156. 20. Lafitte M, Moranvillier I, Garcia S, Peuchant E, Iovanna J, Rousseau B, Dubus
P, Guyonnet-Duperat V, Belleannee G, Ramos J, Bedel A, de Verneuil H, Moreau-Gaudry F, Dabernat S:FGFR3 has tumor suppressor properties in cells with epithelial phenotype.Mol Cancer2013,12:83.
21. Croquelois A, Blindenbacher A, Terracciano L, Wang X, Langer I, Radtke F, Heim MH:Inducible inactivation of Notch1 causes nodular regenerative hyperplasia in mice.Hepatology2005,41:487–496.
22. Chen WT, Zhu G, Pfaffenbach K, Kanel G, Stiles B, Lee AS:GRP78 as a regulator of liver steatosis and cancer progression mediated by loss of the tumor suppressor PTEN.Oncogene2013, doi:10.1038/onc.2013.1437. 23. Ozcan U, Ozcan L, Yilmaz E, Duvel K, Sahin M, Manning BD, Hotamisligil GS:
Loss of the tuberous sclerosis complex tumor suppressors triggers the unfolded protein response to regulate insulin signaling and apoptosis. Mol Cell2008,29:541–551.
24. Huang KT, Huang YH, Li P, He B, Chen ZK, Yu X, Chen JO, Zhang QY, Shi HQ, Shan YF:The correlation between TSC2 and GSK3beta levels, and outcomes of patients with hepatocellular carcinoma treated by hepatectomy.Hepatol Res2013. doi:10.1111/hepr.12256.
25. Deshpande R, Asiedu MK, Klebig M, Sutor S, Kuzmin E, Nelson J, Piotrowski J, Shin SH, Yoshida M, Costanzo M, Boone C, Wigle DA, Myers CL:A comparative genomic approach for identifying synthetic lethal interactions in human cancer.Cancer Res2013,73:6128–6136. 26. Folpe AL, Deyrup AT:Alveolar soft-part sarcoma: a review and update.
J Clin Pathol2006,59:1127–1132.
27. Hanahan D, Weinberg RA:Hallmarks of cancer: the next generation. Cell2011,144:646–674.
28. Coulouarn C, Corlu A, Glaise D, Guenon I, Thorgeirsson SS, Clement B: Hepatocyte-stellate cell cross-talk in the liver engenders a permissive inflammatory microenvironment that drives progression in hepatocellular carcinoma.Cancer Res2012,72:2533–2542.
29. Lee JH, Lee GT, Woo SH, Ha YS, Kwon SJ, Kim WJ, Kim IY:BMP-6 in renal cell carcinoma promotes tumor proliferation through IL-10-dependent M2 polarization of tumor-associated macrophages.Cancer Res2013, 73:3604–3614.
30. Kallioniemi A:Bone morphogenetic protein 4-a fascinating regulator of cancer cell behavior.Cancer Genet2012,205:267–277.
31. Derynck R, Akhurst RJ, Balmain A:TGF-beta signaling in tumor suppression and cancer progression.Nat Genet2001,29:117–129. 32. Yeh SH, Chen PJ:Gender disparity of hepatocellular carcinoma: the roles
of sex hormones.Oncology2010,78(Suppl 1):172–179.
33. Kojiro M:Chapter 4, Morphologic evolution of hepatocellular carcinoma: from early to advanced.InPathology of Hepatocellular Carcinoma Kojiro. Edited by Wiley-Blackwell; 2006:51–62.
34. Edge SBBD, Compton CC, Fritz AG, Greene FL, Trotti A (Eds):AJCC Cancer Staging Manual.7th edition. New York, NY: Springer; 2010:237–246.
35. van Beers EH, Joosse SA, Ligtenberg MJ, Fles R, Hogervorst FB, Verhoef S, Nederlof PM:A multiplex PCR predictor for aCGH success of FFPE samples.Br J Cancer2006,94:333–337.
36. Diskin SJ, Eck T, Greshock J, Mosse YP, Naylor T, Stoeckert CJ Jr, Weber BL, Maris JM, Grant GR:STAC: A method for testing the significance of DNA copy number aberrations across multiple array-CGH experiments. Genome Res2006,16:1149–1158.
37. Subramanian A, Tamayo P, Mootha VK, Mukherjee S, Ebert BL, Gillette MA, Paulovich A, Pomeroy SL, Golub TR, Lander ES, Mesirov JP:Gene set enrichment analysis: a knowledge-based approach for interpreting genome-wide expression profiles.Proc Natl Acad Sci U S A2005, 102:15545–15550.
38. Mootha VK, Lindgren CM, Eriksson KF, Subramanian A, Sihag S, Lehar J, Puigserver P, Carlsson E, Ridderstrale M, Laurila E, Houstis N, Daly MJ, Patterson N, Mesirov JP, Golub TR, Tamayo P, Spiegelman B, Lander ES, Hirschhorn JN, Altshuler D, Groop LC:PGC-1alpha-responsive genes involved in oxidative phosphorylation are coordinately downregulated in human diabetes.Nat Genet2003,34:267–273.
39. Swofford D:PAUP: Phylogenetic Analysis Using Parsimony. Version 3.1.1. Washington, DC: National Museum of Natural History; 1993.
40. Liu YJ, Hall BD:Body plan evolution of ascomycetes, as inferred from an RNA polymerase II phylogeny.Proc Natl Acad Sci U S A2004,
101:4507–4512.
doi:10.1186/s13039-014-0081-8
Cite this article as:Liuet al.:Recurrent genetic alterations in hepatitis C-associated hepatocellular carcinoma detected by genomic micro-array: a genetic, clinical and pathological correlation study.Molecular Cytogenetics20147:81.
Submit your next manuscript to BioMed Central and take full advantage of:
• Convenient online submission
• Thorough peer review
• No space constraints or color figure charges
• Immediate publication on acceptance
• Inclusion in PubMed, CAS, Scopus and Google Scholar
• Research which is freely available for redistribution
Submit your manuscript at www.biomedcentral.com/submit
Liuet al. Molecular Cytogenetics2014,7:81 Page 15 of 15