Correlation Analysis of Tool Wear and Cutting Sound Signal
Tong Li
1, Minliang Zhang
2, Yanfei Fan
3, Ximin Cheng
4, Siyu Lin
5(Department of Mechanical Engineering, Shanghai University of Engineering Science, Shanghai China,201620) (Department of Mechanical Engineering, Shanghai University of Engineering Science, Shanghai China,201620) (Department of Mechanical Engineering, Shanghai University of Engineering Science, Shanghai China,201620) (Department of Mechanical Engineering, Shanghai University of Engineering Science, Shanghai China,201620) (Department of Mechanical Engineering, Shanghai University of Engineering Science, Shanghai China,201620)
Abstract:
With the classic signal analysis and processing method, the cutting of the audio signal in time domain and frequency domain analysis. We reached the following conclusions: in the time domain analysis, cutting audio signals mean and the variance associated with tool wear state change occurred did not change significantly, and tool wear is not high degree of correlation, and the mean-square value of the audio signal changes in the size and tool wear the state has a good relationship.Key words:
Signal analysis; Frequency domain analysis; Time domain analysis; Tool wear; the audio signal.I.
Introduction
A large amount of signal information collected by the sensor can only be used to characterize the cutting
state to a certain extent, but it can not be directly used to establish the mathematical model between the tool
wear and the tool wear state. Only through the appropriate means of signal processing, a small amount of tool
wear and the state of the large correlation between the characteristics of the information analysis and extraction,
in order to ensure the reliability of the tool state identification. In the dynamic system of metal cutting, the signal
of the sensor is the performance of the whole system. In this system, the workpiece, the cutter, the cutting
parameter and the change of the tool wear degree and so on, all can make the characteristic of the signal of the
sensor to have the corresponding change[1].
Therefore, the tool wear process is essentially a non-stationary random process, then the output signal of the
sensor also showed the characteristics of non-stationary random process. In practical applications, due to the test
to get the analysis of finite length signal samples, so it can be similar to that of the output signal belongs to the
stationary random process, and obey normal distribution, can be through time domain analysis, frequency
domain analysis and time domain analysis method for monitoring signal analysis.
II.
The introduce of Signal Analysis
(1) time-domain analysis and time domain featuresIt refers to the time domain signal to the time axis of the signal amplitude of the waveform
representation[2].Let the test sample collected data
x
i(
t
)
,i
1
,
2
,...,
N
, then the sample data can be time-domain characteristics analysis by the following method.
TT
T
t
dt
t
x
E
0)
(
x
1
lim
)]
(
[
(3-1)Mean represents the mean value within a range of random data, the signal changes in the expression of
central tendency. Different sensor signals with the tool wear degree of change corresponding changes occur in
varying degrees, and therefore mean that some signals may be used to monitor tool wear, such as mean cutting
force signal[3].
2) variance σx2, the expression is:
dt
t
x
T
x
E
T xT x 2 0 2
]
)
(
[
1
lim
]
)
[(
(3-2)Variance also called standard deviation, the size of the performance of its volatility random signals. As for
the cutting force signal, the use of the mean to represent static cutting force, but with variance represents the
dynamic cutting force.
3) energy XRMS, the expression is:
N i i RMSx
X
1 2 (3-3)Energy is used to represent the signal energy varied within certain period of time. 4) The mean square value φx2, the expression is[4]
:
TT
T
t
dt
0 2 2
)
(
x
1
lim
x
φ
(3-4)Mean square value represents the average power of random signals. The total energy sensor signal
acquisition will with increasing degree of tool wear increases. Therefore, all changes square value can
characterize the state of the tool[5].
From monitoring features described above to obtain the time-domain signal it can often be used as a
monitoring tool wear characteristics of the state vector. For the selection of monitoring features typically require
different signal characteristics through careful analysis, to determine the relationship of mutual correspondence
between states and tool wear.
(2) frequency domain analysis and frequency domain characteristics
Frequency domain analysis is the representation of signal in the frequency domain by means of
mathematical transformation. Spectrum analysis is the most common method of signal analysis. According to
the nature of the signal and the difference of the transformation method, the specific method includes the
spectrum and phase spectrum analysis, power spectrum analysis, etc.. In the practical application, the
characteristics of the tool wear state can be extracted by the spectral structure of the signal[6].
1) spectrum and phase spectrum
If the time domain signal satisfies the following conditions:
x(t)dt)]
(
[
Im
)]
(
[
Re
)
(
X
X
X
(3-6) The imaginary part of X (s) is expressed as:)]
(
Re[
)]
(
Im[
arctan
)
(
X
X
(3-7)The amplitude and phase of the signal are respectively corresponding to amplitude spectrum and phase
spectrum[7].
2) power spectrum
Power spectrum analysis is used to describe the frequency structure of the signal. The power spectrum is
divided into two different forms: the self power spectrum density and the cross power spectrum density.
The energy distribution of the signal is determined by the power spectral density function:
F
R
e
dt
S
x(
)
(
)
2 x(
)
jt (3-8)The different signals of the same frequency are distinguished by the mutual power spectrum density
function:
R
e
dt
S
xy(
)
xy(
)
jt (3-9)III.
Time domain characteristics analysis
According to the Nyquist sampling theorem, only the sampling frequency is greater than twice the highest
frequency of the signal, in order to ensure after the conversion of analog and digital signal process, digital signal
sampling completely retained the information in the original signal. Cutting the audio signal in audible range of
frequency is 20-20kHz. In this paper, the audio signal sampling parameters are set as follows: sampling
frequency 48kHz, quantization precision 16bit. 200mm of the single cutting length of the audio data to record,
taking into account the amount of computation, select one second of the cutting audio signal as the original data
to be processed.
Signal acquisition process in fact is the microphones to collect continuous state of random cutting audio
signal sampling transformation for discrete digital voltage signal in time and amplitude. The main work of this
paper is to analyze the difference between the signals, and the time domain waveform of the characteristic wear
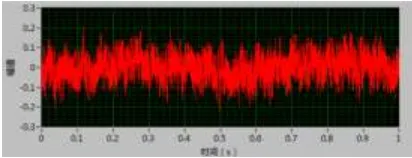
is analyzed and compared. Fixed cutting parameters for 1211r, by cutting depth is 0.3mm, the feed rate is
0.1mm/r. Cutting experiment with single factor variables with tool wear. Tool wear for the 0mm, 0.2mm,
0.5mm cutting audio signal in a second time domain waveform, as shown in figure 3-9.
(b) the time domain waveform of the audio signal when the tool wear is 0.2mm
(c) tool wear for 0.5mm audio signal time domain waveform
Fig.3-9 time domain waveform of audio signal under different wear of 3-9 tool
From 3-9 can be seen from the figure, cutting the audio signal in the time domain waveform, with the
increase of wear, cutting the amplitude of the audio signal has increased a certain increase. Tool wear 0.2mm
waveform, as shown in Figure 3-9 (b), audio signal amplitude and wear volume of MM little change, indicating
that the cutter is wear the steady state, the cutting process of the audio signal to remain stable. Tool wear to
achieve 0.5mm waveform, as shown in Figure 3-9 (c), the amplitude of the audio signal changes, the signal
component is more complex, cutting tool into the severe wear phase. As can be seen, there is a certain
relationship with the audio signal and the cutting tool wear state .
Random selection of orthogonal experimental design table in the combination of arbitrary cutting
parameters test, can be obtained by time-domain signal analysis method similar to figure 3-9 audio signal
time-domain waveform. Considering the features all of the statistics of repeatability and complexity throughout
the experiment in the time domain analysis, in order to facilitate the analysis and selects only with all cutting
parameters under different degree of wear of the six groups of audio signal in the stable cutting the second time
domain waveform statistics. Through the LabVIEW analysis of the signal, the 6 signal of the time domain
characteristic value.
IV.
Conclusion
After a large number of experimental data comparison and analysis, cutting audio signal of the mean and
variance of the change regularity is not strong, and the tool wear state dependence is not great and mean square
value changes in the size of the tool wear rate showed a positive correlation between can be as time-domain
characteristics of monitoring characteristic value. Time domain mean square value and tool wear amount of the
Figure 3-10 and figure 3-11 analysis shows that, under the conditions of the selected six kinds of tool
condition test, cutting audio signals mean square value and tool wear are accompanied by relationship, you can
select cutting audio signal in time domain, mean square value as the tool wear condition monitoring of a
parameter.
V.
Acknowledgements
The authors would like to thank the financial support from Scientific Research Innovation Fund of Shanghai University of Engineering Science and the school’s lab conditions to this research.
Reference
[1] M.Lanzetta. A new flexible high-resolution vision sensor for tool condition monitoring[J]. Journal of Materials Processing Technology, 2001, 119:73-82.
[2] NiranjanPrasad.K, Ramamurthy.B. Tool wear evaluation by stereo vision and Prediction by artificial neural network[J]. Journal of Materials Processing Technology, 2001, 112(l):43-52.
[3] Dimla D E. The correlation of vibration signal features to cutting tool wear in a metal turning operation[J]. International Journal of Advanced Manufacturing Technology, 2002, 19: 705-713. [4] Julie Z. Zhang, Joseph C. Chen. Tool condition monitoring in an end-milling operation based on the
vibration signal collected through a micro-controller-based data acquisition system[J]. The International Journal of Advanced Manufacturing Technology, 2008, 39(1-2): 118-128.
[5] RenedeJesus, Romero-Troneoso Gilberto, Herrera-Ruiz. Driver current analysis for senseless tool breakage monitoring of CNC milling machines[J], International Journal of Machine Tools and Manufacture,2003,43(15): 1529-1534.
[6] Chen XQ, Li HZ. Development of a tool wear observer model for online tool condition monitoring and control in machining nickel-based alloys[J]. International Journal of Advanced Manufacturing Technology, 2009, 45: 786-800.