www.pharmascholars.com
108
Research Article
CODEN: IJPNL6
DEVELOPMENT AND CHARACTERIZATION OF CONTROLLED RELEASE
SPHERICAL AGGLOMERATES BY USING THE QUASI-EMULSION SOLVENT
DIFFUSION METHOD
Anuradha A. Ranpise*
1, Pratiksha M. Kadam
1, Shilpa P. Chaudhari
1, Atul A. Phatak
21
Marathwada Mitra Mandal’s College of Pharmacy, Thergaon (Kalewadi), Pune-33
2Modern College of Pharmacy, Nigdi, Pune-411044
*Corresponding author e-mail:
[email protected]
ABSTRACT
Aspirin is moisture sensitive drug and having poor flowability and compressibility, it is necessary to increase the flowability and compressibility of Aspirin. Spherical crystallization of aspirin was done by quasi-emulsion solvent diffusion method (QESD). 32 factorial design were used to study the effect of agitation speed and amount of polymer in development of spherical agglomerates. Agglomerates were evaluated for micromeritics properties, drug release, scanning electron microscopy, differential scanning calorimetry, Karl Fischer titration, infrared spectroscopy, X-ray diffraction. Flowability and compressibility properties of agglomerates were good enough to
adopt direct compression technology. In vitro drug release of optimized formulation shows 98% .X-ray diffraction
and thermal analysis reveal the conversion of crystalline drug to amorphous. FTIR of agglomerates does not shown any extra peaks as compared to pure drug. Controlled release aspirin agglomerates were prepared successfully by
QESD method. The method was simple, inexpensive and reproducible.
Keywords: Aspirin, Spherical crystallization, Factorial design, Quasi-emulsion, Moisture sensitivity.
INTRODUCTION
Aspirin has a direct irritant effect on gastric mucosa due to inhibition of prostaglandins and prostacyclin and thus causes ulceration, epigastric distress and haemorrhage. So as to reduce the side-effects the controlled release formulation of aspirin has to be prepared. [1, 2]Chemically, aspirin is degraded by water to salicylic acid and acetic acid. Drugs in the solid state can have significant influences on a variety of physical and chemical properties [3] and it is essential to characterize the effect of moisture on these individual components. [4]Direct compression is
the most efficient process used in tablet
manufacturing but it requires different properties of
powder such as good flowability, good
compressibility, and bulk density. Many of the crystals do not exhibit these properties; hence it is necessary to improve these properties. As, Aspirin is having poor flowability and compressibility, it is
necessary to increase the flowability and
compressibility of Aspirin also it is moisture sensitive drug, hence there is need to avoid these major problems [5, 6]
All the problems associated with Aspirin could be overcome by the technique known as spherical crystallization, is a novel particle engineering technique by which crystallization and agglomeration can be carried out simultaneously in one step to transform drug crystals directly into a compacted spherical form and direct compression is possible. Spherical crystallization has been developed by Yoshiaki Kawashima and co-workers as a novel particulate design technique to improve processibility such as mixing, filling, tableting characteristics and dissolution rate of pharmaceuticals.[7] This can be achieved by quasi-emulsion solvent diffusion method of spherical crystallization technique it is a simple process that is also inexpensive enough for scaling up
International Journal of Pharmacy
Anuradha, et al. Int J Pharm 2013; 3(1): 108-115
ISSN 2249-1848
www.pharmascholars.com
109
to a commercial level.[8]The present work is to develop a controlled release formulation of aspirin to increase bioavailability and to reduce risk of hospitalization for heart failure, coronary thrombosis with improved physicochemical property of aspirin.
MATERIALS AND METHODS
Material: Aspirin was obtained as a gift sample from
Cipla Pharmaceutical Ltd, Kurkumbh, Pune, India. Hydroxypropyl methyl cellulose (HPMC K 15 M), Ethyl cellulose were procured from Loba Chemicals, Mumbai. All solvents were of analytical grade.
Spherical Crystallization [9-11]: Quasi emulsion solvent diffusion method were used to obtained spherical agglomerates in which the, aspirin (1 gm) was dissolved in acetone. This solution was added into solution of various concentrations of HPMC K-15M (200 mg) and Ethyl Cellulose (700 mg) in acetone and chloroform. This resulting solution was then poured drop wise in to the distilled water. The resultant emulsion was stirred continuously at the speed of 1000 rpm using propeller type agitator at room temperature system for 10 min then the prepared agglomerates were collected by filtration and the spherical crystals were washed with distilled water and dried in a desiccator. The amount of HPMC K 15 M and agitation speed were selected as independent variables (factors), which were varied at three levels (low, medium and high). Whereas the percent drug release at 8 h and Carr’s index used as
dependent variables (responses).Design-Expert
8.0.6.1 software (Stat-Ease Inc., USA) was used for generation of polynomial equations and evaluation of the statistical experimental design and intensive grid search was performed over the experimental domain. Coded and actual values of variables and the experimental values are shown in Table 1.
Determination of Drug Content [11]: For the
determination of drug content, agglomerates
equivalent to 10mg of Aspirin were powdered and dissolved in 10 mL phosphate buffer (6.8) vortexes for 20 min. The solution was filtered and after sufficient dilution with phosphate buffer pH 6.8 analysed for drug content at 265.4 nm.
Micrometric properties [12]: Flowability characters were determined by the measurement of angle of repose by fixed funnel method. The loose bulk density (LBD) and tapped bulk density test apparatus. Carr’s index and Hauser’s ratio were calculated using LBD and TBD values.
In-vitro drug release studies [11]: The dissolution of spherical agglomerates of aspirin was determined by
using USP dissolution apparatus II (Electro Lab, Mumbai). Dissolution medium was 900 ml 1.2 phosphate buffer for 2 hour, after 2hrs replace it with 6.8 phosphate buffer for 6hrs at 50 rpm. The dissolution data recorded and analysed to calculate the amount of drug release and percentage cumulative drug release at different time intervals
from various formulations withdrawn at
0.5,1,2,3,4,5,6,7,8 h intervals.
Determination of moisture sensitivity [13, 14]: Moisture content of the batches was determined by Karl Fisher method using Karl Fisher titrator and by Spectroscopic Methods. In this study drug sample and spherical agglomerates were exposed to atmospheric conditions for 2, 4, 6 and 24 hrs. Then samples were analysed by using FTIR Spectroscopy, the scans were evaluated for presence of principle peaks of drug, shifting and masking of drug peaks and appearance of new peaks due to interaction of moisture.
Characterization of Agglomerates [12, 15]
Scanning electron microscopy (SEM) study: The scanning electron microscopic photographs of pure Aspirin and spherical agglomerates of Aspirin were obtained using Scanning Electron Microscope (Model-JEOL-JSM-6360A) to confirm and identify spherical nature.
Differential scanning calorimetry (DSC) study: The DSC study was carried out to detect possible transitions during process for preparation spherical agglomerates of Aspirin. The DSC patterns were recorded on a Mettler Toledo (Stare SW 920).
Powder x-ray diffraction: X-ray diffraction patterns are recorded using X-Ray diffractometer. Sample tubes are filled completely with sample and irradiated with monochromatized Cu Ka radiation and analysed between 10° and 60°at 30 kV voltages and 30 mA current.
Stability Study: A three month accelerated storage study of the agglomerates was carried out at 400C and 75 % relative humidity. The flowability, release profiles and drug content were determine at the end of one, two and three months and compared with those of aspirin agglomerates.
RESULT AND DISCUSSION
www.pharmascholars.com
110
selected as a good solvent, bridging liquid and poor solvent, respectively. The spherical agglomerates were prepared by using HPMC K-15 M, Ethyl Cellulose because they are most widely used
matrix-forming polymer because of its excellent
compatibility, multifunctional property and cost effective and agglomerates of better strengths are obtained and which are compressible easily into Agglomerates.
In vitro release profiles of Aspirin showed that a reduction in the amount of HPMC K15M resulted in an increase in the release rate of Aspirin when the amount of drug and ethyl cellulose was kept constant. So when the amount of HPMC was decreased the
release increased to 94.44±0.36. At higher
concentration the release of aspirin was much extended due to an increase in the viscosity of the gel as well as the formation of a gel layer with a longer diffusional path with an increase in the concentration of HPMC. Carr’s index and Hausner ratio were15.43±0.07, 1.18±0.002 respectively which revealed that, it has better micromeritic properties than other bathes. Thus for optimization the independent variable (X1) amount of HPMC at three levels 150, 200 and 250 mg was selected for further studies. As the agitation speed was varied from 500 to 1500 rpm, formed agglomerates at 500 rpm was very large in size and less spherical and at 1500 rpm agglomerates are spherical but are very fine whereas at 1000 rpm agglomerates are of optimum size and shape. Thus for optimization agitation speed was chosen as independent variable (X2) at three levels
800, 1000, 1200 rpm was selected. By the 32factorial
design amount of HPMC K 15 M(X1, mg), agitation speed(X2, rpm) were selected as independent variables (factors). The percent drug release at 8 h (Y1) and Carr’s index (Y2) used as dependent variables (responses). Formulations F1 to F9 were prepared using three different levels. The responses of the dependent variables were evaluated. Design-Expert 8.0.6.1 software (Stat-Ease Inc., USA) was used for generation of polynomial equations. The fitted regression equations relating the responses Carr’s index and release are shown in the equations-
Equation for % drug release
(Y1)=95.084.47X1 + 1.172X1 + 1.19X1X2
-2.26X12 -0.64X22[R2=0.9940, F- value=16.04,
p<0.05]
Equation for Carr’s index
(Y2)=13.88+0.96X1 - 1.18X2 + 0.48X1X2 -0.42X12
+0.0.43 X22[R2=0.9971, F- value=10.08, p<0.05]
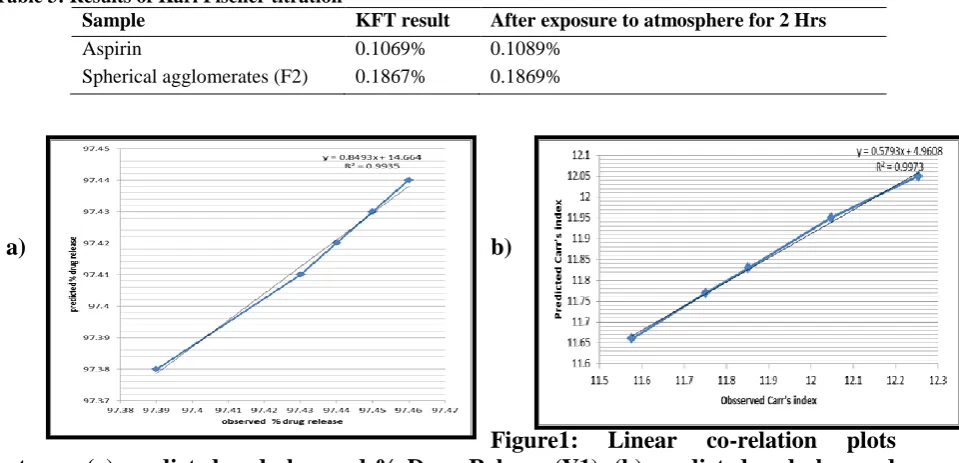
ANOVA results indicated that all the models were significant (p<0.05) for all responses under investigation. The close resemblance between
observed and predicted response values (Table 2)
indicates the validity of the generated model. The experimental and predicted value for both the response variables shows linear correlation plots between the observed and predicted values. The graph shown in Figure1demonstrates high values of R2 (>0.9) indicating excellent goodness of fit.
Micrometric properties: Pure drug exhibits poor flow characteristics (Carr’s index: 34.78±0.009%, angle of repose: 42±0.0070). It is inferred that agglomerate formation due to HPMC K 15 M and ethyl cellulose favoured sphericity, which leads to improved flow. Factorial design can serve as an essential tool to characterize multivariable. By varying independent variables, the values of F1 to F9 obtained for Carr’s index (11.32±0.004 to 15.51±0.009), Hausner’s ratio (1.12766±0.134 to 1.1875±0.004) and angle of repose
(28.44±0.2650 to 32.47±1.680) shows good
flowability and compressibility properties. Both the factors such as HPMC K 15 M and agitation speed favoured lowering of Carr’s index. Effect of independent variables X1 and X2 on Carr’s index can be explained with response plot (Figure 3a) which shows that increase in amount of polymer increases the Carr’s index at the same time increase in agitation speed revealed same effect.
In-vitro drug release studies: Percentage drug release of aspirin agglomerates decreased with increase in concentration of HPMC K 15 M in the solution and in agitation speed. As shown in
Figure2% drug release of F1- F9 formulation was
95.39±0.28, 98.88±0.16, 96.37±0.38, 92.95±0.02, 94.44±0.36, 96.58±0.27, 85.32±0.33, 87.41±0.47, 91.04±1.77 respectively. Second variable is agitation speed, as the Agitation speed increases from F1-F3, F4- F6, F7- F9 the % drug release is also increased this is because with increasing agitation speed of the system, the shear force applied to the droplets increased, leading to more dispersed and consolidated droplets. This results in a reduction in particle size of the product. Significant size reduction with narrow
size distribution considerably enhances the
dissolution due to increased surface area. The same result can be explain with the response plot in Figure
3b.The In-vitro release data of optimized
Anuradha, et al. Int J Pharm 2013; 3(1): 108-115
ISSN 2249-1848
www.pharmascholars.com
111
Karl Fischer titration (KFT): Karl Fischer titration is used to measure the moisture content of the sample. The pure drug and spherical agglomerates are exposed to KFT and the results are obtained initially and after exposure of both the samples to atmospheric conditions for 2, 4, 6 and 24 hrs are shown in table 3. Pure drug show increase in moisture content from 0.1069 to 0.5997%; whereas initially spherical agglomerates and after exposure to atmospheric condition for 2 hr show very slightly increase in moisture from 0.1867 to 0.1872 %. It shows that moisture absorption by the spherical agglomerates was significantly very less than the pure drug.
Spectroscopic Methods: The most useful spectral methods for the characterization of water in solids are Fourier transform infrared spectroscopy (FTIR). By comparison of the FTIR spectra for the anhydrous form with those of the sample with water, the –OH bands for water can be identified. The principal peaks of the aspirin shows at 1749cm-1(C=O ester), 1680cm-1(C=C), 1255cm-1(C-O), 970cm-1 (O-H), 1720cm-1 (COOH). The FTIR spectra of drug after exposure to 24 hrs to moisture shows appearance of extra peaks after 2 , 4, 6 and 24 hrs at intensities
2650-2880 cm-1(aldehyde), 2960-2850 cm-1 (c-h
stretching in alkanes), 1400 cm-1 (OH bending
broad), 1280 cm-1( C-O stretching of carboxylic acid) may be because of degradation of drug due to absorption of moisture. In contrast spherical agglomerate shows no any extra peak and retention of all the principle peaks shown in Figure 4. This indicates that there is no interaction of agglomerates with the moisture.
Scanning electron microscopy (SEM) study: The surface morphology of the agglomerates was accessed by scanning electron microscopy (SEM). The pure drug powder was in the form of fine needles, which is in agreement. This long-needle form of aspirin leads to very poor flow and compression difficulties. The surface morphology of
prepared agglomerates shows in Figure 5, the
prepared agglomerates were spherical in shape with slight rough surface, which give them good flowability and compressibility.
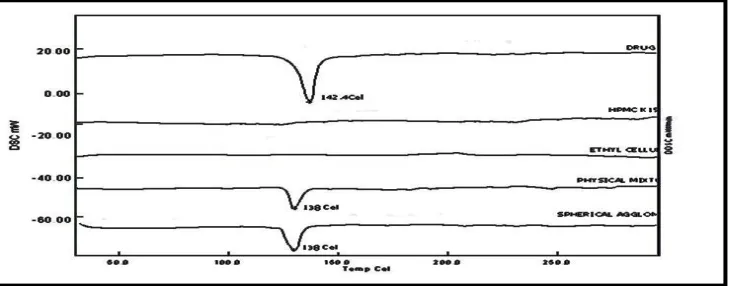
Differential scanning calorimetry (DSC) study: The DSC was carried out to study the compatibility or any interaction of drug and polymer after the formation of agglomerates. The Thermal analysis indicated that the DSC scan of the drug presented a sharp endothermic peak at 141-142°C corresponding to its
melting transition temperature (Figure 6). The
spherical agglomerates of Aspirin showed
endothermic peak at 138°C.Hence, there was no significant change in the position of peak of the drug in the spherical agglomerates of Aspirin but there is change in the relative intensities of the peak of the drug indicating decreased crystallinity.
Powder x-ray diffraction: Powder X-Ray Diffraction
Analysis (PXRD) is the primary tool for
characterization and monitoring of solid-state properties of the active ingredients and excipients.
Pure drug exhibited intense and long peaks (Figure 7
A) whereas spherical agglomerates showed a halo
pattern with less intense peaks, which indicate a considerable decrease in crystallinity of the drug in
the form of spherical agglomerates (Figure 7 B). The
results also indicated that polymorphic changes had not been detected after recrystallization, since all XRD peaks of the spherical agglomerates were consistent with the pattern of original drug crystals.
Stability study: Spherical agglomerates show good flowability and compactability. Carr’s Index and Hausner’s Ratio are in the range of 11.32±0.4 to 12.00±0.1 and 1.12±0.02 to 1.14±0.01.Drug Content of the spherical agglomerates was 98.96±0.20 initially and after 1, 2 and 3 months was98.89±0.12, 98.84±0.102 and 98.60±0.01 respectively. This shows there was no significant change all the values are within the limits of official standard. Initial % drug release of the spherical agglomerates was 98.88±0.16 %. After exposure of agglomerates to stability conditions for the period of 1, 2 and 3 months 98.83±0.09, 98.81±1.01 and 98.78±0.02 respectively, which shows no significant change in % drug release this indicates the spherical agglomerates are stable.
CONCLUSION
1848
www.pharmascholars.com
112
Table 1: 32Factorial Design for Preparation of Optimization Batch
*All the batches were contains 1gm Aspirin, ethyl cellulose 700 mg, 10 ml acetone, 1ml chloroform.
Table 2: Validation of response surface model
X1
(HPMCK
15Min mg)
X2(agitation
speed in
rpm)
Predicted result Actual results
% drug
release
Carr’s
index
% drug
release
Carr’s index
150 1100 97.38 11.66 97.39±0.007 12.2534±0.143
151 1100 97.41 11.77 97.43±0.01 12.0476±0.069
153 1000 97.42 11.83 97.44±0.014 11.8512±0.015
153 1100 97.43 11.95 97.45±0.15 11.7512±0.013
155 1120 97.27 12.00 97.46±0.014 11.5761±0.059
*The values represent the average of three determinations± S.D (n=3)
Table 3: Results of Karl Fischer titration
Sample KFT result After exposure to atmosphere for 2 Hrs
Aspirin 0.1069% 0.1089%
Spherical agglomerates (F2) 0.1867% 0.1869%
a)
b)
Figure1:
Linear
co-relation
plots
between (a) predicted and observed % Drug Release (Y1), (b) predicted and observed
Carr’s index (Y2)
Batch
Code
Variable levels in Coded form Actual values of variables
X1 X2 X1 X2
F1 -1 -1 150 800
F2 -1 0 150 1000
F3 -1 +1 150 1200
F4 0 -1 200 800
F5 0 0 200 1000
F6 0 +1 200 1200
F7 +1 -1 250 800
F8 +1 0 250 1000
Anuradha, et al. Int J Pharm 2013; 3(1): 108-115
ISSN
2249-1848
www.pharmascholars.com
113
Design-Expert® Software Factor Coding: Actual carr,s index
Design points above predicted value Design points below predicted value
X1 = A: concentration of polymer X2 = B: agitation speed
-1.00 -0.50 0.00 0.50 1.00
-1.00 -0.50
0.00 0.50
1.00 11
12 13 14 15 16
c
a
r
r
,
s
i
n
d
e
x
A: concentration of polymer B: agitation speed
Figure 2: Cumulative % drug release from Factorial Batches F1-F9
Figure 3: Response surface plot showing effect of formulation variables on percent
drug {a. Carr’s index (Y2) b. release at 8 h (Y1)}
www.pharmascholars.com
114
Figure 5: SEM of Aspirin and spherical agglomerates
Figure 6: DSC Thermogram for Drug, HPMC K 15 M, Ethyl Cellulose, Physical mixture
and spherical agglomerates
Figure7. Powder X-Ray Diffraction A. Pure Aspirin B.Spherical Agglomerates of Aspirin
REFERENCES
1. K. Analgesics Anti-inflammatory Drugs and Antipyretics. In: Martindale. The Complete Drug Reference,
32nd Raderick PJ, Wilkes HG, Meade TW. Br J Clin Pharmacol, 1993; 35: 219–226.
2. Parfitt ed., London; Pharmaceutical Press: 1999; 2–12.
Anuradha, et al. Int J Pharm 2013; 3(1): 108-115
ISSN 2249-1848
www.pharmascholars.com
115
4. Dubinin MM. Investigations of equilibrium and kinetics of adsorption of gases on Zeolites, Washington; American Chemical Society Publications: 1977, pp. 1 - 15.
5. Rasmuson C, Katta J. Int J Pharm, 2008; 348: 61-69.
6. Shangraw RF. Direct Compression Tableting: Encyclopedia of Pharmaceutical Technology, New York;
Marcel Dekker: 1988, pp. 85-160.
7. Kawashima Y, Okumura M, Takenaka H. Powder Technol, 1984; 39: 41–47.
8. Hileman GA, Goskonda SR, Spalitto AJ, Upadrashta SM. Drug Dev Ind Pharm, 1993; 19(4): 483–491.
9. Chariot M, Frances J, Lewis GA, Mathieu D, Phan Tan Luu R, Stevens HNE. Drug Dev Ind Pharm, 1987;
13 (9–11): 1639–1649.
10. Bodea A, Leucuta SE. Int J Pharm, 1997; 154(1): 49–57.
11. Nayak AU, Mutalik S, Reddy MS, Averineni KR, Kushtagi P, Udupa N. Eur J Pharm Biopharm, 2008; 70:
674–683.
12. Pawar PH, Pawar AP, Madhik KR, Pawar AP, Paradkar AR. Indian J Pharm Sci, 1998; 60: 24-28.
13. Shaikh AA, Pawar YD, Kumbhar ST. Int J Pharm Sci Res, 2012; 3(5): 1411-1414.
14. Conners KA, Amidon GL, Stella VJ. Chemical Stability of Pharmaceuticals, New York:
Wiley-Interscience: 1986.