198
RESEARCH ARTICLE
HEAVY METAL CONTENT
OF WATER RESOURCES
AFTER GANAPATI
IM-MERSION IN A SPECIFIED
REGION AND ITS
PHYSICO CHEMICAL
EFECTS ON WATER
Neha Pradhan, Sangeeta Parab*, A.V.Chitre
Chemistry Department, Jai Hind College, Churchgate, Mumbai- 400020.
Date Received: 20th March 2016; Date accepted: 25th April
2016; Date Published: 30th April 2016
E-mail: [email protected]
Abstract: The main objective of present study was to as-sess physicochemical parameters in different water sam-ples in various parts of Nalasopara region. For this 7 dif-ferent water samples are collected from 4 sampling sites in Nalasopara region, to determine the various physico-chemical properties on seasonal basis. In India the major source of water used to meet the domestic, agricultural and industrial needs is the ground water. The situation is aggravated by the problem of water pollution or contam-ination. The main goal of the present study was to assess heavy metal ions pollution in sea and pond water before and after Ganesh immersion. For this 4 different water samples are collected from sampling sites in Nalasopara town which is a part of Vasai Taluka of Mumbai suburb. Out of the four sites three are sea water samples collected on both high and low tides & one is pond water sample. Some of the heavy metals like Cd, Cu, Cr, Pb, Fe, Zn, Mn, Hg, and Ni were detected using highly sensitive ICP-AES instrument. The heavy metals were found to be in the
permissible limits but Cr and Cd were not detected. The results obtained are compared with World health organi-zation (WHO), Indian Standards (IS), European Standards and Beaureau of Indian Standards (BIS-10500:1991). The effect of presence of heavy metals on the physical-chemical parameters of water have been studied at differ-ent time intervals individually and in presence of each other.
Keywords: Nalasopara, Vasai Taluka physicochemical, salinity, turbidity.
Introduction:
Trace metals are elements such as chromium, cobalt, cop-per, iron, magnesium, selenium, and zinc that normally occur at very low levels in the environment. Living things need very small amounts of some trace metals, but high levels of these same metals can be toxic. For example, iron is an essential element for many living things. In human blood, iron transports oxygen around the body. If too much iron is consumed, however, there can be negative effects on human health.
Levels of trace metals in the environment increase when they are released from rocks. These releases can occur through natural processes or through human activities. Natural processes include breakdown of rocks, spreading of mid-ocean ridges, and volcanic activity. Natural sources of metals can be very important. Human activities that release trace metals into the environment include mining, smelting, burning of coal, and wastewater dis-posal. The tar sands and diamond and metal mining can release trace metals into the surrounding environment. This often occurs when contaminated waste is not proper-ly disposed of or when a lot of dust from the mine site blows around. For the most part, human contributions of trace metals to the environment have been approaching, or even exceeding, natural inputs.
dis-199
charge tailings, so there was often pollution of local lakes and streams. Because these lakes and streams have often also become acidic due to the mine pollution, trace metals can become a problem and have toxic effects on local fish and bugs [1].
The trace elements include more than 60 substances that are usually present in low concentrations in the environ-ment and mammalian tissues. They are generally present in tissue and serum in picogram or microgram amounts, and their absorption, distribution, storage and excretion are tightly controlled. At least a dozen of them are con-sidered essential minerals in humans. The trace elements and most metals are usually present in adequate amounts in the diet and environment, and supplementation is gen-erally not needed. An exception to this is iron [2].
In the present study our main goal of was to assess heavy metal ions pollution in ground water before and after Ganesh immersion. Also how much heavy metals can affect the physico-chemical parameters of water have been studied at different time intervals individually and in presence of each other.
MATERIALS AND METHODS
The present study is in sea and pond water samples be-fore and after Ganesh immersion. Samples were collected before immersion i.e. in the month of July in pre-washed polyethylene bottles. Grab method of collection was used for collecting water samples. pH and temperature were measured on site. The collection and preservation of sam-ples were as per the Standard methods as per APHA
[11].Similar way sampling is also done after around twenty
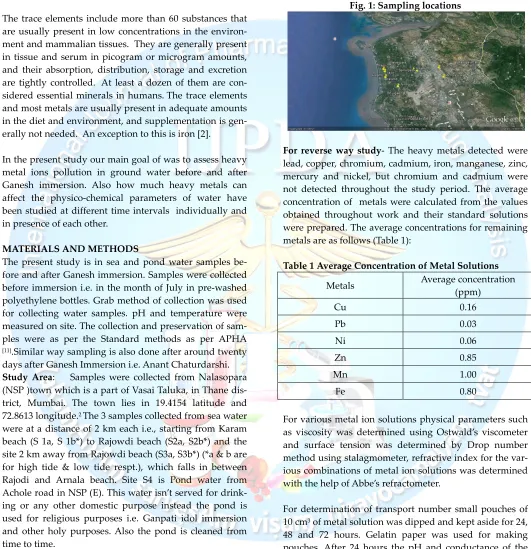
days after Ganesh Immersion i.e. Anant Chaturdarshi. Study Area: Samples were collected from Nalasopara (NSP )town which is a part of Vasai Taluka, in Thane dis-trict, Mumbai. The town lies in 19.4154 latitude and 72.8613 longitude.2 The 3 samples collected from sea water
were at a distance of 2 km each i.e., starting from Karam beach (S 1a, S 1b*) to Rajowdi beach (S2a, S2b*) and the site 2 km away from Rajowdi beach (S3a, S3b*) (*a & b are for high tide & low tide respt.), which falls in between Rajodi and Arnala beach. Site S4 is Pond water from Achole road in NSP (E). This water isn’t served for drink-ing or any other domestic purpose instead the pond is used for religious purposes i.e. Ganpati idol immersion and other holy purposes. Also the pond is cleaned from time to time.
Physicochemical and Microbial Analysis: The samples were analyzed for 24 parameters. The physical parame-ters like pH and temperature were determined on site using pH paper and thermometer (±0.1) respectively. The chemical & microbial parameters were analyzed by
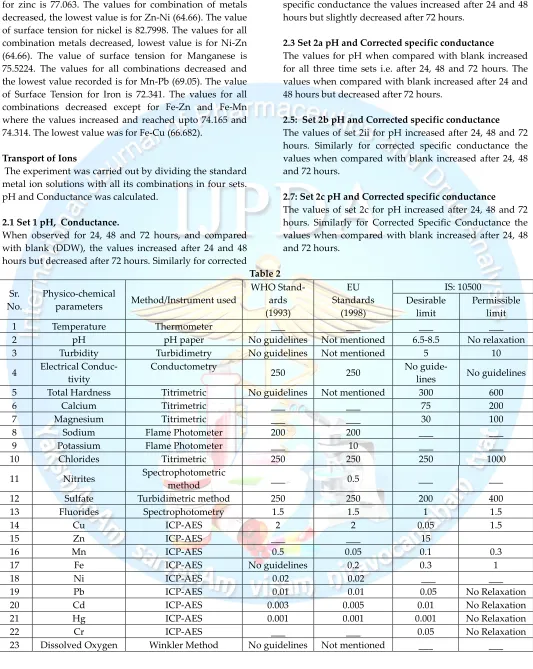
Standard Methods (APHA) [3]. The parameters and their technique of analysis are listed in table 2. All chemicals used were of A.R. grade and double distilled water was used throughout this study.
Fig. 1: Sampling locations
For reverse way study- The heavy metals detected were lead, copper, chromium, cadmium, iron, manganese, zinc, mercury and nickel, but chromium and cadmium were not detected throughout the study period. The average concentration of metals were calculated from the values obtained throughout work and their standard solutions were prepared. The average concentrations for remaining metals are as follows (Table 1):
Table 1 Average Concentration of Metal Solutions
Metals Average concentration
(ppm)
Cu 0.16
Pb 0.03
Ni 0.06
Zn 0.85
Mn 1.00
Fe 0.80
For various metal ion solutions physical parameters such as viscosity was determined using Ostwald’s viscometer and surface tension was determined by Drop number method using stalagmometer, refractive index for the var-ious combinations of metal ion solutions was determined with the help of Abbe’s refractometer.
For determination of transport number small pouches of 10 cm3 of metal solution was dipped and kept aside for 24,
200
subtracted from the blank (Double Distilled Water) and the final readings were recorded.
Results and Discussion
The results obtained are compared with World health organization (WHO), European Standards and Beaureau of Indian Standards (BIS-10500:1991) [4-6].Table 2 gives the methods used to determine physico-chemical parame-ters with its comparison with the standards.
pH is a measure of acidity or alkalinity and measures the concentration of H+ ion in solution. There was no
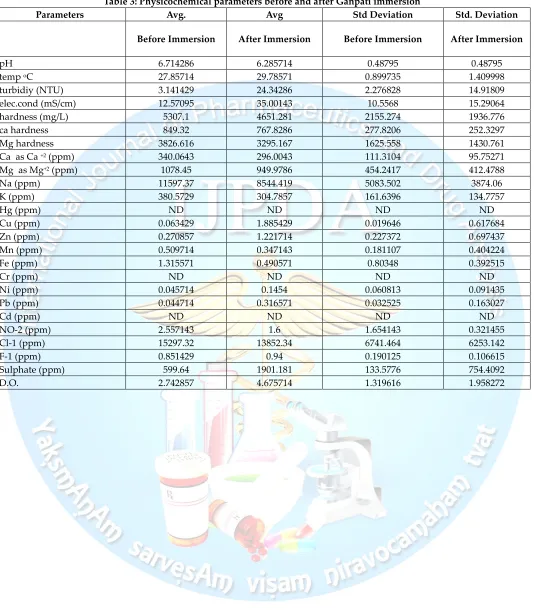
signifi-cant difference in the values of pH. For pH, range of 6-8.5 is recommended. The pond water sample was in this range. The values of conductance in study were seen to increase in all sea water samples but it decreased in pond water sample. Also the value was within limits as per standard. No significant difference in the values of tem-perature was observed. No significant difference in values of DO was observed. In study the values of turbidity were within the permissible limit in pond water sample. In case of sea water samples there was a high rise in the values of turbidity after visarjan.In this study, there was no significant difference in the values of hardness. The values of hardness in all water samples were in the per-missible limit of 600 mg/L set by IS: 10500. There is no significant difference in values of Ca, Mg, Na and K in all water samples. The pond water sample falls within the permissible limits by IS: 10500 for Ca 200 ppm, Mg 100 ppm and in the range by WHO and EU for Na 200 ppm. The Cl- content increased in pond water sample S-4 post
visarjan sample but was found to be within the desirable limits set by IS: 10500. In sea water samples there was no significant difference.
In present study, the values of sulfate increased in all sea water samples after visarjan whereas in case of pond wa-ter sample there was no significant difference observed. The sulfate value for pond water sample was within the permissible limits by IS: 10500 (i.e. 400 mg/L). In pond water sample the value of nitrite laid in the range of 0.5 ppm as per EU standards before visarjan but after visarjan the value increased as high as 1.6 ppm. There was no significant difference in the values of F-. The pond
water sample had values within range by IS: 1500 of de-sirable limit 1 ppm.
The values of Cu were seen to increase after visarjan in all sea water samples and in pond water sample, in fact in case of pond water sample the value was more than the permissible limit by IS:10500 (1.5 ppm) reaching up to 2.45 ppm . The values of lead in all water samples in-creased after visarjan. The value in sample S-4 was very high after visarjan. Nickel in pond water increased after
visarjan and it was as high as 0.24 ppm whereas there was no significant difference observed in sea water samples for Ni. Zn has increased in all water samples after visarjan but it was well within the desirable limits, in case of pond water, set by IS: 10500. There was no significant difference observed for Fe in all water samples. Also, for pond water sample the value was within the permissible limit by IS: 10500. There was no significant difference observed in the sea water samples but in case of pond water the value increased after visarjan and it was alarmingly high as compared to standard. Cr, Cd and Hg were below detec-tion limits at all sampling stadetec-tions.
Viscosity
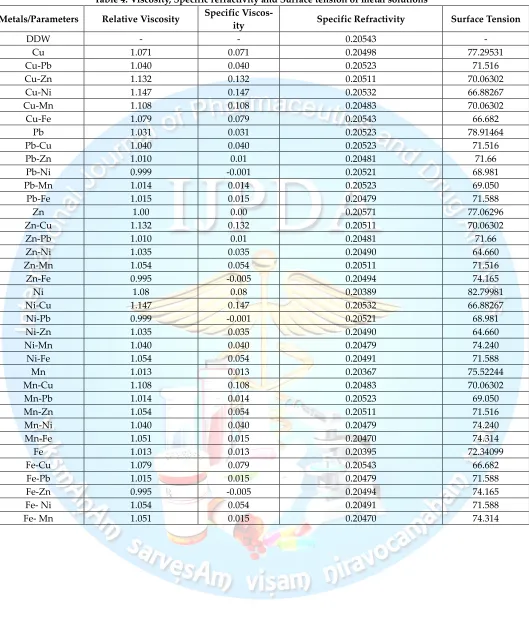
It is seen that relative viscosity for copper is 1.071. The values for combined metal solution are increased for all other combinations except for Cu-Pb which is 1.040. The highest value is seen for Cu-Ni which came out to be 1.147. The value of relative viscosity for lead is 1.031. The value of all other combinations decreased, except that for Pb-Cu which came out to be 1.040. The lowest being for Pb-Ni 0.999. The value of relative viscosity for zinc is 1.00. All other values increased except Zn-Fe which is 0.995. The highest value is for Zn-Mn 1.054. The value of relative viscosity for Nickel is 1.08. All other values increased ex-cept for Ni-Pb which is 0.999. The highest value recorded is for Ni-Cu 1.147. The value of relative viscosity for man-ganese is 1.013. The values for all combinations increased highest being 1.108 of Mn-Cu. The value of relative vis-cosity for iron is 1.013. The value for all other combina-tions increased except for Fe-Zn which is 0.995.
Specific Refractivity
The specific refractivity of DDW is 0.20543. The value of Cu is 0.20498. The values increased for all the combina-tions except for Cu-Mn which came out to be 0.20483. The value for lead is 0.20523. The value for all other combina-tions increased except for Pb-Zn (0.20481) and Pb-Fe (0.20479). The value for zinc is 0.20571. The values for all other combinations decreased, the lowest being for Zn-Pb (0.20481). The value for Ni is 0.20389. The value increased for all other combinations highest being Ni-Cu (0.20532). The value for manganese is 0.20367. The value for all oth-er combinations increased highest being Mn-Pb (0.20523). The value of specific refractivity for iron is 0.20395. The values or all other combination increased highest being Fe-Cu (0.20543).
Surface Tension
201
for zinc is 77.063. The values for combination of metals decreased, the lowest value is for Zn-Ni (64.66). The value of surface tension for nickel is 82.7998. The values for all combination metals decreased, lowest value is for Ni-Zn (64.66). The value of surface tension for Manganese is 75.5224. The values for all combinations decreased and the lowest value recorded is for Mn-Pb (69.05). The value of Surface Tension for Iron is 72.341. The values for all combinations decreased except for Fe-Zn and Fe-Mn where the values increased and reached upto 74.165 and 74.314. The lowest value was for Fe-Cu (66.682).
Transport of Ions
The experiment was carried out by dividing the standard metal ion solutions with all its combinations in four sets. pH and Conductance was calculated.
2.1 Set 1 pH, Conductance.
When observed for 24, 48 and 72 hours, and compared with blank (DDW), the values increased after 24 and 48 hours but decreased after 72 hours. Similarly for corrected
specific conductance the values increased after 24 and 48 hours but slightly decreased after 72 hours.
2.3 Set 2a pH and Corrected specific conductance
The values for pH when compared with blank increased for all three time sets i.e. after 24, 48 and 72 hours. The values when compared with blank increased after 24 and 48 hours but decreased after 72 hours.
2.5: Set 2b pH and Corrected specific conductance
The values of set 2ii for pH increased after 24, 48 and 72 hours. Similarly for corrected specific conductance the values when compared with blank increased after 24, 48 and 72 hours.
2.7: Set 2c pH and Corrected specific conductance
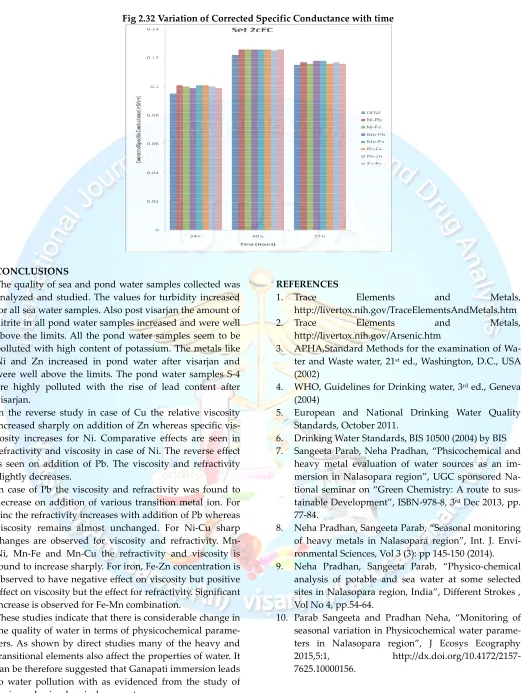
The values of set 2c for pH increased after 24, 48 and 72 hours. Similarly for Corrected Specific Conductance the values when compared with blank increased after 24, 48 and 72 hours.
Table 2
Sr. No.
Physico-chemical
parameters Method/Instrument used
WHO Stand-ards (1993)
EU Standards
(1998)
IS: 10500 Desirable
limit
Permissible limit
1 Temperature Thermometer ___ ___ ___ ___
2 pH pH paper No guidelines Not mentioned 6.5-8.5 No relaxation
3 Turbidity Turbidimetry No guidelines Not mentioned 5 10
4 Electrical Conduc-tivity
Conductometry
250 250 No
guide-lines No guidelines
5 Total Hardness Titrimetric No guidelines Not mentioned 300 600
6 Calcium Titrimetric ___ ___ 75 200
7 Magnesium Titrimetric ___ ___ 30 100
8 Sodium Flame Photometer 200 200 ___ ___
9 Potassium Flame Photometer ___ 10 ___ ___
10 Chlorides Titrimetric 250 250 250 1000
11 Nitrites Spectrophotometric
method ___ 0.5 ___ ___
12 Sulfate Turbidimetric method 250 250 200 400
13 Fluorides Spectrophotometry 1.5 1.5 1 1.5
14 Cu ICP-AES 2 2 0.05 1.5
15 Zn ICP-AES ___ ___ 15
16 Mn ICP-AES 0.5 0.05 0.1 0.3
17 Fe ICP-AES No guidelines 0.2 0.3 1
18 Ni ICP-AES 0.02 0.02 ___ ___
19 Pb ICP-AES 0.01 0.01 0.05 No Relaxation
20 Cd ICP-AES 0.003 0.005 0.01 No Relaxation
21 Hg ICP-AES 0.001 0.001 0.001 No Relaxation
22 Cr ICP-AES ___ ___ 0.05 No Relaxation
202 Table 3: Physicochemical parameters before and after Ganpati immersion
Parameters Avg. Avg Std Deviation Std. Deviation
Before Immersion After Immersion Before Immersion After Immersion
pH 6.714286 6.285714 0.48795 0.48795
temp oC 27.85714 29.78571 0.899735 1.409998
turbidiy (NTU) 3.141429 24.34286 2.276828 14.91809
elec.cond (mS/cm) 12.57095 35.00143 10.5568 15.29064
hardness (mg/L) 5307.1 4651.281 2155.274 1936.776
ca hardness 849.32 767.8286 277.8206 252.3297
Mg hardness 3826.616 3295.167 1625.558 1430.761
Ca as Ca +2 (ppm) 340.0643 296.0043 111.3104 95.75271
Mg as Mg+2 (ppm) 1078.45 949.9786 454.2417 412.4788
Na (ppm) 11597.37 8544.419 5083.502 3874.06
K (ppm) 380.5729 304.7857 161.6396 134.7757
Hg (ppm) ND ND ND ND
Cu (ppm) 0.063429 1.885429 0.019646 0.617684
Zn (ppm) 0.270857 1.221714 0.227372 0.697437
Mn (ppm) 0.509714 0.347143 0.181107 0.404224
Fe (ppm) 1.315571 0.490571 0.80348 0.392515
Cr (ppm) ND ND ND ND
Ni (ppm) 0.045714 0.1454 0.060813 0.091435
Pb (ppm) 0.044714 0.316571 0.032525 0.163027
Cd (ppm) ND ND ND ND
NO-2 (ppm) 2.557143 1.6 1.654143 0.321455
Cl-1 (ppm) 15297.32 13852.34 6741.464 6253.142
F-1 (ppm) 0.851429 0.94 0.190125 0.106615
Sulphate (ppm) 599.64 1901.181 133.5776 754.4092
203 Table 4: Viscosity, Specific refractivity and Surface tension of metal solutions
Metals/Parameters Relative Viscosity Specific
Viscos-ity Specific Refractivity Surface Tension
DDW - - 0.20543 -
Cu 1.071 0.071 0.20498 77.29531
Cu-Pb 1.040 0.040 0.20523 71.516
Cu-Zn 1.132 0.132 0.20511 70.06302
Cu-Ni 1.147 0.147 0.20532 66.88267
Cu-Mn 1.108 0.108 0.20483 70.06302
Cu-Fe 1.079 0.079 0.20543 66.682
Pb 1.031 0.031 0.20523 78.91464
Pb-Cu 1.040 0.040 0.20523 71.516
Pb-Zn 1.010 0.01 0.20481 71.66
Pb-Ni 0.999 -0.001 0.20521 68.981
Pb-Mn 1.014 0.014 0.20523 69.050
Pb-Fe 1.015 0.015 0.20479 71.588
Zn 1.00 0.00 0.20571 77.06296
Zn-Cu 1.132 0.132 0.20511 70.06302
Zn-Pb 1.010 0.01 0.20481 71.66
Zn-Ni 1.035 0.035 0.20490 64.660
Zn-Mn 1.054 0.054 0.20511 71.516
Zn-Fe 0.995 -0.005 0.20494 74.165
Ni 1.08 0.08 0.20389 82.79981
Ni-Cu 1.147 0.147 0.20532 66.88267
Ni-Pb 0.999 -0.001 0.20521 68.981
Ni-Zn 1.035 0.035 0.20490 64.660
Ni-Mn 1.040 0.040 0.20479 74.240
Ni-Fe 1.054 0.054 0.20491 71.588
Mn 1.013 0.013 0.20367 75.52244
Mn-Cu 1.108 0.108 0.20483 70.06302
Mn-Pb 1.014 0.014 0.20523 69.050
Mn-Zn 1.054 0.054 0.20511 71.516
Mn-Ni 1.040 0.040 0.20479 74.240
Mn-Fe 1.051 0.015 0.20470 74.314
Fe 1.013 0.013 0.20395 72.34099
Fe-Cu 1.079 0.079 0.20543 66.682
Fe-Pb 1.015 0.015 0.20479 71.588
Fe-Zn 0.995 -0.005 0.20494 74.165
Fe- Ni 1.054 0.054 0.20491 71.588
Fig 2.26 Variation of
Fig 2.25 Variation of pH with time
Fig 2.26 Variation of Corrected Specific Conductance with time
Fig 2.28 Variation of Corrected Specific Conductance with time Fig 2.27 Variation of pH with time
Fig 2.28 Variation of Corrected Specific Conductance with time
Fig 2.30 Variation of Corrected Specific Conductance with time Fig 2.29 Variation of pH with time
Fig 2.30 Variation of Corrected Specific Conductance with time
Fig 2.31 Variation of pH with time
Fig 2.32 Variation of Corrected Specific Conductance with time
CONCLUSIONS
The quality of sea and pond water samples collected was analyzed and studied. The values for turbidity in
for all sea water samples. Also post visarjan the amount of nitrite in all pond water samples increased and were well above the limits. All the pond water samples seem to be polluted with high content of potassium. The metals like Ni and Zn increased in pond water after visarjan and were well above the limits. The pond water samples S are highly polluted with the rise of lead content after visarjan.
In the reverse study in case of Cu the relative viscosity increased sharply on addition of Zn whereas specific vi cosity increases for Ni. Comparative effects are seen in refractivity and viscosity in case of Ni. The reverse effect is seen on addition of Pb. The viscosity and refractivity slightly decreases.
In case of Pb the viscosity and refractivity
decrease on addition of various transition metal ion. For zinc the refractivity increases with addition of Pb whereas viscosity remains almost unchanged. For Ni
changes are observed for viscosity and refractivity. Mn Ni, Mn-Fe and Mn-Cu the refractivity and viscosity is found to increase sharply. For iron, Fe-Zn concentration is observed to have negative effect on viscosity but positive effect on viscosity but the effect for refractivity. Significant increase is observed for Fe-Mn combination.
These studies indicate that there is considerable change in the quality of water in terms of physicochemical param ters. As shown by direct studies many of the heavy and transitional elements also affect the properties of water. It can be therefore suggested that Ganapati immersion leads to water pollution with as evidenced from the study of various physicochemical parameters.
Fig 2.32 Variation of Corrected Specific Conductance with time
The quality of sea and pond water samples collected was analyzed and studied. The values for turbidity increased for all sea water samples. Also post visarjan the amount of nitrite in all pond water samples increased and were well above the limits. All the pond water samples seem to be polluted with high content of potassium. The metals like ed in pond water after visarjan and were well above the limits. The pond water samples S-4 are highly polluted with the rise of lead content after
In the reverse study in case of Cu the relative viscosity as specific vis-cosity increases for Ni. Comparative effects are seen in refractivity and viscosity in case of Ni. The reverse effect is seen on addition of Pb. The viscosity and refractivity
In case of Pb the viscosity and refractivity was found to decrease on addition of various transition metal ion. For zinc the refractivity increases with addition of Pb whereas viscosity remains almost unchanged. For Ni-Cu sharp changes are observed for viscosity and refractivity.
Mn-Cu the refractivity and viscosity is Zn concentration is observed to have negative effect on viscosity but positive effect on viscosity but the effect for refractivity. Significant
ination.
These studies indicate that there is considerable change in the quality of water in terms of physicochemical parame-ters. As shown by direct studies many of the heavy and transitional elements also affect the properties of water. It e suggested that Ganapati immersion leads to water pollution with as evidenced from the study of
REFERENCES
1. Trace Elements and Metals,
http://livertox.nih.gov/TraceElementsAndMetals.htm
2. Trace Elements and Metals,
http://livertox.nih.gov/Arsenic.htm
3. APHA,Standard Methods for the examination of W ter and Waste water, 21st ed., Washington, D.C., USA
(2002)
4. WHO, Guidelines for Drinking water, 3 (2004)
5. European and National Drinking Water Quality Standards, October 2011.
6. Drinking Water Standards, BIS 10500 (2004) by BIS 7. Sangeeta Parab, Neha Pradhan, “Phsicochemical and
heavy metal evaluation of water sources as an i mersion in Nalasopara region”, UGC sponsored N tional seminar on “Green Chemistry: A route to su tainable Development”, ISBN
77-84.
8. Neha Pradhan, Sangeeta Parab, “Seasonal monitoring of heavy metals in Nalasopara region”, Int. J. Env ronmental Sciences, Vol 3 (3): pp 145
9. Neha Pradhan, Sangeeta Parab, “Physico
analysis of potable and sea water at some selected sites in Nalasopara region, India”, Different Strokes , Vol No 4, pp.54-64.
10. Parab Sangeeta and Pradhan Neha, “Monitoring of seasonal variation in Physicochemical water param ters in Nalasopara region”, J Ecosys Ecography 2015,5:1, http://dx.doi.org/10.4172/2157 7625.10000156.
207
Trace Elements and Metals,
http://livertox.nih.gov/TraceElementsAndMetals.htm
Trace Elements and Metals,
http://livertox.nih.gov/Arsenic.htm
APHA,Standard Methods for the examination of Wa-ed., Washington, D.C., USA
WHO, Guidelines for Drinking water, 3rd ed., Geneva
and National Drinking Water Quality
Drinking Water Standards, BIS 10500 (2004) by BIS Sangeeta Parab, Neha Pradhan, “Phsicochemical and heavy metal evaluation of water sources as an im-mersion in Nalasopara region”, UGC sponsored Na-tional seminar on “Green Chemistry: A route to sus-tainable Development”, ISBN-978-8, 3rd Dec 2013, pp.
Neha Pradhan, Sangeeta Parab, “Seasonal monitoring of heavy metals in Nalasopara region”, Int. J. Envi-ronmental Sciences, Vol 3 (3): pp 145-150 (2014). Neha Pradhan, Sangeeta Parab, “Physico-chemical analysis of potable and sea water at some selected sites in Nalasopara region, India”, Different Strokes ,