e- ISSN: 2278-067X, p-ISSN: 2278-800X, www.ijerd.com
Volume 14, Issue 7 (July Ver. II 2018), PP.55-62
Development and Performance Test of Filtration-type Facility for
Non-point Pollution Source Reduction
Sung Soo Yoo
1, Hyon Wook Ji
1,*1Department Of Land, Water And Environment Research, Korea Institute Of Civil Engineering And Building
Technology, 283, Goyangdae-Ro, Ilsanseo-Gu, Goyang, Gyeonggi-Do, 10223, Korea.
Correspondence: Hyon Wook Ji 1
ABSTRACT: The purpose of this study was to develop a downward flow type filtration facility named as CYFILTER for treatment of non-point pollution sources and to evaluate the feasibility of field application through performance test. The developed CYFILTER sought to increase in treatment efficiency by designing the filter sand, a granular media, as two layers and ease the washing by adopting backwashing. The developed CYFILTER was pilot-scale, and the performance test was conducted based on the "experimental method of filtration facility" in the manual for installation and management of the facility of non-point pollution published by the Ministry of Environment of Korea. The results of the head loss test showed that average head loss in medium layer and whole device were 7.73 and 9.40 cm, respectively, which are satisfying the design standard (10 cm or less for whole device, 20 cm or less for medium layer). The media applied to this device is filtration sand (natural silica sand), a granular media and satisfied the specification required in Water Service Facility Standard. The infiltration velocity calculated based on them was 161.4 m/h, which satisfying the criteria, over two times filtration linear velocity (< 20 m/h), required in manual. The results of SS removal efficiency test using influent water (average SS concentration: 349.4 mg/L) showed that average of SS concentration during 10, 20, 30, 40, 50, 60 minutes of operation time were 17.6, 44.1, 43.0, 49.6, 56.8, and 58.8 mg/L, respectively, and average SS removal efficiency was 87.1%, indicating that this device is satisfying the criteria for SS removal efficiency. The experimental device was run until the accumulated solid amount of loading reach 9.0 kg/m2 (80 minutes), and the results showed that the average head loss measured under four solid loadings was about 8 cm, satisfying the criteria, 10 cm. To investigate the restoration level of head loss by backwashing, the experiment was performed parallel with head loss test under various solid loading, however, no significant difference in head loss by solid loading was observed because no blocking of media occurred during four tests, and this made the investigation of the restoration level by backwashing to be difficult. We, in response to this problem, investigated effect of backwashing based on the restored SS removal efficiency after backwashing, suggesting that backwashing condition in this study and the resultant restoration level is satisfying the design criteria required.
KEYWORDS: Non-point pollution source; filtration type facility; performance test; head loss
--- --- Date of Submission: 27-07-2018 Date of acceptance: 10-08-2018 --- ---
I.
INTRODUCTIONSince the sewage maintenance project in the 1980s, in Korea, the treatment rate of point pollution sources such as wastewater from factory and house has been greatly improved, however the improvement of water quality has not reached expectation, which is attributable mainly to the non-point pollution sources [1-3].
The urbanization has resulted in an increase in the impermeable layers such as road, parking lot, and building, and a reduction in the ratio of natural ground, and as a result, various pollutants generated in the form of non-point pollution are introduced into the river without any treatment, leading to water pollution[4-6]. In terms of management of non-point pollution source, therefore, management of rainfall runoff has been established as a new paradigm [7]. Since the rainwater, especially flowing from the city, contains various pollutants such as organic pollutants, pathogenic microorganisms, and heavy metals, the use of collected rainwater or direct discharge of such rainwater into the river may occur various problems in terms of water quality[8,9]. It means that it is urgent, for efficient management of rainfall, to develop a technology that can control the initial rainfall including high concentration pollutants [10].
CYFILTER was pilot-scale, and the performance test was conducted based on the "experimental method of filtration facility" in the manual for installation and management of the facility of non-point pollution published by the Ministry of Environment of Korea.
II.
MATERIAL&METHODSA. Experimental setup
The CYFILTER used in this performance test is a downward flow type media-based non-point pollution facility, which consists of an inlet manhole, pretreatment tank, filtration tank, effluent channel, and a treated water tank. The experimental setting simulated the system applied to the actual field and was manufactured to be pilot scale with treatment capacity of 11m3/h. To measure the head, a total of four piezometers (inlet manhole, top of media layer, bottom of media layer, and effluent channel) were installed and and a backwash fan was installed for air cleaning during backwash. The filter media consisted of two layers using natural silica sand, a granular media where filtration area was 0.56 m2 and the filtration linear velocity was 19.6 m3/m2/ h. The top of the filter layer was filled with silica sand with 2-5mm diameter to be height of 40 cm and bottom was filled with silica sand with 5-10mm diameter to be height of 20 cm. The installation scheme was shown in Fig. 1.
Fig.1:Installation scheme of CYFILTER developed
B. Performance test procedure
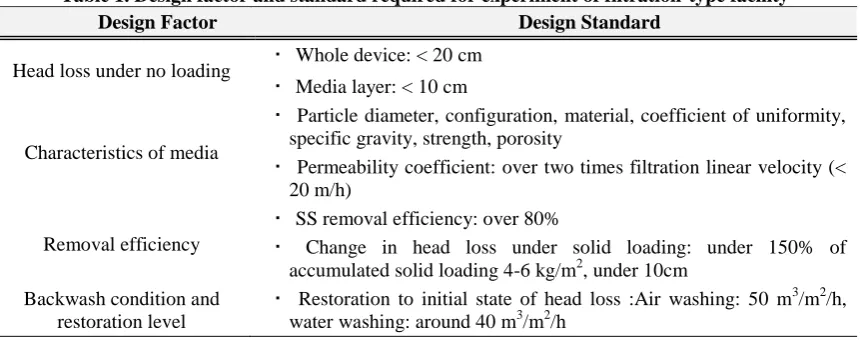
The design factor and design standard for experiment specified required by Ministry of Environment (Manual for Installation and Management of the facility of non-point pollution, revised on July 2016) was shown in Table 1, and the following experiment was performed to derive the design factor value of this CYFILTER.
Table 1. Design factor and standard required for experiment of filtration-type facility Design Factor Design Standard
Head loss under no loading ‧ Whole device: < 20 cm ‧ Media layer: < 10 cm
Characteristics of media
‧ Particle diameter, configuration, material, coefficient of uniformity, specific gravity, strength, porosity
‧ Permeability coefficient: over two times filtration linear velocity (< 20 m/h)
Removal efficiency
‧ SS removal efficiency: over 80%
‧ Change in head loss under solid loading: under 150% of accumulated solid loading 4-6 kg/m2, under 10cm
Backwash condition and restoration level
‧ Restoration to initial state of head loss :Air washing: 50 m3/m2/h, water washing: around 40 m3/m2/h
Before experiment, the impurities in media were removed by performing backwashing two times (air washing, water washing) and media layers were stabilized to ensure more reliable data. The clear water was used as intake water and operation lasted for 90 minutes and was repeated three times. The changes in head were measured after 30 minutes using the piezometer installed at piezometers installed at ① inlet manhole, ② top of media layer, ③ bottom of media layer, and ④ effluent channel, and based on the results, the head loss for whole device and media layers were calculated.
B.2 Characteristics of media
The media applied to this device is filtration sand (natural silica sand), a granular media and satisfied the specification required in Water Service Facility Standard. Since media used in this study is commonly used material, the diameter, configuration, material, coefficient of uniformity, specific gravity, and strength of media were, without addition measurement, replaced by the values offed by manufactures (see Table 4.2), and only permeability coefficient and porosity were measured in this study.
The permeability coefficient was calculated by the Law of Darcy as shown in equation (1), the parameters of the law were derived through the impermeability test. The experimental condition and method of the constant head permeability test is same with those for head loss under no loading and the filtration tank in this experiment has same structure with that of the constant head permeability test (inflow rate (Q): 11 m3/h, filling depth (L): 0.6 m, filtration area (A): 0.56 m2). This experiment was, therefore, performed parallel with head loss experiment.
(1) Where,
A: filtration rate L: height of media layer Q: inflow rate
h: head difference of media layer k: permeability coefficient.
B.3 Removal efficiency B.3.1 SS removal efficiency
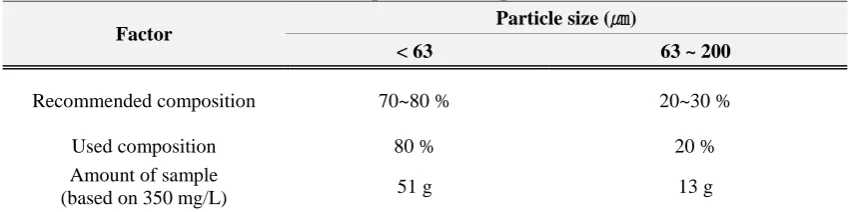
The SS removal efficiency test lasted for 60 minutes and was repeated three times and, after each test the backwashing (air washing, water washing) was performed to restore the head loss. The influent and treated water of 2 L were sampled per 10 minutes of operation time to analyze the SS concentration and calculate the removal efficiency of the device. The inflow rate was 11 m3/h (183.3ℓ/min) and the flow rate of backwashing was 50 m3/m2/h for both air and water washing. The SS concentration was maintained as 350 mg/L constantly by adding artificial silica sand sample selected by standard sieves into inflow manhole every 1 minute (solid loading at the end of test: 6.86 kg/m2). Table 2 show the composition of input samples.
Table 2. Amount and composition of sample added into influent.
Factor Particle size (㎛)
< 63 63 ~ 200
Recommended composition 70~80 % 20~30 %
Used composition 80 % 20 %
Amount of sample
(based on 350 mg/L) 51 g 13 g
B.3.2 Head loss under various solid loading
This experiment was carried out parallel with SS removal test due to their identical test conditions, though the operation time in this experiment was 80 minutes (i.e. additional 20 minutes after completing SS removal test), to make loading to reach 9.0 kg/m2, and repeated four times. The solid loading was calculated using equation 2.
(2)
Where,
T: operation time A: filtration rate
The changes in head were measured every 10 minutes using the piezometer installed at piezometers installed at ① inlet manhole, ② top of media layer, ③ bottom of media layer, and ④ effluent channel, and based on the results, the head loss was calculated.
B.4 Restoration level by backwash
This experiment was in accordance with following manual and performed parallel with test for head loss under various solid loading. The treated water was used as backwashing water and the flow rate and retention time of water backwashing were 40 m3/m2/h and one minute, respectively, and the values for air backwashing were 50 m3/m2/h and one minute, respectively.
a. Run the drain pump (pretreatment tank) to evacuate the pre-treatment tank.
b. Run the backwash water supply valve (treated water tank) and backwash residual water outlet valve (filtration tank) after operating backwash fan for 2-3 minutes.
c. Stop backwash fan after discharging all backwash water.
d. Discharge slack water in filtration tank by running filtration tank discharge pump. e. Device System initialization after discharging all slack water
III.
RESULTSANDDISCUSSIONA. Head loss under no loading
The results of head loss test performed for 30 minutes and three times to calculate necessary difference in head and to determine the structural fitness of facility for non-point pollution are shown in Table 3.
Table 3. Results of head loss test under no loading
No.
Piezometric head (cm) Average head
loss of whole device
Average head loss of media
layer
Inlet manhole Top of
media layer
Bottom of media layer
Effluent channel
1 17.5 16.2 8.4 8.1
9.4 7.73
2 17.5 16.1 8.4 8.1
3 17.5 16.1 8.4 8.1
Ave. 17.5 16.13 8.4 8.1
The average head measured at inlet manhole, top of media layer, bottom of media layer, and effluent channel are 17.5, 16.1, 8.4, 8.1 cm, respectively, and based on them, the average head loss for whole device and media layers were calculated as 9.4 and 7.7 cm, respectively, which are satisfying the design standard (10 cm or less for whole device, 20 cm or less for medium layer) published by Ministry of Environment of Korea, suggesting that this experimental device has a structure eligible for excellent initial reducer.
B. Characteristics of media
The physical characteristics of natural silica sand, a media applied to this device, such as material, particle diameter, configuration, specific gravity, strength, and coefficient of uniformity, are shown in Table 4.
Table 4. Physical characteristics of media
Characteristic Media 1 Media 2 Note
Material Silica sand
(for water purification)
Silica sand
(for water purification) -
Particle diameter 2~5 mm 5~10 mm -
Configuration Rich in quartz, Rigid, Homogenous natural silica sand Rich in quartz, Rigid, Homogenous natural silica sand -
Specific gravity 2.63 2.63 Over 2.5
Strength Wear rate < 3 % Wear rate < 3 % silica sand under 2 mm Replaced by that of
Porosity 42% - -
Coefficient of
uniformity < 2 < 2 -
Outside
Filling depth 40 cm 20 cm -
The average head was 16.13 and 8.1 cm for top and bottom of media layers and average head loss of media layer was 7.73 cm, and the infiltration velocity calculated based on them was 161.4 m/h, which satisfying the criteria, over two times filtration linear velocity (< 20 m/h), required in manual published by Ministry of Environment
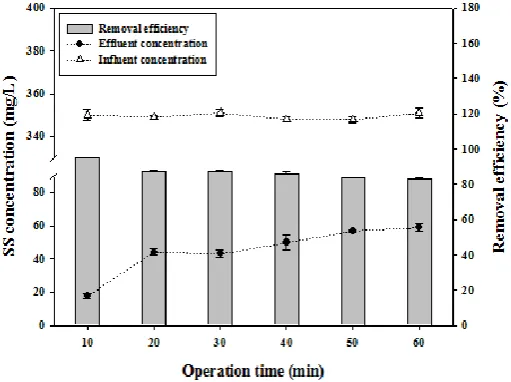
C. Removal efficiency C.1 SS Removal efficiency
The SS removal efficiency test of CYFILTER was performed three times (60 minutes for each run) based on the manual published by Ministry of Environment (SS concentration 150-350 mg/L), and the SS concentration and removal efficiency were analyzed by sampling influent and effluent every 10 minutes. The results are shown in Table 5 and Fig. 2
Table 5. SS concentration of CYFILTER influent and effluent(unit: mg/L)
No.
Average concentration
of influent
Operation time (min)
10 20 30 40 50 60
1
349.4
19 46.5 44 55.5 56 56.5
2 14.5 40.5 46 52.5 58 57
3 19.5 45.5 39 41 56.5 63
Average 17.6 44.1 43 49.6 56.8 58.8
Standard
deviation 2.7 3.2 3.6 7.6 1.0 3.6
The average SS concentration of influent was 349.4 mg/L and average(standard deviation) of SS concentration during 10, 20, 30, 40, 50, 60 minutes of operation time were 17.6(2.7), 44.1(4.2), 43.0(3.6), 49.6(7.6), 56.8(1.0), and 58.8(3.6) mg/L, respectively. The SS removal efficiencies of three operations were 86.8, 87.2, and 87.4%, being averaged to 87.1%. The analysis of SS efficiency during each time section showed that the efficiency is highest in initial 10 minutes (95.0%), and followed by 20-40 minutes section (87.4-85.8%), and 50-60 minutes section (83.8-83.2%), indicating that this device is satisfying the criteria for SS removal efficiency required by Ministry of Environment.
Figure 2. Results of SS removal test of CYFILTER
C.2 SS Head loss under various solid loading
The average head loss measured under four solid loadings was about 8 cm, satisfying the criteria, 10 cm, required by Department of Environment. The head loss, however, showed no significant difference across operation time of 80 minutes. It was speculated that the diameter of prepared sample used in this study are < 63 ㎛ (80%) and < 200㎛ (20%) (ultra-micro particles), thus they infiltrated deeply of media layer filled with sand with diameter of 2-5mm, and due to the relatively great difference in diameter between media layer and material, having no significant effects on flow of filtration water. It is considered that the developed device has proper removal efficiency without changing solid impact loading, thus excellent initial redactor for field application.
Figure 3. Results of head loss test of media layer under various solid loading
D. Restoration level by Backwashing
To investigate the restoration level of head loss by backwashing, an air washing (15 minutes, 50 m3/m2/h) and water washing (1 minute, 40 m3/m2/h) were performed after completing a head loss test under various solid loading. As mentioned above, however, no significant difference in head loss by solid loading was observed because no blocking of media occurred during four tests, and this made the investigation of the restoration level by backwashing to be difficult (the change in head loss observed after backwashing is not by accumulated solid loading but by re-arrangement of media layer in the process of backwashing). We, in response to this problem, investigated effect of backwashing based on the restored SS removal efficiency after backwashing, and the results are shown in Fig. 4.
The SS removal efficiencies measured during four tests showed highest value (95%) 10 minutes after starting operation, and began to decrease after about 20 minutes (87%), and reach 83% after 80 minutes when the operations was finished. The SS removal efficiency that had decreased down to 83% was restored up to 95% after backwashing, suggesting that backwashing condition (air washing - 15 minutes, 50 m3/m2/h, water washing - 1 minute, 40 m3/m2/h) in this study and the resultant restoration level is satisfying the design criteria required by Ministry of Environment
IV.
CONCLUSIONFor the filtration-type facility for non-point pollution, it is important to check such facilities for, during rainfall, ease in continuous inflow during rainfall, obtaining the recommended treatment efficiency, and maintaining performance after backwashing. Accordingly, the performance test of the CYFILTER developed newly was conducted based on the manual for installation and management of the facility of non-point pollution published by Ministry of Environment. Following experiments were performed to evaluate performance.
∙ Head loss of whole device under no loading.
The results of head loss test performed for 30 minutes and three times to calculate necessary difference in head and to determine the structural fitness of facility for non-point pollution. The results of the loss head test showed that average loss of head in medium layer and whole device were 7.73 and 9.40 cm, respectively, which are satisfying the design standard (10 cm or less for whole device, 20 cm or less for medium layer) published by Ministry of Environment of Korea, suggesting that this experimental device has a structure eligible for excellent initial reducer.
∙ Characteristics of applied media
The media applied to this device is filtration sand (natural silica sand), a granular media and satisfied the specification required in Water Service Facility Standard. It was found that the material was silica sand, particle diameter was 2-5 and 5-10 mm, specific gravity was 2.63. In addition, the configuration was rich in quartz, rigid, and homogenous and showed wear rate of < 3% as a strength. The porosity and coefficient of uniformity were 42% and < 2, respectively. The infiltration velocity calculated based on them was 161.4 m/h, which satisfying the criteria, over two times filtration linear velocity (< 20 m/h), required in manual published by Ministry of Environment
‧ SS removal efficiency
The results of SS removal efficiency test using influent water (average SS concentration: 349.4 mg/L) prepared based on manual published by Ministry of Environment showed that average of SS concentration during 10, 20, 30, 40, 50, 60 minutes of operation time were 17.6, 44.1, 43.0, 49.6, 56.8, and 58.8 mg/L, respectively, and average SS removal efficiency was 87.1%, indicating that this device is satisfying the criteria for SS removal efficiency required by Ministry of Environment.
‧ Head loss under various solid loading
This experiment was carried out with condition identical to that of SS removal efficiency test. This experimental device was run until the accumulated solid amount of loading reach 9.0 kg/m2 (80 minutes), and the results showed that the average head loss measured under four solid loadings was about 8 cm, satisfying the criteria, 10 cm, required by Department of Environment. The head loss, however, showed no significant difference, on which it was speculated that the prepared samples used in this study are ultra-micro particles, thus they infiltrated deeply of media layer filled with sand, leading to no significant effects on flow of filtration water. ‧ Restoration level by Backwashing
To investigate the restoration level of head loss by backwashing, this experiment was performed parallel with head loss test under various solid loading, however, no significant difference in head loss by solid loading was observed because no blocking of media occurred during four tests, and this made the investigation of the restoration level by backwashing to be difficult. The researchers, in response to this problem, investigated effect of backwashing based on the restored SS removal efficiency after backwashing, suggesting that backwashing condition (air washing - 15 minutes, 50 m3/m2/h, water washing - 1 minute, 40 m3/m2/h) in this study and the resultant restoration level is satisfying the design criteria required by Ministry of Environment
REFERENCES
[1]. Lee, M.; Park, G.; Park, M.; Park, J.; Lee, J.; Kim, S. Evaluation of non-point source pollution reduction by applying best management practices using a swat model and quickbird high resolution satellite imagery. Journal of Environmental Sciences 2010, 22, 826-833.
[4]. Carpenter, S.R.; Caraco, N.F.; Correll, D.L.; Howarth, R.W.; Sharpley, A.N.; Smith, V.H. Nonpoint pollution of surface waters with phosphorus and nitrogen. Ecological applications 1998, 8, 559-568.
[5]. Shen, Z.; Hou, X.; Li, W.; Aini, G. Relating landscape characteristics to non-point source pollution in a typical urbanized watershed in the municipality of beijing. Landscape and Urban Planning 2014, 123, 96-107.
[6]. Zhang, H.; Huang, G. Assessment of non-point source pollution using a spatial multicriteria analysis approach. Ecological Modelling 2011, 222, 313-321.
[7]. Taebi, A.; Droste, R.L. Pollution loads in urban runoff and sanitary wastewater. Science of the total environment 2004, 327, 175-184. [8]. Grunwald, S.; Norton, L. Calibration and validation of a non-point source pollution model. Agricultural Water Management 2000, 45,
17-39.
[9]. Wu, Y.; Chen, J. Investigating the effects of point source and nonpoint source pollution on the water quality of the east river (dongjiang) in south china. Ecological Indicators 2013, 32, 294-304.
[10]. Le, C.; Zha, Y.; Li, Y.; Sun, D.; Lu, H.; Yin, B. Eutrophication of lake waters in china: Cost, causes, and control. Environmental management 2010, 45, 662-668.