WWJMRD 2018; 4(8): 51-56 www.wwjmrd.com
International Journal Peer Reviewed Journal Refereed Journal Indexed Journal Impact Factor MJIF: 4.25 E-ISSN: 2454-6615
Nwosu, Chima, Daniel, Department of Educational Management and Planning, Faculty of Education University of Port Harcourt, Rivers state Nigeria
Nath.M Abraham Department of Educational Management and Planning, Faculty of Education University of Port Harcourt, Rivers state Nigeria
Okonma, Mark Chukwueloka Department of Economics, Faculty of Social Sciences, Niger Delta University, Bayelsa State Nigeria.
Correspondence: Nwosu, Chima, Daniel, Department of Educational Management and Planning, Faculty of Education University of Port Harcourt, Rivers state Nigeria
Analysis of Budgetary Allocation to Education and
the Gross Domestic Product Per Capita in Nigeria,
1980 – 2015
Nwosu, Chima, Daniel, Nath.M Abraham,
Okonma, Mark Chukwueloka
Abstract
The study investigated the Comparative Analysis of Budgetary Allocation to Education and Gross Domestic Product Per- Capita (GDPc) in Nigerian from 1980-2015. The objective of the study was to comparatively analyze the relative impact of federal government actual budgetary allocation to education alongside UNESCO 26% recommended budgetary allocation to education. In respect to the above, relevant theoretical and empirical literature were reviewed. The researcher formulated the relevant objective, research question and hypotheses to guide the study. In the course of the study, relevant data relating to the variables needed by the researcher were extracted from various document analys is such as Central Bank of Nigeria (CBN) Statistical Bulletin and National Bureau of Statistics (NBS) Statistical Bulletin. The Classical Linear Regression Model was employed in modelling the relationship between per-capita income and the budgetary allocation variables. The Ordinary Least Square (OLS) equation technique was used in analyzing the data. The unit root analysis revealed that all the variables were not stationary at levels. But at first difference, all the variables became stationary. The Johansen cointegration analysis revealed that the variables were cointegrated and had a valid error correction mechanism. The analysis of the Error Correction Mechanism (ECM) showed that all the models were significant and the estimates unbiased. The analysis further revealed that budgetary allocation to education in Nigeria has the correct signs and significantly impacted on income per-capitaIt was therefore, recommended that the government at all levels should increase their budgetary allocation to education towards the UNESCO’s 26% criteria as a strategy to fast-tract national economic development in Nigeria. Also, the study further recommended that greater percentage of the budgetary allocation to education, should be spent on capital projects.
Keywords: Comparative Analysis, Budgetary Allocation, Education, UNESCO 26%, Gross Domestic Product Per-Capita (GDPc).
Introduction
Human capital development is perceived as the main factor in attaining economic growth and development in any nation. Therefore, accessibility to high standard of education serves as a means to quality of manpower in such a nation. Education serves as an instrument through which any society can be transformed into a highly modernized society. It plays a vital role in human capital development. Therefore, it serves as a tool for the achievement of rapid economic growth and development by increasing the productive capacity of members in the society.
The budget of the Nigerian state is a governmental tool used for the implementation of policies. Despite this importance of education, the budgetary allocation to education overtime has been characterized by undue politics. Aboribor in Omotor (2004) posited that, an increase in the national income and per-capita income is a function of education and that disparities among nations can better be explained by the difference in the endowments of human rather than physical capital. (Ifionu & Nteegah, 2013).
Statement of the Problem
the problem of low income per-capita. This has negatively affected the Nations educational sector interms of accessibility to qualitative education. Every nation according to UNESCO is expected to spend 26% of its budget to education annually. Despite this UNESCO’S recommendation, it is quite unfortunate that previous studies and data has shown that the government of Nigeria has not been able to meet-up with UNESCO 26% budgetary recommendation for example, from 1977-1998, the total education budgetary allocation represented an average of 9.7% of total government expenditures (Herbert, 2002). While the percentage share, of the GDP from 1991-2009 has maintained a value of 0.85% to its highest value of 5.11% in 1981 and its lowest was 0.85% in 1991. Judging from these statistics, it is, quite clear that budgetary allocation to education is low.
Aim and Objective of the Study
To determine the effect of government actual budgetary allocation and UNESCO 26% recommended budgetary allocation to education on the Gross Domestic Product Per- capita (GDPc) of the Nigeria economy (1980-2015).
Research Question
What is the effect of government actual budgetary
allocation and UNESCO 26% recommended budgetary allocation to education on the Gross Domestic Product Per- capita (GDPc) in the Nigeria economy (1980-2015)?
Research Hypothesis
There is no significant relationship between government act ual budgetary allocation and UNESCO 26% recommended budgetary allocation to education and the Gross Domestic Product Per- capita (GDPc) in the Nigeria economy (1980-2015).
Human Capital Theory
The Human Capital Theory (HCT) was developed by Gary S. Becker in 1962. Human capital looks at the investment people make in themselves which in turn enhances their productive capacity in the economy. The theory argues that, if a country has an educated population, such a population is otherwise a productive population. The main theme of human capital theory is that the process of spending on health care, education, job search, information retrieval, migration etc. by individualsis a deliberate investment activity guided by anticipated future (Ebong, 2006). Hence human capital means the inclusion of human beings to stimulate and produce capital for their personal and the overall development of the country.
Fig 2.1: Human Capital Model: Adapted from Obasi, E. (2000). The Economics of Education in Nigeria. Mbaise: New Vision Publishers 61
Conceptual Framework
Education and Gross Domestic Product (Proxy for GDPc)
The relationship that exist between education and economic growth have been a public debate from the days of Plato till date. It is quite obvious that education has a high economic value, therefore a huge part of the nation wealth should be invested in education. Thus, investing in education will eventually lead to human capital formation and significantly contribute to economic growth, instead of investment in social and physical capital (Loaning, 2004, p.11) Yogish (2006) went further to posit that investment in education will eventually lead to returns in skilled manpower that will be geared towards developmental needs which will accelerate economic development and also improve the quality of lives in the society. This lend credence to why the theory of human capital lays emphasis on how education can increase the productive capacity, worker efficiency through an increase in the level of cognitive stock of man.
Education serves a dual purpose. It serves both as a public good and a private good. Education as private goods shows that the gains of education accrue to an individual can be ascertained through his/her future income inflows. In other words, if the public sector investment in education, such a level of investment will be equal to the growth and development of the whole society. And as such, when individuals in the society invest in education, their future income is enhanced, but the society benefits by proxy. With the aid of UNESCO Nigeria and so many other developing nations has attempted to develop their knowledge and
human capacity through the development of their citizens by ensuring they are provided with abundance and equal educational opportunities. Therefore, the link between a nations skill required for development to occur and the country’s population is “Education’.
Government needs to allocate more of its resources (budgetary Resources) to education in other for development to occur in the society. This is because a well-developed and sustained educational sector will bring about a long-term benefit to the citizens and society at large. With the present trend with on public sector investment in education, it is evident that the Nigerian educational sector is still underdeveloped. This underdevelopment can be noticed through the simple fact that the population of the country seeking for quality education far out-weighs the available schools, the schools are ill-equipped etc. therefore, the ability of the government to transfer or shift resources from sectors which are low productive; sector such as general administration to education, will go a long way to develop the educational sector in Nigeria (Oriakhi & Ameh, 2014).
Empirical Review
At the end of the study, it was discovered that Nigeria is faced with most of the problems that could limit the capacity of education expansion to stimulate economic growth and development such as brain drain regional imbalances, under employment, shortage of professionals etc.
Lawal and Waahah (2011), in another study, carried out a research on education and economic growth: The Nigeria experience. They concluded that the decision to invest in education in other to achieve economic growth rapidly is a decision made in the right direction provided that it would not reduce the quality of education and also not affect the average cost of education. This, they argued that the economy of Nigeria would benefit uneasily from an increase in public investment in education even if there is a decrease in the investment in other sectors of the economy. Ararat (2007), made an analysis on the role and impact of education on economic growth in two countries namely Ukraine and Russia. The study estimated the model of endogenous economic growth and the liner and log- linear equations that give an account for the different time lags of the impact of education (higher education) on economic growth. The findings from the study should that arise in access of population to higher educational level will positive impact on the GDP-per-capital income. This, he further explained that an increase in the number of higher educated persons will head to a sustainable economic growth.
Chude and Chude (2013) also researched on the effects of
public expenditure in education on the growth of the Nigerian economy between the period of 1977 to 2012 with reference to disaggregated and sectoral expenditure analysis. The research made use of the Ex-post factor research design and as the correction model econometric technique. The result showed that total public expenditure on education is highly and statistically positively related to economic growth in the long run. Njong (2010), researched on the role of education as a major weapon to combat poverty using data from the 2001 cameraman household survey obtainable poverty using data from the of statistics. The model used for data analysis was a sample selectivity corrected logistic regression model for estimation based on the cross sectional data. In the study the probability of an individual being poor was used as the dependent variable while the explanatory variable was a set of experience and educational levels. At the end of the study, it was revealed that educational attainment and improvement in experience reduces the probability of an employed individual being poor.
Methodology Research Design
The research design for this study is the correlational research design. While the instrument that was used for the study were various document analysis such as Central Bank of Nigeria (CBN) Statistical Bulletin (2016 Edition) and National Bureau of Statistics (NBS) Statistical Bulletin (2016 Edition).
Model Specification
GDPc = f (GREE, GCEE, UNESCO 26%) …………... (1)
They implicit model above were transformed into log linear explicit model as follows:
𝑙𝑜𝑔𝐺𝐷𝑃𝑐 = log 𝛼0+𝛼1 log 𝐺𝑅𝐸𝐸 + 𝛼2 log 𝐺𝐶𝐸𝐸 + 𝛼3 log 𝑈𝑁𝐸𝑆𝐶𝑂 26% + 𝜇1 ……… (2)
Where:
GREE is government recurrent expenditure on education GCEE is government capital expenditure on education GDPc is gross domestic product per-capita and UNESCO 26% recommended budgetary allocation.
𝛼0, is the intercept terms.
𝛼1 to𝛼3 are model parameters while the 𝜇 is the error term.
Method of Data Analysis
The model specified in equation 3.3 above was analyzed with the use of computer aided statistical software-E-view. Specifically, we used the Classical Linear Regression approach, using the Ordinary Least Square (OLS) method. The OLS method was chosen because of the statistical
properties of its estimates. The parameter estimates will be examined for significance at 0.05 level and the model explanatory power and significance will be evaluated using the R2 and f-statistic respectively
Data Presentation and Analysis
Table 4.1 Unit Root Test Result
Variable Level 1st difference 5% critical Remark
GDPC -0.7946 -5.9984* -3.5485 1(1)
GREE -3.4268 -4.5568* -3.5629 1(1)
GCEE -2.3219 -5.5158* 3.5485 1(1)
UNESCO -1.5426 -6.2627 3.5578 1(1)
Source: E-view output printout *Stationary at 1st difference
** Stationary at 2nd difference
The unit root test results presented in table 4.2 above showed that all the variables, apart from life expectancy, were not stationary at level. Life expectancy is stationary at level, meaning that its trend is deterministic; its trend can
be predicted and if disturbed from its equilibrium path, it will rebound back to the equilibrium level. After 1st
Table 4.2: Unrestricted Cointegration Rank Test (Trace)
Hypothesized No. of CE(s)
Eigenvalue Trace Statistic
0.05
Critical Value
Prob.**
None * 0.936744 198.8249 47.85613 0.0000
At most 1 * 0.881649 104.9655 29.79707 0.0000
At most 2 * 0.613661 32.40615 15.49471 0.0001
At most 3 0.002079 0.070768 3.841466 0.7902
Trace test indicates 3 cointegrating eqn(s) at the 0.05 level * denotes rejection of the hypothesis at the 0.05 level
**MacKinnon-Haug-Michelis (1999) p-values
From the cointegration result above, the gross domestic product per capita model (GDPc), the Trace statistics value indicates that there is at least three (3) co-integrating
equations. Thus, the variables in the equation have a long run equilibrium relationship: this means that the variables move together about a mean value
Error Correction Model Analysis for GDPc Model
Table 4.3: Parsimonious Ecm for Gdpc Model
Dependent Variable: D(GDPC)
Variable Coefficient Std. Error t-Statistic Prob.
D(GDPC(-1)) 0.675106 0.123610 5.461581 0.0000
D(GDPC(-2)) 0.531609 0.110860 4.795298 0.0001
D(GREE) 0.445079 0.190395 2.337661 0.0289
D(GREE(-1)) -1.704352 0.217503 -7.836006 0.0000
D(GCEE) -0.176258 0.353613 -0.498448 0.6231
D(GCEE(-1)) 1.244213 0.646327 1.925053 0.0672
D(UNESCO) -0.288845 0.172303 -1.676376 0.1078
D(UNESCO(-1)) -0.181968 0.087024 -2.091018 0.0483
D(UNESCO(-2)) 0.083507 0.153204 0.545070 0.5912
ECM(-1) -1.599028 0.131788 -12.13333 0.0000
C 13635.86 5501.637 2.478509 0.0213
R-squared 0.916003
F-statistic 23.99132
Prob(F-statistic) 0.000000
Table 4.4: Diagnostic Analysis of GDPc Model
Test/Hypothesis Test Type Test statistics Prob Remark
Residual normality Jacque-Bera (JB) 0…. … Accepted
Serial correlation Brusch-Godfrey(BG) 5.6386 0.0596 Rejected
Heterosedasticity Brcusch-Pagan 8.7655 0.5545 Rejected
Stability test for GDPc Model
The test statistics for this parameter is the commutative residual sum. Commonly called the cusum test figure 4.1 shows the plot of the residual sum
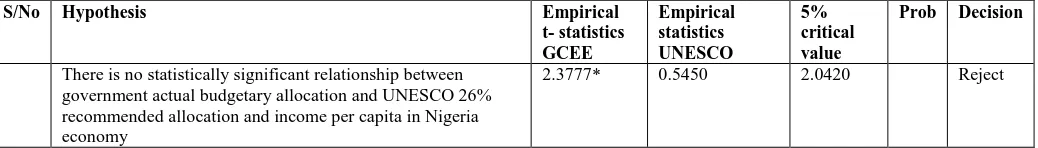
Table 4.5: Test of Hypothesis
S/No Hypothesis Empirical
t- statistics GCEE
Empirical statistics UNESCO
5% critical value
Prob Decision
There is no statistically significant relationship between government actual budgetary allocation and UNESCO 26% recommended allocation and income per capita in Nigeria economy
2.3777* 0.5450 2.0420 Reject
Based on these criteria, it is evident that government budgetary allocation on education and UNESCO recommended 26% has significant impact on income per capita. This is in conformity with the findings of Bello and Roslan (2010). In a nutshell, the analysis of our empirical data has revealed that if Nigeria had used the UNESCO’s recommended budgetary allocation to education we would have been impacting more on the evils of underdevelopment than Nigeria is currently doing. Again the analysis showed that government budgetary allocation on education has significant impact on income per capita.
Comparative Result
This section compares the impact of the various independent variables on the dependent variable. Specifically, we compare the impact of UNESCO variables GCEE and GREE on the various development indicators
Table 4.6: Comparative impact of GREE, GCEE and UNESCO criteria on Gross Domestic Product per- capita (GDPc
Development indicator Variable Gdpc
GREE 0.445
GCEE 1.244
UNESCO 0.084
The table above shows the impact of GREE, GCEE and UNESCO on GDPc. The result shows that apart from impact on GDPc, the UNESCO criteria variable impact more on GDPc. If we have been using the UNESCO criteria, we would have been impacting more on the chief evils of underdevelopment. So, by comparison, the UNESCO criteria would have developed Nigeria more than we are developing currently
Discussion of Findings (Empirical Result)
The effect of government actual budgetary allocation and UNESCO 26% recommended budgetary allocation to education and the Gross Domestic Product per- capita (GDPc) in the Nigerian economy (1980-2015). This model (equation 2) in chapter three, examined the impact of government recurrent expenditure (GREE), government capital expenditure on education (GCEE) and the UNESCO 26% recommended on the GDP per capital growth rate in Nigerian economy. The results of the empirical analysis in table 4.2 showed that there is a positive relationship among GDP per capita, GCEE, GREE and the UNESCO 26% recommendation. Specially, change in government expenditure on education will lead to change in per capital income growth rate in the same direction. During the period under review, increase in government recurrent expenditure on education by 1% led to increase in economic growth (GDP per capital growth) by 0.45% within one year. The impact is significant at 0.05 levels. The impact of government capital expenditure on education on per capita income growth is positive. Thus, change in
government capital expenditure on education will lead to change in per capita income in the same direction. In this case, increase in capital expenditure on education by 1% led to increase in per capita income by 1.24% after one-year lag, or what is the same one fiscal one-year lag. The effect was not significant at 0.05 level.
If budgetary allocation had followed the UNESCO’s 26% recommendation, the effect would be also positive on economic. Specially, if the UNESCO’s approach had been used, the impact on GDPc growth would have been 0.08% after two 2 years lag. The variable was not significant.The model R2 value was 0.91600. This means that the three
variables (GCEE, GREE, and UNESCO) accounted for about 92% variable in the level of GDP per capita growth rate during the period under review.
The model F-statistic value of 23.9913 with probably value of 0.0000 means that the model employed for the empirical analysis was significant and actually captured the relationship among the variables in Nigerian economy. The model diagnostic result presented in table 4.4 showed that there was no evidence of serial correlation, there was no evidence of heterosedasticity, and the residuals were normally distributed. Hence, the data fulfilled the basic assumptions for the use of the method employed for the empirical analysis, and the estimates parameter dependable as policy variables.
The model stability test result presented as plot of cumulative sum (CUMSUM) of residual in figure 4.1 revealed that the relationship among the variables was stable during the period of the study. This, again, reinforce the values of the empirical estimates as policy variables. The residual plot remained within the 5% critical level throughout the period of the analysis.
Discussion of Findings
The results of the data analysis revealed that all the variables were not stationary at levels. However, GDPc, GREE, GCEE and UNESCO became stationary after 1st
differencing. The results of the Johansen (1998) cointegration test revealed that there were at least two cointegrating equation among variables. Thus, there was a stable long run relationship among the variables of the models in each equation.
The estimate of the parsimonious error correction model (ECM) of the equation revealed that the model was statistically significant. The model diagnostic analysis showed that the entire model fulfilled the assumptions of the ordinary least square (OLS) regression techniques, and that there was no incidence of serial correlation, Heteroseedasticity, and the residual were normally distributed. Following the Guass Markov theorem, the estimates are Best Liner Unbiased Efficient (BLUE) estimators and therefore dependable for forecasting and as policy variables.
relationship between GREE, GCEE and the UNESCO’s recommended budgetary allocation to education and economic growth. Increase in GREE, and GCEE led to increase in per capita income by 0.45% and 1.24% respectively. While that of GREE was within the same fiscal period that of GCEE was after one period lag. The impact of the UNESCO’s recommended expenditure criteria was 0.08% after two periods. While GCEE and the UNESCO’s recommended criteria were insignificant. GREE was significant. The GDPc model has f-statistic of 23.99% and R2 value of 0.9160. Thus, the model was
statistically significant and accounted for about 92% variation of change in GDPC.
Conclusions
The study compared the relative impact of federal government budgetary allocation to education and UNESCO recommended 26% budgetary allocation to the education sector. In order to achieve the research objectives, the researcher employed econometrics method to analyze the data. The results of the data analysis showed that government expenditure on education and the UNESCO recommended criteria have positive impact on income per capita.
Increase in budgetary allocation to education, especially, the use of the UNESCO recommended budgetary allocation to education will accelerate the pace of economic growth in Nigeria economy. The impact coefficient of the UNESCO 26% recommended budgetary allocation was always higher than the impact coefficient of the government recurrent and capital expenditure on education. The impact of the UNESCO 26% recommended budgetary allocation on income per capita is small but positive if Nigerian government will take the issue of education seriously and acknowledge the fact that development and economic growth issues have gone beyond mere acquisition of capital to the issues of human development and technology, and put appropriate infrastructure in place, especially, education infrastructure, Nigerian economy will experience quantum leap in increase in the level of per capita income.
Recommendations
1. Government at all level should implement the UNESCO 26% recommended budgetary allocation to education for investment in the education sector. a. Budgetary allocation to education sector should always
be monitored to ensure that the budgetary allocation are released as at when due, effectively and efficiently utilized.
b. Greater percentage of the budgetary allocation to education should be spent on capital project in the education sector.
References
1. Aboribo, R. (1999). University Funding and Development in Nigeria, (pp 576) in A. Omotor, (2004). Federal Government Expenditure in Education.Abraka Journal of Social Sciences, 9(2), 105-11
2. Ararat, O. (2007). Role of Education in Economic Growth in the Russian federation and Ukraine.Retrieved from http://mpra.ub.uni-muenchen.de/7590.1 January, 2007
3. Chude N.K. &Chuded.I (2013).Impact of Government
expenditure on economic growth in
Nigeria.International Journal of Business
Management. 1(4):64-71.
4. Ebong, J. M. (2006). Understanding economics of
education.EagleLithograph Press, Port Harcourt.
5. Ifionu, E. B. &Ntaagah, A. (2013).Investment in education and economic growth in Nigeria, 1981 – 2012.West African Journal of Industrial and Academic
Research, 9(1), 155 – 172.
6. Loeing, J. L. (2004). Human capital, technology diffusion and economic growth in low-to-middle income country: A time series perspective of Guatamela. Applied Econometrics and International Development. Euro-American of Economic
Development, 4, (3), 5-6.
7. Nurudeen A. & Usman, N. (2010).Government Expenditure and Economic Growth in Nigeria, 1970-2008: a Disaggregated Analysis. Business and
Economic Journal 4,1-11.
8. Njong, A.M. (2000). The effects of educational attainment on poverty reduction in Cameroon.Journal
of Education Administration and Policy Studies, 2 (1),
001-008.
9. Olaniyan & Okemakinde (2008). Human Capital Theory: Implications on Educational Development.
European Journal for Scientific Research, 5(2),16-18.
10. Oriakhi, D. E. & Ameh, G. (2014). Government expenditure and their development of the education sector in Nigeria. An Evaluation Review of Public
Administration and Management, 3(5), 147 – 160.