Page 133 www.ijiras.com | Email: [email protected]
Performance Of Credit Guarantee Scheme For Micro And Small
Enterprises In North East India
Raju Das
Research Scholar, Dept of Commerce, NEHU, Shillong, Meghalaya
I. INTRODUCTION
Micro and Small sector enterprises have a multi-dimensional role in the economic growth of a developing nation like India. India is a developing country and emerging as a largest global market in the world. Since 1991 the government has taken many initiatives for the growth and development of MSMEs but still MSMEs are struggling to survive in a competitive environment. It is, therefore, imperative to focus on the issues which impact the creation, survival and growth of the firms in this sector. One of the major obstacles in the growth of MSEs is the credit constraints. Credit Guarantee Schemes (CGS) is globally accepted as an instrument of credit flow to ease financial constraints for MSEs without any secondary collateral / third party guarantee. In India, with large efforts by RBI, the CGS came into existence in August 2001. Credit Guarantee Fund Scheme for Small Industries (CGTSI) was established with
collateral free credit limits upto Rs. 25 lakh jointly by the Government of India and Small Industries Development Bank of India (SIDBI). After MSMEs Act 2006, the scheme was renamed as Credit Guarantee Fund Trust for Micro and Small Enterprises in India (CGTMSE) with the credit limit upto Rs.50 lakh. Later Credit Guarantee Scheme (CGS) coverage extended from Rs. 50 lakhs to Rs. 100 lakhs with the introduction of Economic Stimulus Package announced by Government of India on December 07, 2008. At the end of March 31, 2015, 133 eligible financial institutions (27 Public sector banks, 20 Private sector banks, 4 foreign banks, 73 Regional rural banks and 9 Lending Institutions) registered as Member Lending Institutions (MLIs) of CGTMSE. Regional Rural Banks registered as a highest numbers (55%) out of 133 MLIs. Wherever, the services of RRBs are not available in the states like Delhi, Goa, Sikkim and all the Union Territories. Scheduled commercial banks (top performer) automatically Abstract: Micro and Small sector enterprises have a multi-dimensional role in the economic growth of a developing nation like India. In the overall value chain of different industries these firms are placed in critical positions. One of the major obstacles in the growth of MSEs is the credit constraints. Credit Guarantee Schemes (CGS) is globally accepted as an instrument of credit flow to ease financial constraints for MSEs without any secondary collateral / third party guarantee. Government of India (GOI), Small Industrial development Bank of India (SIDBI) and Ministry of MSME set up Credit Guarantee Fund Trust for Micro and small Enterprises in 2000-01. As per the report of the RBI (2010), the CGTMSE coverage out of total MSE’s borrowal accounts at the end of March 2009 is very low (2.64%) in India. North East found as under-served areas for CGTMSE coverage (Annual Report of SIDBI, 2011-12). Therefore, an attempt has been made to study the overall performance of credit guarantee scheme in North East India and to evaluate the CGTMSE coverage by Regional Rural Bank in North East India. The study is analytical and descriptive in nature and based on secondary data only. It is concluded that the overall performance of the CGTMSE in North East India is very poor and the progress rate is not constant whereas Assam registered higher CGTMSE coverage among the other states in North East. Assam Gramin Vikash Bank is only RRB in North East who registered higher growth rate in CGTMSE coverage.
Page 134 www.ijiras.com | Email: [email protected]
extend the benefit of the CGS through their respective branch jurisdiction in NE India.
Given the natural, forest, demographic and socio cultural resources of the region the efforts to provide credit facility to the existing and potential entrepreneurs is not only undermined (Goswami & Borolo, 2012) but also attributable to lower degree of industrialization in the entire region. The North East States are surrounded by China, Bangladesh, Myanmar, Nepal and Bhutan. In fact, the region has long international border, which is 99 percent of its total geographical boundary. In spite of resource fullness the entire region is regarded as underdeveloped and backward area. In this age of globalization and increased international cooperation, however, the border areas also signify some new opportunities (Dibrugarh University, 2009). With these natural resources and opportunities, a prospect of entrepreneurship development in North-East India is very high (Ram, Singh and Prasad, 2012). With the different prospects and opportunities of industrialization, credit service and sufficient number of MLIs, the north east region is regarded as the appropriate study area, if one has to study the performance of CGTMSE.
II. REVIEW OF LITERATURES
Access to bank finance is a major issue and challenge for SMEs. Before granting credit, bank finds difficult to classify „good‟ and „bad‟ borrowers due to informational asymmetries. As a solution to this problem credit guarantee scheme may be an effective step towards access to finance without collateral security and consistent financial information (Mazanai & Fatoki, 2012). Keasey & McGuinness, (1990) found, using univariate statistics and correlation matrix, the rate of return to be high for the firm using bank loan than other sources of finance, though bank loan is expensive comparatively and on the other hand bank only provides loan to higher return enjoying firms. Conducting a study on 74 developed and developing countries using baseline regression for country level data on banks and firms, Beck, Demirguc-kunt & Maksimovic (2004) found that the financial obstacles not only vary across the firms within a country but also vary across the countries. Steijvers, Voordeckers & Vanhoof (2010) in their study found that business collateral is sufficient for bank credit than personal collateral in family business. The empirical results found by Carpenter and Petersen (2002) support that the growth of the small firms is constrained by the internal finance. To reduce the financing gap in SMEs, the promotion of the mutual guarantee may be used as a measure (Hughes, 1997). A credit guarantee scheme is designed to operate within the formal financial system where the Guarantee given to a bank acts as an incentive to lend to enterprises that would otherwise not have been funded (Mthimkhulu & Aziakpono, 2012).
The CGS is recognized as a vital part of the SMEs all over the world (Tunahan & Dizkirici, 2012). Because credit guarantee scheme encouraged the better performance of SMEs. Guaranteed entrepreneurs have developed and expanded into many different types of business (Devinaga& Tan, 2012). Public supported entrepreneurs with good idea and well managed projects materialized higher return than the
groups of the companies with long term external financing without public support. On the other hand the public supported groups of companies gained in terms of operating margin, value added per employee and turnovers. Therefore public support is relevant at economic, financial and business efficiency level (Garcia-Tabuenca&Crespo-Espert, 2010). The study, by using data set of 6888 Kafalat loan guarantee applications from 2000 to 2009, reveals that repeated customers are continuously increasing their loan size and simultaneously resulting their expansion of the business activities with a better financial position to borrow bigger loan (Canaan, 2011). On the other hand Oh, Lee, heshmati and Choi, (2009), by using propensity score matching model, have compared the performances of guaranteed and non-guaranteed firms which infer that the guaranteed firms are better performers in terms of growth in sales, employment, wages level and survival rate. Propensity score estimations of the effectiveness of CGS confirm that CGS users have a good effect of loan availability than non-users (Uesugi, Sakai & Yamashiro, 2008).
Meghalaya Rural Bank is utilizing efficiently the resources that they mobilized and which results higher productivity of Meghalaya rural bank than the productivity of RRBs in North Eastern Region (Ahmed, 2014). The rapid expansion of RRB has helped to increase banking facilities in India. The effort of RRB in terms of branch expansion, deposit mobilization, rural development and credit deployment in weaker section of rural areas has improved significantly. Impact of investment is positive on profit making RRBs and operating expenses affect negatively on both profit making RRBs and loss making RRBs. Loan and advances implies impact on the financial health of the profit making RRBs only (Misra, 2006).
III. RESEARCH PROBLEMS
Page 135 www.ijiras.com | Email: [email protected]
Scheme in North East India and to evaluate the performance of RRBs (MLIs) in terms CGTMSE coverage in North East India.
IV. OBJECTIVES OF THE STUDY
The objectives of the study are to assess the overall performance of the Credit Guarantee Scheme in North East India and evaluate the performance of Regional Rural Banks in terms of CGTMSE coverage in North East India.
V. RESEARCH METHODOLOGY
The study is analytical and descriptive based on secondary data which are collected from CGTMSE Annual Report, SIDBI Annual Report, RRBs Annual Report, Reports of Reserve Bank of India, relevant sources and websites. Data are analyzed by tabular form and percentage methods at least for ten years upto 2014-2015. The study includes all the states and all the Regional Rural Banks (MLI) in North East India. The year wise and state wise progress of RRBs and CGTMSE has been analyzed in different possible way to show the present status of the credit guarantee scheme in North East India.
VI. ANALYSIS OF THE STUDY
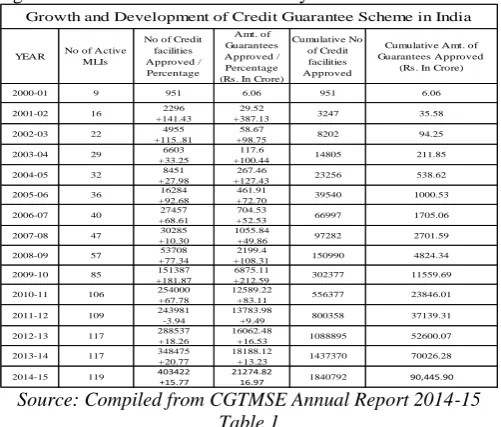
Table No-1 interpret that initially there was 9 (nine) active MLIs registered and it is increased to 119 by 2014-15. The amount of guarantee coverage increased continuously at increasing rate with the increasing number of approved proposals. In 2011-12, the number of proposals decreased by 3.94% but the amount of coverage is increased by 9.49. It is found that in the last 15 years of service, the CGTMSE registered remarkable achievements by 2014-15.
YEAR No of Active MLIs
No of Credit facilities Approved / Percentage Amt. of Guarantees Approved / Percentage (Rs . In Crore)
Cumulative No of Credit facilities Approved
Cumulative Amt. of Guarantees Approved
(Rs . In Crore)
2000-01 9 951 6.06 951 6.06
2001-02 16 2296 +141.43
29.52
+387.13 3247 35.58 2002-03 22 4955
+115..81
58.67
+98.75 8202 94.25
2003-04 29 6603 +33.25
117.6
+100.44 14805 211.85
2004-05 32 8451 +27.98
267.46
+127.43 23256 538.62
2005-06 36 16284 +92.68
461.91
+72.70 39540 1000.53
2006-07 40 27457 +68.61
704.53
+52.53 66997 1705.06
2007-08 47 30285 +10.30
1055.84
+49.86 97282 2701.59
2008-09 57 53708 +77.34
2199.4
+108.31 150990 4824.34
2009-10 85 151387 +181.87
6875.11
+212.59 302377 11559.69
2010-11 106 254000 +67.78
12589.22
+83.11 556377 23846.01
2011-12 109 243981 -3.94
13783.98
+9.49 800358 37139.31
2012-13 117 288537 +18.26
16062.48
+16.53 1088895 52600.07
2013-14 117 348475 +20.77
18188.12
+13.23 1437370 70026.28
2014-15 119 403422
+15.77
21274.82
16.97 1840792 90,445.90
Growth and Development of Credit Guarantee Scheme in India
Source: Compiled from CGTMSE Annual Report 2014-15 Table 1
Table No-2 shows that North East India contributes 5.45% in terms of number of approved proposals and 3.95% in terms of amount of the guarantees coverage by 2014-15. Only
Assam registered highest CGTMSE coverage in North East India by 2014-15 and all other states registered less than 0.45%.
Proposals(%) Guarantees(%)
Arunachal Pradesh 4456 21792.40 0.25 0.24 Assam 68339 234792.03 3.76 2.60 Manipur 4587 14094.19 0.25 0.16 Meghalaya 5943 28087.92 0.33 0.31 Mizoram 2788 11110.20 0.15 0.12 Nagaland 3442 13507.92 0.19 0.15 Sikkim 1462 5771.11 0.08 0.06 Tripura 7923 28239.82 0.44 0.31 NORTH EAST INDIA
(GROSS FIGURE) 98940 357395.59 5.45 3.95 India 1817245 9044590.58 100 100
STATE WISE PERFORMANCE OF CGS IN NORTH EAST INDIA FROM 2000-01 TO 2014-15
North East India Proposals Approved Amount in numbers
Guarantees Coverage Rs. In Lakh
Share of N E state in India
Source: Compiled from CGTMSE Annual Report and report downloaded (http://www.indiastat.com)
Table 2
Table No-3 represents the year wise share of North East India out of total CGTMSE coverage in India from 2006-07 to 2014-15. The total coverage of credit guarantee scheme in north East India falls from 2005-06 to 2009-10 and again it started to rise from 2009-10 to 2013-14 and again falls in 2014-15. It is concluded that the overall progress of North East is not consistent over the year and it is very slow and low in comparison to India.
NUMBER OF PROPOSALS APPROVED
AMOUNT OF GUARANT EES
(Rs. In Crore)
NUMBER OF PROPOSALS APPROVED
GUARANT EE COVERED (Rs. In Crore)
PROPOSAL (%) GUARANT EE (%)
2005-06 554 9.40 16284 461.91 3.40 2.04
2006-07 1934 33.92 27457 704.53 7.04 4.81 2007-08 1332 33.47 30285 1055.84 4.40 3.17
2008-09 1562 39.8 53708 2199.4 2.90 1.81
2009-10 4415 135.84 151387 6875.11 2.92 1.97 2010-11 12737 416.43 254000 12589.22 5.01 3.31 2011-12 16967 631.03 243981 13783.98 6.95 4.58 2012-13 15673 655.44 288537 16062.48 5.43 4.08 2013-14 21665 851.14 348475 18188.12 6.21 4.68 2014-15 21926 779.60 403422 21274.82 5.44 3.66 Year Wise Performance of Credit Guarantee Scheme in North East India
YEAR
NORTH EAST INDIA INDIA SHARE OF NE in INDIA
Source: Compiled from CGTMSE Annual Report and report downloaded (http://www.indiastat.com) Table 3 Number of Proposals Approved Amount of Guarantees (Rs. In Lakh)
Number of Proposals Approved
Amount of Guarantees (Rs. In Lakh)
Number of Proposals Approved
Amount of Guarantees (Rs. In Lakh)
Number of Proposals Approved
Amount of Guarantees (Rs. In Lakh)
Number of Proposals Approved
Amount of Guarantees (Rs. In Lakh)
Number of Proposals Approved
Amount of Guarantees (Rs. In Lakh)
Number of Proposals Approved
Amount of Guarantees (Rs. In Lakh)
Number of Proposals Approved
Amount of Guarantees (Rs. In Lakh)
Number of Proposals Approved
Amount of Guarantees (Rs. In Lakh)
Number of Proposals Approved
Amount of Guarantees (Rs. In Lakh) Arunachal
Pradesh 22 17.1 105 +377.27 110.71 +547.43 31 -70.48 79.03 -28.62 45 +45.16 73.7 -6.74 154 +242.22 730.46 +891.13 374 +142.86 1704 +133.28 574 +53.48 2709.85 +59.02 583 +1.57 3921.87 +44.73 820 +40.65 5119.72 +30.54 1749 +113.29 7375.51 +44.06
Assam 356 660.86 1252 +251.69 2147.52 +224.96 943 -24.68 2543.9 +18.46 1129 +19.72 2851.75 +12.10 3411 +202.13 9863.81 +245.88 9520 +179.10 29544.08 +199.52 12070 +26.79 41580.12 +40.74 10656 -11.71 39634.86 -4.68 14476 +35.85 55903.57 +41.05 14405 -0.49 51228.96 -8.36
Manipur 48 59.23 24 -50.00 53.76 -9.24 1 -95.83 1.97 -96.33 18 +1700 50.47 +2461.93 8 -55.55 19.79 -60.79 166 +1975 437.66 +2111.47 394 +137 1705.85 +289.77 712 +44.66 3444 +101.89 1798 +152.53 5140 +49.25 1389 -22.75 3144.3 -38.83
Meghalaya 12 74.55 226 +1783.33 541.95 +626.96 66 -70.80 143.23 -73.57 130 +96.97 307.33 +114.57 385 +196.15 1293.62 +320.92 973 +152.73 3869.32 +199.11 1070 +9.97 5766.33 +49.02 909 -15.05 5636.51 -2.25 1168 +28.49 6208.77 +10.15 1000 -14.38 4321.33 -30.40
Mizoram 41 45.85 189 +360.98 287.74 +527.57 67 -64.55 193.31 -32.82 53 -20.90 117.43 -39.25 26 -50.94 150.35 +28.03 148 +469.23 539.35 +258.73 361 +143.92 1558.21 +188.90 401 +11.08 2027.16 +30.10 785 +95.76 3487.13 +72.02 717 -8.66 2729.05 -27.78 Nagaland 8 10.58 44
+450.00 75.58 +614.37 65 +47.73 139.55 +84.64 112 +72.30 289.35 +107.35 54 -51.79 192.9 -33.33 163 +201.85 1013.48 +425.39 534 +227.61 2328.69 +129.77 454 -14.98 2983.61 +28.12 749 +64.98 2849.51 -4.50 1251 +67.02 3545.79 +24.44 Sikkim 14 39.54 21
+50.00 51.13 +29.31 42 +100 91.55 +79.05 15 -64.285 38.86 -57.55 113 +653.33 408.4 +950.95 178 +57.52 949.32 +132.45 128 -28.09 676.02 -28.79 343 +167.97 1186.75 +75.55 280 -18.37 881.42 -25.73 304 +8.57 1366.78 +55.07 Tripura 43 32.37 73
+69.77 123.99 +283.04 117 +60.27 155.27 +25.23 60 -48.72 251.9 +62.23 264 +340 925.47 +269.40 1215 +360.22 3586.62 +287.55 1836 +51.11 6778.04 +88.98 1615 -12.03 6709.68 -1.01 1589 -1.61 5523.95 -17.67 1111 -30.08 4248.29 -23.09 Total 544 940.08 1934
+255.51 3392.38 +260.86 1332 -31.13 3347 -1.31 1562 +17.27 3980.79 +18.91 4415 +182.65 13584.80 +241.26 12737 +188.49 41643.83 +206.55 16967 +33.21 63103.11 +51.53 15673 -7.63 65544.4 +3.87 21665 +38.23 85114.07 +29.86 21926 +1.20 77960.01 -8.41 Growth and Development of the Credit Guarantee Scheme in North East India
2014-15 2005-06
NORTH EAST STATE
2007-08 2008-09 2011-12 2012-13 2013-14 2006-07 2009-10 2010-11
Source: Compiled from CGTMSE Annual Report and Report downloaded (http://www.indiastat.com)
Table 4
Page 136 www.ijiras.com | Email: [email protected]
improvements and Mizoram and Sikkim found deprovement in CGTMSE coverage. In 2009-10, CGTMSE coverage increases in Arunachal Assam, Meghalaya, Sikkim and Tripura and decreases in Manipur and Nagaland. In 2010-11, all the North East States maintain progress rate simultaneously. The same situation continued in 2011-12 except Sikkim. In 2012-13, CGTMSE coverage rises in Arunachal Pradesh, Manipur, Mizoram and Sikkim against falls in Assam, Meghalaya and Tripura. Again in 2013-14, CGTMSE coverage increases in all the state except Sikkim and Tripura. Finally in 2014-15, only Arunachal Pradesh, Nagaland and Sikkim found positive results. In spite of all the above coverage, the north east state experienced the CGTMSE coverage differently in the year 2007-08, 2008-09, 2009-10 and 2012-13 where the number of proposals decreases against the increases in the amount of coverage in the state of Assam, Tripura, Mizoram and Nagaland respectively and vise-versa in the state of Arunachal Pradesh in 2008-09 and Nagaland in 2013-14.
Table-5 reflects the performance of CGTSE coverage of the Regional rural banks operates in NER. Assam Gramin Vikash Bank (AGVB), Langpi Dehangi Rural Bank (LDRB), Meghalaya Rural Bank (MRB), Mizoram Rural Bank (MRB) and Tripura Gramin Bank (TGB) are MLIs out of eight RRBs operating in North East India. However Arunachal Pradesh Gramin Bank (APGB), Manipur Rural Bank (MRB) and Nagaland Rural Bank (NRB) are not yet registered as MLIs. AGVB started CGTMSE coverage early in 2008-09 than any other RRBs from north east. The rate of CGTMSE coverage of AGVB increases from 2008-09 to 2014-15 except in the year 2012-13 and 2014-15. LDRB has positive performance in 2011-12 and 2012-13 and negative performance in 2013-14 and 2014-15. In 2011-12, the number of proposals of MRB and TRB increases against the decreases in the amount of CGTMSE coverage. Again in 2012-13, the number of proposals decreases in MRB against the increases in the amount of CGTMSE coverage. The CGTMSE coverage of MRB increases in 2013-14 and reaches zero level in 2014-15. The rate of CGTMSE coverage of TRB increases in 2012-13 and come down to zero from 2013-14 to 2014-15. It is found that there is very pathetic condition of CGTMSE coverage by all RRBs in 2014-15.
Number of Proposals Approved
Amount of Guarantees
Number of Proposals Approved
Amount of Guarantees
Number of Proposals Approved
Amount of Guarantees
Number of Proposals Approved
Amount of Guarantees
Number of Proposals Approved
Amount of Guarantees
Number of Proposals Approved
Amount of Guarantees
Number of Proposals Approved
Amount of Guarantees
Proposals Approved
Amount of Guarantees
Proposals Approved
Amount of Guarantees
Proposals Approved
Amount of Guarantees
ProposalsA pproved
Amount of Guarantees 2005-06 NA NA NA NA NA NA NA NA 356 660.86 41 45.85 43 32.37 0 0 0 0 0 0 0 0 2006-07 NA NA NA NA NA NA NA NA 1252 2147.52 189 287.74 73 123.99 0 0 0 0 0 0 0 0 2007-08 NA NA NA NA NA NA NA NA 943 2543.90 67 193.31 117 155.27 0 0 0 0 0 0 0 0 2008-09 4 17.67 NA NA NA NA NA NA 1129 2851.75 53 117.43 60 251.90 0.35 0.62 0 0 0 0 0 0 2009-10 94
+2250.00 465.48
+2534.30 NA NA NA NA 43 283.00 3411 9863.81 26 150.35 264 925.47 2.76 4.72 0 0 0 0 16.29 30.58 2010-11 1679
+1686.17 4148.27
+791.18 127 268.49 87 315.90 114 +165.12
259.36
-8.35 9520 29544.08 148 539.35 1215 3586.62 17.64 14.04 1.33 0.91 58.78 58.57 9.38 7.23 2011-12 2145
+27.75 5712.99 +37.72
151 +18.90
278 +3.54
127 +45.98
214 -32.26
117 +2.63
207.53
-35.63 12070 41580.12 361 1558.21 1836 6778.04 17.77 13.74 1.25 0.67 35.18 13.73 6.37 3.06 2012-13 2084
-2.84 4918.7 -13.90
196 +29.80
413.2 +48.63
61 -51.97
222.9 +4.16
162 +38.46
299.95
+44.53 10656 39634.90 401 2027.16 1615 6709.68 19.55 12.41 1.84 1.04 15.21 11 10 4.47 2013-14 2471
+18.57 5097.65 +3.64
61 -68.88
122.06 -70.46
148 +142.62
480.13 +115.40
53 -67.28
99.45
-66.84 14476 55903.57 785 3487.13 1589 5523.95 17.7 9.19 0.42 0.22 18.85 13.77 3.34 1.8 2014-15 7
-99.72 11.81 -99.77
3 -95.08
15.85 -87.01
0 -100.00
0 -100.00
0 -100.00
0
-100.00 14405 51228.96 717 2729.05 1111 4248.29 0.05 0.02 0.02 0.03 0 0 0 0
Gross Total 8484 20372.57 533 1097.60 423 1232.93 489 1149.29 68218 235959.47 2788 11135.58 7923 28335.58 12.44 8.63 0.79 0.47 15.17 11.07 6.17 4.06
CGTMSE Coverage by Regional Rural Banks in North East India
ALL MLIs ASSAM MIZORAM TRIPURA ASSAM
SHARE OF RRBs (MLIs) OPERATING IN NORTH EAST INDIA SHARE IN PERCENTAGE
YEAR
(Rs. In Lakh) (Rs. In lakh) CGTMSE COVERAGE OF RRBs (MLI) OPERATING IN NORTH EAST INDIA
AGVB LDRB MRB TGB ASSAM MIZORAM TRIPURA
CGTMSE COVERAGE OF ALL MLIs OPERATING IN NORTH EAST INDIA ALL MLIs ALL MLIs
TRIPURA AGVB LDRB MRB TGB
MIZORAM
Source: Compiled from CGTMSE & RRBs Annual Report and Report downloaded (http://www.indiastat.com)
Table 5
VII. CONCLUSIONS
In the last 15 years, the scheme registered a higher percentage of growth in CGTMSE coverage as a whole but the coverage is very poor in North East India. However this study is remain silent about the percentage of CGTMSE coverage to the total MSEs listed in the priority sector lending by banks. Meghalaya Rural bank has not yet taken part in CGTMSE coverage though it is registered as MLI. The share of CGTMSE coverage by RRBs is very poor in north east India. This rate of CGTMSE coverage would have been more in North East India if all RRBs had been taken part in CGTMSE coverage actively. Assam registered a higher percentage of CGTMSE coverage in North East India. On the other hand Assam Gramin Vikash Bank registered a higher percentage of CGTMSE coverage amongst all the RRBs in North East India. Even 15 years after implementing the scheme, north eastern parts of India (except Assam) is almost absent from the benefits of the Credit Guarantee Scheme. So it is suggested that all MLIs should come forward to use Credit Guarantee Scheme widely and bank level awareness program should be conducted to create more and more awareness amongst the entrepreneurs about the benefits and utility of the CGS.
REFERENCES
[1] Ahmed, J. U. (2014). Productivity analysis of Rural Banks in India: A case of Meghalaya Rural Bank, The NEHU Journal, Vol XII (1), 53-76.
[2] Beck, T., Demirguc - kunt, A., & Maksimovic, V. (2004). Bank Competition and Access to Finance: International Evidence, Journal of Money, Credit and Banking, Vol.36 (2/3), 627-648.
[3] Canaan, S.P. (2011). The determinants of Expansion of SME under a partial credit guarantee scheme: Case of Lebanon, working paper no 624, Economic Research Forum, Egypt.
[4] Carpenter, E.R., & Peterson, C.B. (2002). Is the growth of small firms constrained by internal finance? The Review of Economics and Statistics, 84(2), 298-309.
[5] Chakrabarty, D. K. (2012). Draft Report of the committee to examine the RBI’s Proposal regarding modifications in existing definition of sick MSEs and procedure for assessing viability of sick MSEs. New Delhi: MSME. [6] Devinaga, R., & Tan, T. M. (2012). Review of Credit
Guarantee Corporation Malaysia (CGCM) Initiatives to Enhance Small and Medium Enterprises Performance,
International Journal of Business and Management,
20,101-111.
[7] Department of Economics. (2009). Problems of border areas in North East India: Implications for the thirteenth finance commission, Dibrugarh University, Retrieved on August 17, 2015 from
http://fincomindia.nic.in/writereaddata%5Chtml_en_files %5Coldcommission_html/fincom13/discussion/report14. pdf
Page 137 www.ijiras.com | Email: [email protected]
[9] Goswami, J., & Bordoloi, G. (2012). Assam Financial Corporation and Industrial Development in Assam,
SEDME, 39.4, 99-108.
[10] Hughes, A. (1997). Finance for SMEs: A U. K. Perspective, Small Business Economics, 9(2), 151-166. [11] Keasey, K. & McGuinness, P. (1990). Small New Firms
and the Return to Alternative sources of Finance, Small Business Economics, 2(3), 213-222.
[12] Mazanai, M. & Fatoki, O. (2012). Access to finance in the SME Sector: A South African Perspective, Asian Journal of Business Management 4(1), 58-67.
[13] Misra, B. S. (2006). The Performance of Regional Rural Banks (RRBs) in India: Has Past Anything to Suggest for Future? Reserve Bank of India occasional papers, summer and monsoon, 27(1&2), 89-118.
[14] Mthimkhulu, A. M., & Aziakpono, M. J. (2012). Do Credit Guarantee Schemes address credit market failures for small businesses? Preliminary evidence from South Africa. Paper presented at Africa Development Finance Workshop. Cape Town: University of Stellenbosch Business School.
[15] Oh, I., Lee, J. D., Heshmati, A., & Choi, G. G. (2009). Evaluation of Credit Guarantee policy using propensity score matching, Small Business Economics, 33(3), 335-351.
[16] Panda, N. M. (1989).Sickness in Small Industries- A National Problem, Indian Journal of Commerce, 42(2), 37-60.
[17] Rahiman, P. A. (2010). A study of credit guarantee fund trust for Micro and Small Enterprises with particular
reference to Bank of Boroda in state of Kerala.(Doctoral Dissertation, Cochin University of Science & Technology, Kerala state, India).
[18] Ram, D., Singh, M. K., & Prasad, A. (2012). Prospects of Agriculture and allied Entrepreneurship Development in North-East India, Indian Research Journal of extension education, II, 66-72. Retrieved on August 17, 2015 from http://www.seea.org.in/special_issue/vol2/18.pdf
[19] Saikia, H. (2012). Measuring financial performance of small scale industries: Some evidences from India.
Journal of Applied Economics and Business Research, 2(1), 46-54.
[20] Sharma, V. (2010).Report of the Working Group to Review the Credit Guarantee Scheme of the Credit Guarantee Fund Trust for Micro and Small Enterprises. Mumbai: RBI
[21] Steijvers, T., Voordeckers, W. & Vanho of, K. (2010). Collateral, Relationship lending and Family Firms, Small Business Economics, 34 (3), 243-259.
[22] Tunahan, H., & Dizkirici, A. S. (2012). Evaluating the Credit Guarantee Fund (kgf) of Turkey as a partial Guarantee Program in the light of international practices.
International Journal of business and social science,
3(10), 79 – 92.