Corresponding Security Level with the Risk Factors of
Personally Identifiable Information through the Analytic
Hierarchy Process
Iuon-Chang Lin
1, 2*, Yung-Wang Lin
3, Yu-Syuan Wu
11 Department of Computer Science and Engineering, National Chung Hsing University, Taichung, Taiwan. 2 Department of Photonics and Communication Engineering, Asia University, Taichung, Taiwan.
3 Department of Computer Science and Information Engineering, Asia University, Taichung, Taiwan.
* Corresponding author. Tel.: +886-4-22840864; email: iclin@nchu.edu.tw Manuscript submitted March 15, 2015; accepted July 3, 2015.
doi: 10.17706/jcp.11.2.124-131
Abstract: Since Taiwan government has announced the New Version of Personal Information Protection Act , People began to pay attention to their personal information and privacy. Many industries significantly increased their responsibilities and faced more serious challenges. In order to cope with the requirements of the new law, BS10012 specification can help enterprises to reduce impact of personal data protection law. Enterprises need to rethink policy objectives, and make risk assessment of personally identifiable information (PII). This study using analytic hierarchy process (AHP) to identify the security level of PII. Corresponding security level with the risk factors of personal information, so that find the suitable countermeasure to protect users PII. Rarely see research about risk assessment of PII by using AHP, therefore the feasibility of the application of AHP in this regard is worthwhile to explore.
Keywords: BS10012, personally information, new version of personal information protection act.
1.
Introduction
With the development of information technology, and the prevalence of network. A lot of information is transmitted through the network, which contains personal information. However, security issues related to information technology constantly occur, such as internal staff negligence leads to personal information loss within the enterprise, and confidential information is stolen. In 1995, the Taiwanese government had already promulgated the "Computer-Processed Personal Data Protection Act" [1], [2], that is the old Personal information Protection Act. With the evolution of the times, many of the provisions already not applicable to the protection of personal information privacy and interest, and people are growing emphasis on their personal information and privacy, so that the new version of Personal Information Protection Act appears in Taiwan [3].
information (PII). The one of risk management processes is risk assessment, this study using the analytic hierarchy (AHP) process [6] for risk assessment, to find security level [7] with the risk factors of personal information, rather than calculate the probability of risk occurrence. Corresponding security level with the risk factors of personal information, so that help managers to find the suitable countermeasures to protect users PII.
The architecture of this paper, Section 2 described research background and relevant work on risk assessment, Section 3 described method by using analytic hierarchy process (AHP) to measure risk factors, and corresponding security level. Section 4 discusses experiments and results, the fifth is the paper summation.
2.
Background and Related Work
2.1.
New version of Personal Information Protection Act
Taiwan has announced the New Version of Personal Information Protection Act since 2010 [3], and has been formally implemented in 1 October, 2012. There are several differences between the two Act , Applicable industry of New Personal Information Protection Act is not only restricted to the eight major industrial(credit information organizations, hospitals, schools, telecommunication businesses, financial businesses, securities businesses, insurance businesses, mass media), but also all industries are applicable. New Personal Information Protection Act where personal information means all personal data (all forms), not just computer processed personal information.
2.2.
BS 10012: PIMS
BS 10012 specification was published in Britain in 2009, full name is Planning for a personal information management system (PIMS, BS10012:2009), mainly aimed at protection of personal information. The PIMS uses the PDCA (Plan-Do-Check-Action) processes [5] methodology and risk management, establish a complete management system for the protection of personal information. Therefore many enterprises improved their IT environment security and strengthen the protection of personal information through PIMS. For establishment of a comprehensive management system for the protection of personal information must pass through the process of risk management.
The processes of risk management include doing risk identification, risk assessment, risk treatment, and risk monitoring down to do sequentially. To derive risk value on risk assessment phase, and to find ways to reduce or remove the risk on risk treatment phase. The phase of risk treatment to reduce the risk value to the enterprise accept range. If the risk value is not the acceptable range for enterprises, necessary to redo the risk assessment. If the risk value is the acceptable range for enterprises, regular audits and follow-up risk on risk monitoring phase.
2.3.
Risk Management
Risk occurs because the weakness subjected the threats utilization [8], causing the enterprises damage (impact), the threats and vulnerabilities that are risk factors. Risk management through the identification of assets, threats and vulnerabilities, so that managers fully understand the risks location, and attempt to reduce the risk to an acceptable range, risk management help enterprises reduce accidents caused financial losses, and prevent potential hazards. The processes of risk management [9] include doing risk identification, risk assessment, risk treatment, and risk monitoring as shown in Fig. 1.
the enterprise accept range. If the risk value is not the acceptable range for enterprises, necessary to redo the risk assessment. If the risk value is the acceptable range for enterprises, regular audits and follow-up risk on risk monitoring phase.
Fig. 1. The processes of risk management.
2.4.
Analytic Hierarchy Process (AHP)
The AHP was proposed by Thomas L. Saaty in1960 [6]. When you want to make a decision with a problem, often need to consider multi-factor which will affect the final decision. The AHP takes into account the multi-factor of problems show that in the hierarchical architecture and pairwise comparisons. The AHP helps to simplify complex issues, and allows participants to subjective judgment and provide an objective decision [10]. So it is widely used, for example, be applied to risk assessment, decision alternatives, and program comparison, even can used in everyday life decisions. The hierarchical architecture is divided into three parts: top layer, intermediate layer, and lowest layer. Top layer represents the Goals of solve the problem, and focus of the problem analysis. Intermediate layer to identify the factors of the problem, the factors also called the Criteria, which impact the final decision-making. Lowest layer represents various measures or alternatives to solve the problem. And the following describes basic steps of AHP method [11]: 1) The decision participants define the problem to be evaluated.
2) Define the criteria which impact final decision of the problem, and each criteria can decompose into multiple subfactors, every criteria and subfactor are the elements.
3) To list the alternatives of the problem to be evaluated.
4) The above steps build in a top-down hierarchical architecture, corresponding to each level.
5) The elements of each layer pairwise comparison with 1-9 scale, and then obtain the comparison matrix, and calculate the eigenvalues and eigenvectors, over and over again to do until the last layer. 6) Doing consistency check to the matrix.
7) Assessing the weight of each layer and the overall weight, find best choice.
3.
Methodology
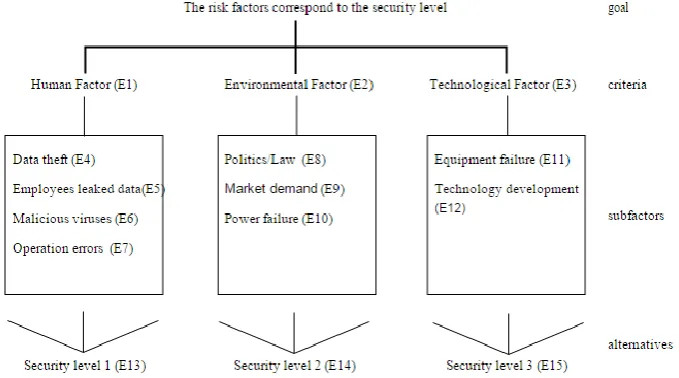
This study uses the AHP in the risk assessment of personally identifiable information, and identify the security level of PII. The preliminary work what we need to do, first, we collected the literature relevant to risk assessment [7], [11]-[15], sorted out three categories of risk factors on Table 1, which caused risk of information assets disclosed or damaged, and the enterprises losses. Three categories of risk factors are human factors, environmental factors, and technological factors.
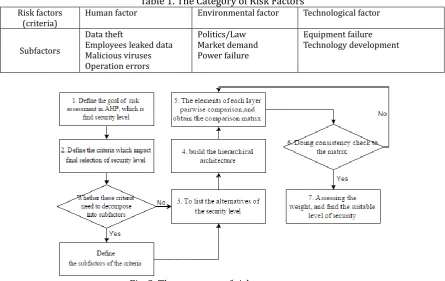
Second, doing risk assessment of these risk factors, in order to find the appropriate level of security by using AHP. The proposed risk assessment flowchart (Fig. 2) according to the following steps:
1) Define the goal of risk assessment in AHP, which is find security level in the study.
criteria, determining whether each principle subdivided into subfactors. Table 1 is what we classify risk factors and sub-factors.
Table 1. The Category of Risk Factors Risk factors
(criteria) Human factor Environmental factor Technological factor
Subfactors
Data theft
Employees leaked data Malicious viruses Operation errors
Politics/Law Market demand Power failure
Equipment failure Technology development
Fig. 2. The processes of risk management.
Table 2. The Elements Pairwise Comparison in Criteria Level
Criterion Scale Criterion
E1 9 7 5 3 1 3 5 7 9 E2
9 7 5 3 1 3 5 7 9 E3
E2 9 7 5 3 1 3 5 7 9 E3
3) Listing the options of the security level to correspond to the risk factors, we represent the security level in 1-3.
4) The hierarchical architecture was made out of the elements (risk factor, subfactors, and the security level) show in Fig. 3.
5) Pairwise comparison the elements of each layer with 1-9 scale, then obtain the comparison matrix, calculated the eigenvalues and eigenvectors, over and over again to do until the last layer. Obtained the relevant weights among elements.
a) Allow participants to assess and pairwise comparison the elements with 1-9 scale to define the importance among each element in same layer, and then obtained the comparison. Higher number means the greater degree of importance, represented by scale 1, 3, 5, 7, 9. indicates that the element parameters, expressed as the element compare with the element , if the scale is close to the more higher on the left, expressed the element is more importance than the element . If the scale is 1, means the element as important as the element . Table 2 shows the elements pairwise comparison in criteria level, the decision makers can measure these risk factors, give rating.
b) After pairwise comparisons among the elements, obtained the comparison matrix. To calculate the eigenvalues and eigenvectors. If there were elements of N, would form a matrix n*n that is the comparison matrix, has the following characteristics: ,
matrix also called the positive reciprocal matrix, like Table 3 is the comparison matrix of the element which we measure out in criteria level.
Table 3. RI Corresponds to the Order of the Matrix
N 1 2 3 4 5 6 7 8 9
RI 0 0 0.58 0.90 1.12 1.24 1.32 1.41 1.45
Table 4. The Comparison Matrix of the Criteria Level
Criteria Human Environmental Technological S.G.M.=4.477
CI=0.037 CR=0.064
Human 1.000 5.000 7.000
Environmental 0.200 1.000 3.000
Technological 0.143 0.333 1.000
Doing consistency check to the comparison matrix. Each element divided by the sum of all elements in the some level, standardized for comparison matrix, and computed the eigenvectors , the consistency ratio (CR), consistency index (CI), and random index (RI). When , means the matrix has consistency. If
, means the matrix has not consistency, redo the step5.
represents eigenvalues, n represents the number of elements in the level. RI is the random consistency index, Saaty [6] noted RI is related to the matrix order N as show in Table 3.
Evaluated the weight, obtained decision making, and found the suitable level of security. In accordance with different security levels, taken different security measures to effectively improve personal data protection in the organization. The security levels were divided into 1, 2, 3, different security levels take different security measures. The higher number expressed the higher grade, need more attention, and more security mechanism.
4.
Experiments and Results
Hypothesis we used the method in school case, to pairwise comparison the elements until the last layer on the hierarchical architecture show as Fig. 3, and give rating with 1-9 scale. Obtained the comparison matrix from the criteria level (shows in Table 4), and the subfactors level (shows in Tables 5, 6, 7). And then calculate the eigenvalues ( ) of these matrices by calculating sum of geometric mean (S. G. M.) of column vector. After find the maximum eigenvalue of the comparison matrix, calculate CI, and CR.
Table 5. The Comparison Matrix of the Subfactors under the Human Criteria
Subfactor Data theft Leaked data Malicious viruses Operation errors S.G.M.=6.364
CI=0.063 CR=0.07
Data theft 1.000 0.333 7.000 5.000
Leaked data 3.000 1.000 9.000 7.000
Malicious viruses 0.143 0.111 1.000 0.333
Operation errors 0.200 0.143 3.000 1.000
Table 6. The Comparison Matrix of the Subfactors under the Environmental Criteria
Subfactor Politics/Law Market demand Power failure S.G.M.=4.477
CI=0.037 CR=0.063
Politics/Law 1.000 5.000 7.000
Market demand 0.200 1.000 3.000
Power failure 0.143 0.333 1.000
Table 7. The Comparison Matrix of the Subfactors under the Technological Criteria
Subfactor Equipment failure Technology development S.G.M.=2.683
CI=0 CR=0
Equipment failure 1.000 5.000
Technology development 0.200 1.000
The result shows every , which represents the satisfactory degree of consistency. That is, consistency degree of the matrices in an acceptable range. As Table 8 shows the weights of risk factors weights associated with the security level corresponding, we can see the weights of influence decision-making is human > environmental > technological. The risk subfactors about data theft (E4), employees leaked data (E5) , politics/law (E8) and equipment failure (E11) corresponding to security level 1, need to against those face providing high security control to reduce the risk of events. Operation errors (E7), Market demand (E9), and Technology development (E12) corresponding to security level 2. Malicious viruses (E6) and Power failure (E10) corresponding to security level 3. According to this method, provide organization to effective and objective classification of security levels, depending on the security level help organizations make decisions quickly, the higher level need more attention.
Table 8. The Result of the Overall Weight
Criteria Human (E1) Environmental (E2) Technological (E3)
0.731 0.188 0.081
Subfactor E4 E5 E6 E7 E8 E9 E10 E11 E12
0.291 0.583 0.042 0.085 0.731 0.188 0.081 0.833 0.167
Security level 3 0.751 0.751 0.088 0.092 0.735 0.281 0.097 0.785 0.097
Security level 2 0.178 0.178 0.243 0.738 0.207 0.584 0.202 0.149 0.701
Security level 1 0.070 0.070 0.669 0.170 0.058 0.135 0.701 0.066 0.202
5.
Conclusion
future, we hope the AHP method can be used widely on PII field of study.
References
[1] (1995). Taiwan Computer-Processed Personal Data Protection Law.
[2] Wang, E., H., H. (1999). ICT and economic development in Taiwan: Analysis of the evidence.
Telecommunications Policy, 23(3), 235-243.
[3] (2010). Taiwan New version of Personal Information Protection Act.
[4] Liu, C., Y., Yang, S., S., & Lin, I., C. (2014). Critical factors of educational institutions adoption for BS 10012: Persional information management system. International Journal of Network Security, 16(3), 161-167.
[5] Young, L. (2010). BS 10012: 2009 data protection–specification for a personal information management system. Records Management Journal, 20(1).
[6] Saaty, R. W. (1987). The analytic hierarchy process — what it is and how it is used. Mathematical
Modelling, 9(3), 161-176.
[7] Chen, J., Wu, G., Shen, L., & Ji, Z. (2011). Differentiated security levels for personal identifiable information in identity management system. Expert Systems with Applications, 38(11), 14156-14162.
[8] Farn, K. J., Lin, S. K., & Fung, A. R. W. (2004). A study on information security management system evaluation — assets, threat and vulnerability. Computer Standards & Interfaces, 26(6), 501-513.
[9] Humphreys, E. (2008). Information security management standards: Compliance, governance and risk management. Information Security Technical Report, 13(4), 247-255.
[10] Bantayan, N. C., & Bishop, I. D. (1998). Linking objective and subjective modelling for landuse
decision-making. Landscape and Urban Planning, 43(1), 35-48.
[11] Dey, P. K. (2010). Managing project risk using combined analytic hierarchy process and risk map.
Applied Soft Computing, 10(4), 990-1000.
[12] Syamsuddin, I., & Hwang, J. (2009, November). The application of AHP model to guide decision makers:
A case study of e-banking security, Proceedings of IEEE Fourth International Conference on Computer
Sciences and Convergence Information Technology (pp. 1469-1473).
[13] Pfleeger, C., P., & Pfleeger, S., L. (2002). Security in computing. Prentice Hall Professional Technical
Reference.
[14] Guan, B. C., Lo, C. C., Wang, P., & Hwang, J., S. (2003, October). Evaluation of information security related
risks of an organization: the application of the multicriteria decision-making method. Proceedings of
IEEE 37th Annual 2003 International Carnahan Conference on Security Technology (pp. 168-175).
[15] Sendi, A., S., Jabbarifar, M., Shajari, M., & Dagenais, M. (2010, May). FEMRA: Fuzzy expert model for risk
assessment. Proceedings of IEEE Fifth International Conference on Internet Monitoring and Protection
(ICIMP) (pp. 48-53).
[16] Zhao, D. M., Wang, J. H., & Ma, J. F. (2006, August). Fuzzy risk assessment of the network security.
Proceedings of IEEE International Conference on Machine Learning and Cybernetics (pp. 4400-4405).
Yung-Wang Lin is a Ph.D. student of the Department of Computer Science and Information Engineering, Asia University, Wufeng Taichung Taiwan. His current research interests include information security and cloud computing. He also employed in NanKai University of Technology.