Page 374 www.ijiras.com | Email: [email protected]
Influence Of Processing Parameters On Flexural Properties Of
Injection Moulded PP
Using Response Surface Approach
Eze Somtochukwu
Nebo Fidelis
Welding and Fabrication Department, Scientific Equipment Development Institute (A Unit of NASENI) Enugu
Onyeagba Basil Obinna
Efobi Daniel Ifeanyi
Machine Building Department, Scientific Equipment Development Institute (A Unit of NASENI) Enugu
Madu Okwuchukwu
Advance Manufacturing Department, Scientific Equipment Development Institute (A Unit of NASENI) Enugu
Nwafor Aloysus Ifeanyi
Electrical Maintenance Department, Scientific Equipment Development Institute (A Unit of NASENI) Enugu
Ukpai Chima Allen
Plastic Recycling Department, Scientific Equipment Development Institute (A Unit of NASENI) Enugu
I. INTRODUCTION
Polypropylene (pp) is a low – Cost polymer with versatile applications but with limited impact strength. In recent years, polymeric composites were widely used in the production of new engineering materials (Bilewicz et al, 2006). It is perceived as a reflection of technological development meanwhile the polymeric composites are promising due to their economic versatile applicability and good mechanical properties (Bociaga and Jaruga, 2007). The global market for
polypropylene had a volume of 45.1million tonnes, which led to a turnover of about 65billion (Subodh et al, 2016). Polymers may be injection moulded including thermoplastics, fiber reinforced thermoplastics, thermosetting plastics and elastomers. Critical to the adoption of this high volume, low cost process technology is the ability to consistently produce quality parts (Kavade and Kadam, 2012).
Injection moulded polymer is any shape produced by heating polymer granules or powder in a tube at high temperature to melt, pushed by a rotating thread into a mould Abstract: Influence of processing parameters on flexural properties of injection moulded polypropylene was investigated using response surface approach. Investigations were focused on the rheological behaviour of injection moulded polypropylene (PP) products at different temperature. Flexural strength test was conducted on the test specimens moulded at different injection temperatures ranging from 240oC to 280oC using polypropylene. The test information was analyzed statistical using design expert software version 10.1. The results obtained indicate that a melt temperature has an effect on viscosity of injection moulded polypropylene. Also, an optimum parameters and flexural strength values of 41.700C, 239.19rpm, 227.340C, 42.43s and 28.99MPa for mould temperature, screw speed, barrel temperature, cooling time and flexural strength respectively was obtained. The results of this finding will be useful in polymer industries were polypropylene is been used as a raw material during injection moulding were flexural strength is paramount.
Page 375 www.ijiras.com | Email: [email protected] and allowed to cool and solidify to take mould shape and size
(Kingsburg, 2014). This is done to overcome the decrease in shear rate of molten material during flow and solidification in mould due to increased viscosity. This process can be used to produce a wide variety of products such as bottle tops, children toys, vehicle interior components etc which makes it the most important plastic manufacturing process.
Moreover, the properties of injection moulded materials are significantly influenced by the injection moulding conditions regardless of the part design (Ranjusha et al, 2012). Two of the conditions that have a substantial influence on the behaviour of the polymer are the melt temperature and mould temperature. Melt temperature is the actual temperature of the polymer as it exits the nozzle and enters the mould. similary, the actual surface temperature of the mould cores and cavities are related but not necessarily the same as the temperature of the fluid passing through the channels in the mould. It is generally understood that the melt temperature also has influence on the final molecular weight of the polymer in the moulded part. Mould temperature has less obvious but often profound effect on final properties however it is an important factor in determining the degree of crystallinity in semi crystalline materials (Sepe, 2011).
Melting of plastic materials is a slow process and hence determines the rate of plastic processing (Shubbar and Sawsan, 2013). Severe limitations are imposed on attainable rates by the thermal and physical properties of the plastics.
The low thermal conductivity of plastics limits the rate of heat transfer and thermal degradation places low bounds on the temperature and time the plastic can be exposed (Ayache, 2006).
Shubbar and Sawsan (2013), studied injection temperature effects on the properties of high density polyethylene crates it was revealed that the crates produced at a temperature range of 260-280°C gave the best rheological and mechanical result. (Ranjusha et al, 2012) investigated the effect of moulding temperature on the properties of Polypropylene/HDPE/Clay/Glass fibre (G.F), using polypropylene and HDPE (PP+HDPE) as base matrix. Nano fillers such as nano kaolin clay and glass fibre (G.F) were incorporated in the polymer with different combinations: (PP + HDPE), (PP + HDPE + Clay), (PP + HDPE + G.F) and (PP + HDPE + Clay + G.F). These materials were all moulded at different temperature. The specimen from each of the compounds were tested for tensile, flexural and impact strength.
Flexural strength decreased with increase in temperature from 1800C to 2000C in PP + HDPE and PP + HDPE + Clay samples ranging response from 43.80N/mm2 and 48.90N/mm2 to 38.00N/mm2 to 38.70N/mm2 while in the the samples containing Glass Fibre and G.F + clay with optimum flexural strength of 47.40N/mm2 and 49.40N/mm2 respectively at 1900C then dropped at 2000C.
(Satoru et al, 2010) worked on improving the rigidity and impact strength of polypropylene (PP) compounds. Using polypropylene, the first groups of specimens were reinforced with granular state calcium carbonate, the second specimen group, reinforced with tabular shaped talcum and the third group was reinforced with needle shaped glass fiber, after which they were tested. Impact and flexural strength,
according to their % wt and particle size. The result depicted higher impact strength for smaller particle size and 8.60J/m2 at 4.00mm diameter then 3.60J/m2 at diameter of 24.00mm
The difficulty is further compounded by the very high viscosity of the molten plastic. This is because, melts (a solid material in molten form as a result of increase in temperature i.e. to melting point) are non-Newtonian fluids; therefore increase in viscosity decreases their shear rate resulting to reduced rheological flow The interior door opener and bumper of some automobiles are made of polypropylene the door opener need high flexural strength while the bumper needs more of impact strength. This work is geared towards reducing failure rate by providing information that will serve as a guideline to manufacturers in selecting processing Parameters with respect to expected property of component. Specifically, is to study the significance of the influence of injection moulding parameters on the flexural properties of polypropylene products.
II. MATERIALS AND METHOD
The plastic material used in this work is Polypropylene (PP). This was chosen because they are the most commonly used in manufacturing of components for mechanical devices, mostly used in interior parts of automobiles, aircrafts, ships automobile bumpers
Clamping force,
Barrel Temperature = 2300C
DESIGN OF EXPERIMENT FOR PROCESSING
PARAMETER EFFECT ON FLEXURAL STRENGTH OF INJECTION MOULDED PP
Design Expert software (version 10.1) was used in this study to design the experiment and to optimize the reaction conditions. The experimental design employed in this work was a two-level-four factor fractional factorial design, including 30 experiments. Barrel temperature, Screw speed, Mould temperature and cooling time were selected as independent factors for the optimization study. The response chosen was the flexural strength of PP. Eight replications of centre points were used in order to predict a good estimation of errors. The experiments were performed in a randomized order. The actual and coded levels of each factor are shown in Table 1. The coded values were designated by −1 (minimum), 0 (centre), +1 (maximum), −α and +α. Alpha is defined as a distance from the centre point which can be either inside or outside the range, with the maximum value of 2n/4, where n is the number of factors (Vicente et. Al.). Hereby the value of alpha is set at 0.5. It is noteworthy to point out that the software uses the concept of the coded values for the investigation of the significant terms, thus equation in coded values is used to study the effect of the variables on the response. The empirical equation is represented as shown below:
Y = + + +
Page 376 www.ijiras.com | Email: [email protected] Selection of levels for each factor was based on the
experiments performed to study the effects of process variables on the application of injection moulding for processing of PP. The lower extreme level of barrel temperature was 1900C since below that moulding was impossible as PP could not melt and the upper extreme level of temperature was 270 0C. The levels of screw speed were selected between 229rpm and 249rpm, a range of 300C and 500C for mould temperature and the cooling time was limited between 33.1Secs and 53.1Secs (as obtained from WIBA Assist 10.1 ).
Factor Units -⍺ Low
level 0 level
High level
+⍺
Barrel Temperature
(A)
0C 210(-2) 220(-1) 230 240(+1) 250(+2)
Screw Speed (B)
Rpm 229(-2) 234(-1) 239 244(+1) 249(+2)
Mould Temperature
(C)
0C 30(-2) 35(-1) 40 45(+1) 50(+2)
Cooling Time (D)
Sec 33.1(-2) 38.1(-1) 43.1 48.1(+1) 53.1(+2)
Table 2.1: Studied range of each factor in actual and coded form of influence of processing parameters on flexural
properties of injection moulded PP
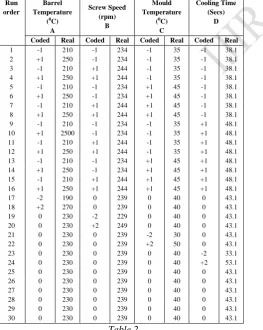
EXPERIMENTAL DESIGN MATRIX OF INFLUENCE OF
PROCESSING PARAMETERS ON FLEXURAL
PROPERTIES OF INJECTION MOULDED PP
Table 2
A. DETERMINATION OF FLEXURAL STRENGTH
The deflection load, Length of beam,
∴ Flexural strength,
Y = Deflection
The cavities were completely filled using an injection pressure of 160kg/cm2. Using a clamping force of 56.1tons, at 1900C barrel temperature, 229rpm screw speed, 300C mould temperature and 33.1 cooling time; eight test bars of 110mm long, 20mm wide and 2mm thick (according to ASTM D790-11) flexural strength test specimen were produced as first run. Before going over to the next run an interval of 130 seconds was allowed for new parameters to stabilize.
Moulding continued until temperature of 2700C which is the +2 level in experiment design in addition to observation of thermal degradation. This was indicated by a change in the color of the plastic melt. At this point, moulding was stopped. The moulding process was repeated with PP which melts at 2400C and at 2800C thermal degradation was observed.
Figure 1: Flexural Strength Test Specimen
B. EXPERIMENTATION
Flexural test was carried out using Tinus Olsen Universal Testing Machine in accordance with ASTM D790 (P=9.81N). The mandrel of 12mm for test fixed on the machine vice and the sample was placed on the machine vice and test commenced. As the Specimen is stretched the computer generated data was displayed on the monitor screen, the flexural test was performed at a speed of 100mm/min.
III. RESULT AND DISCUSSION
The 3D response surface plots were generated to estimate the effect of the combinations of the independent variables on the flexural strength. The plots are shown in Figures 2 to 7
Run order
Barrel Temperature
(0C)
A
Screw Speed (rpm)
B
Mould Temperature
(0C)
C
Cooling Time (Secs)
D
Coded Real Coded Real Coded Real Coded Real
1 -1 210 -1 234 -1 35 -1 38.1
2 +1 250 -1 234 -1 35 -1 38.1
3 -1 210 +1 244 -1 35 -1 38.1
4 +1 250 +1 244 -1 35 -1 38.1
5 -1 210 -1 234 +1 45 -1 38.1
6 +1 250 -1 234 +1 45 -1 38.1
7 -1 210 +1 244 +1 45 -1 38.1
8 +1 250 +1 244 +1 45 -1 38.1
9 -1 210 -1 234 -1 35 +1 48.1
10 +1 2500 -1 234 -1 35 +1 48.1
11 -1 210 +1 244 -1 35 +1 48.1
12 +1 250 +1 244 -1 35 +1 48.1
13 -1 210 -1 234 +1 45 +1 48.1
14 +1 250 -1 234 +1 45 +1 48.1
15 -1 210 +1 244 +1 45 +1 48.1
16 +1 250 +1 244 +1 45 +1 48.1
17 -2 190 0 239 0 40 0 43.1
18 +2 270 0 239 0 40 0 43.1
19 0 230 -2 229 0 40 0 43.1
20 0 230 +2 249 0 40 0 43.1
21 0 230 0 239 -2 30 0 43.1
22 0 230 0 239 +2 50 0 43.1
23 0 230 0 239 0 40 -2 33.1
24 0 230 0 239 0 40 +2 53.1
25 0 230 0 239 0 40 0 43.1
26 0 230 0 239 0 40 0 43.1
27 0 230 0 239 0 40 0 43.1
28 0 230 0 239 0 40 0 43.1
29 0 230 0 239 0 40 0 43.1
Page 377 www.ijiras.com | Email: [email protected]
Design-Expert® Software Factor Coding: Actual Flexural Strength (MPa)
Design points above predicted value Design points below predicted value 28.89
25.98
X1 = A: Barrel Temperature X2 = B: Screw Speed Actual Factors C: Moulding Temperature = 40 D: Cooling Time = 43.1
234 236 238 240 242 244 210 220 230 240 250 25 26 27 28 29 F le xu ra l S tr e n g th ( M P a )
A: Barrel Temperature (Deg. Cel.) B: Screw Speed (rpm)
Figure 2: graph of screw speed and barrel temperature effect on flexural strength
Design-Expert® Software Factor Coding: Actual Flexural Strength (MPa)
Design points above predicted value Design points below predicted value 28.89
25.98
X1 = A: Barrel Temperature X2 = C: Moulding Temperature Actual Factors B: Screw Speed = 239 D: Cooling Time = 43.1
35 37 39 41 43 45 210 220 230 240 250 25 26 27 28 29 30 F le xu ra l S tr en gt h (M P a)
A: Barrel Temperature (Deg. Cel.) C: Moulding Temperature (Deg. Cel)
Figure 3: graph of flexural strength effect against moulding temperature and barrel temperature
Design-Expert® Software Factor Coding: Actual Flexural Strength (MPa)
Design points above predicted value
Design points below predicted value
28.89
25.98
X1 = B: Screw Speed X2 = C: Moulding Temperature
Actual Factors A: Barrel Temperature = 230 D: Cooling Time = 43.1
35 37 39 41 43 45 234 236 238 240 242 244 25 26 27 28 29 30 F le xu ra l S tr e n g th ( M P a )
B: Screw Speed (rpm) C: Moulding Temperature (Deg. Cel)
Figure 4: graph of moulding temperature and screw speed against flexural strength
Design-Expert® Software Factor Coding: Actual Flexural Strength (MPa)
Design points above predicted value Design points below predicted value 28.89
25.98
X1 = B: Screw Speed X2 = D: Cooling Time Actual Factors A: Barrel Temperature = 230 C: Moulding Temperature = 40
38.1 40.1 42.1 44.1 46.1 48.1 234 236 238 240 242 244 25 26 27 28 29 F le xu ra l S tr e n g th ( M P a )
B: Screw Speed (rpm) D: Cooling Time (Seconds)
Figure 5: graph of cooling time and screw speed effect on flexural strength
Design-Expert® Software Factor Coding: Actual Flexural Strength (MPa)
Design points above predicted value Design points below predicted value 28.89
25.98
X1 = C: Moulding Temperature X2 = D: Cooling Time Actual Factors A: Barrel Temperature = 230 B: Screw Speed = 239
38.1 40.1 42.1 44.1 46.1 48.1 35 37 39 41 43 45 25 26 27 28 29 F le xu ra l S tr e n g th ( M P a )
C: Moulding Temperature (Deg. Cel) D: Cooling Time (Seconds)
Figure 6: graph of flexural strength against cooling time and moulding temperature
Design-Expert® Software Factor Coding: Actual Flexural Strength (MPa)
Design points above predicted value
Design points below predicted value
28.89
25.98
X1 = A: Barrel Temperature X2 = D: Cooling Time
Actual Factors B: Screw Speed = 239 C: Moulding Temperature = 40
38.1 40.1 42.1 44.1 46.1 48.1 210 220 230 240 250 25 26 27 28 29 F le xu ra l S tr e n g th ( M P a )
A: Barrel Temperature (Deg. Cel.) D: Cooling Time (Seconds)
Figure 7: flexural strength – Cooling time and barrel temperature curve
Design-Expert® Software Factor Coding: Actual Flexural Strength (MPa)
Design Points
95% CI Bands
Actual Factors A: Barrel Temperature = 230 B: Screw Speed = 239 C: Moulding Temperature = 40 D: Cooling Time = 43.1
A: Barrel Temperature (Deg. Cel.)
210 220 230 240 250
F le x u ra l S tr e n g th ( M P a ) 25 26 27 28
29 Warning! Factor involved in multiple interactions.
4
B: Screw Speed (rpm)
234 236 238 240 242 244
F le x u ra l S tr e n g th ( M P a ) 25 26 27 28
29 Warning! Factor involved in multiple interactions.
4
C: Moulding Temperature (Deg. Cel)
35 37 39 41 43 45
F le x ur al S tr en gt h (M P a) 25 26 27 28
29 Warning! Factor involved in multiple interactions.
4
D: Cooling Time (Seconds)
38.1 40.1 42.1 44.1 46.1 48.1
F le x u ra l S tr e n g th ( M P a ) 25 26 27 28
29 Warning! Factor involved in multiple interactions.
4
Figure 8: flexural strength – All factors curve
Page 378 www.ijiras.com | Email: [email protected] increase was observed as cooling time increased and a spelt
out drop in flexural strength from 43.1 Seconds to 53.1 Seconds.
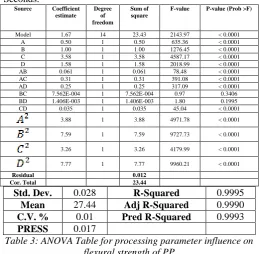
Source Coefficient estimate
Degree of freedom
Sum of square
F-value P-value (Prob >F)
Model 1.67 14 23.43 2143.97 < 0.0001
A 0.50 1 0.50 635.36 < 0.0001
B 1.00 1 1.00 1276.45 < 0.0001
C 3.58 1 3.58 4587.17 < 0.0001
D 1.58 1 1.58 2018.99 < 0.0001
AB 0.061 1 0.061 78.48 < 0.0001
AC 0.31 1 0.31 391.08 < 0.0001
AD 0.25 1 0.25 317.09 < 0.0001
BC 7.562E-004 1 7.562E-004 0.97 0.3406
BD 1.406E-003 1 1.406E-003 1.80 0.1995
CD 0.035 1 0.035 45.04 < 0.0001
3.88 1 3.88 4971.78 < 0.0001
7.59 1 7.59 9727.73 < 0.0001
3.26 1 3.26 4179.99 < 0.0001
7.77 1 7.77 9960.21 < 0.0001
Residual 0.012
Cor. Total 23.44
Std. Dev. 0.028 R-Squared 0.9995
Mean 27.44 Adj R-Squared 0.9990
C.V. % 0.01 Pred R-Squared 0.9993 PRESS 0.017
Table 3: ANOVA Table for processing parameter influence on flexural strength of PP
The ANOVA results for the model terms are given in table 4.3. Analysis of variance (ANOVA) was applied for estimating the significance of the model at 5% significance level and shown in table 4.3. A model is considered significant if the p-value (significance probability value) is less than 0.05. From the p-values presented in tables 4.3, it can be stated that all the linear terms A, B, C and D and interaction terms AB,
AC, AD, CD, and quadratic terms , , and are significant model terms.
The "Pred R-Squared" of 0.9993 is in reasonable agreement with the "Adj R-Squared" of 0.9990; i.e. the difference is less than 0.2. "Adeq Precision.
Based on this, the insignificant terms of the model were removed and the model reduced to the following equation: X = 28.86 – 0.14A + 0.2B + 0.39C - 0.26D + 0.062AB - 0.14AC - 0.12AD - 6.875E - 003BC + 9.375E - 003BD + 0.047CD - 0.38A2 - 0.53B2 - 0.34C2 - 0.53D2
X is the response variable (Flexural strength) and A-D are the coded values of the independent variables. The above equation represents the quantitative effect of the factors (Barrel Temperature, Screw Speed, Mould Temperature and Cooling time) upon the response (Y). Coefficients with one factor represent the effect of that particular factor while the coefficients with more than one factor represent the interaction between those factors. Positive sign in front of the terms indicates synergistic effect while negative sign indicates antagonistic effect of the factor. The adequacy of the above proposed model was tested using the Design Expert sequential model sum of squares and the model test statistics.
From low to high temperatures there is an increase in viscosity which in turn increases the molecular distribution rheology thus even grain orientation as shown in figures 2 and 3 by the increase in flexural strength as the barrel and mould temperature increased. The prolonged pressure in addition to pressure increase from screw speed increase, resulting to over
packing as more material is forced into the cooling melt in the cavity and this continues until the gate seals, leading to inhibited relaxation; thus molecular orientation increase; thus increase in flexural strength as seen in figure 5 . These factors usually combine with the degree of crystallization achieved during solidification to determine the solid properties, but if too high it leads to thermal degradation.
The extended cooling time will influence relaxation and hence decrease in grain orientation. This is illustrated in figures 7
Barrel Temperatur
e .(0C) A
Screw Speed (rpm) B
Mould Temperature
(oC)
C
Cooling Time (Seconds)
D
Experim ental Flexural Strength (MPa)
Predicted Flexural Strength (MPa)
227.34 239.19 41.70 42.43 28.99 28.86
Table 4: Results of the model validation (experiment indicates the optimum processing parameters and flexural strength)
IV. CONCLUSIONS
From the foregoing, the following conclusions were drawn
That the rate of heat transfers during melting and solidification both inside and outside the mould has a profound effect on the solid properties of plastics.
That the obtained optimum processing parameters and optimum flexural strength should be used in injection moulding where high flexural strength is needed.
ACKNOWLEDGEMENT
The authors would like to thank the management and staff of scientific equipment development institute Enugu (a unit of NASENI) for their support in this research.
REFERENCES
[1] Kingsburg T. (2014), How Plastics Are Made,BioProcess International Magazine, Westborough. (April): pp. 9, 12. [2] Ranjusha J, Anjana R. and George, K. (2012), Effect of
Mould Temperature on the Properties of Polypropylene/
high density polyethylene/Clay/Glass Fibre International
journal of engineering research and application, 2. (5): pp. 1922- 1926.
[3] Sepe, P. (2011), Importance of Melt and Mould
Temperature, Plastics Technology magazine, Michigan
22.(Dec): pp. 183-186.
[4] Shubbar D. and Sawsan A. (2013), Injection Temperature Effects on the Properties of High Density Polyethylene
Crates. Journal of Engineering, University of Kufa. 6.
(19): pp. 753-763.
[5] Ayache J. (2006), Grain Boundaries and High
Temperature Super Conductors. Philosophical Magazine,
Taylor and Francis, UK., 86 (15).
Page 379 www.ijiras.com | Email: [email protected]
using taguchi methodology, journal of mechanical and
civil engineering 4 (4): pp. 49- 58 ISSN: 2278- 1684. [7] Bilewicz M., Viana J. C., Cunha A. M. and L. A.
Dobrzanski (2006), morphology diversity and mechanical response of injection moulded polymer nanocomposities
and Polymer – Polymer composities, journal of
achievements in materials and manufacturing engineering 15 (1): pp. 159 – 165.
[8] Bociaga E. and T. Jaruga (2007), dynamic mechanical properties of parts from multicavity injection mould,
journal of achievements in materials and manufacturing engineering. 23 (2): pp. 83 – 86.
[9] Satoru, M., Tsnyoshi, W. and K. Susumu. (2010),
Improving the rigidity impact strength of polypropylene
for automotive application, petrochemical research
laboratory, Sumitomo Co, Ltd. Kagaku, 1: pp. 4-7. [10]Subodh S. T., Ashish K. S. and S. Ashish (2016),
parametric study of injection moulding using
polypropylene H200mk Grade, international journal of