Baghdad Science Journal
Vol.16(3)2019
DOI:http://dx.doi.org/10.21123/bsj.2019.16.3.0626
Measuring Uranium Concentrations in Soil Samples of Midland Refineries
Company - Doura - Baghdad – Iraq
Ruwiadah Tarek Mahdi1 Wijdan Thamer Fzaa2 Basim Khalaf Rejah 1
Received 21/6/2018, Accepted 20/3/2019, Published 1/9/2019
This work is licensed under a Creative Commons Attribution 4.0 International License.
Abstract:
In this study, the CR-39 detector technique was used, to estimate the uranium concentration from the soil in midland refineries Company (Doura refine ( , Baghdad, Iraq. Uranium concentrations in soil samples have been measured using solid state nuclear track detector type CR-39. Nine soil samples were collected from different areas within the Doura refinery and other soil samples were collected form Abu Tayara Street and ALshortaa District outside the refinery for comparison. The results showed variable values for uranium concentrations. The average value of uranium concentration was found to be 0.37 ppm in doura refinery. For areas outside the refinery, the concentration of uranium was 0.008 ppm. These results were less than the global limit.
Key words: Alpha particles, Cancer, CR-39, Soil, Uranium.
Introduction:
Some human activities may result in an increase in the exposures and need to be controlled by regulations. In this context, materials that are giving rise to the increased radiation exposures are known by the Naturally Occurring Radioactive Material (NORM). NORM is an acronym for the Naturally Occurring Radioactive Material, which includes all radioactive elements, existed in the environment. Long-lived radioactive elements include uranium, thorium and potassium and any of their decay products, such as radium and radon (1, 2, 3).
These elements exist in the Earth's crust, atmosphere and specifically concentrated at certain places such as uranium ore bodies. The calculable health risks from exposure to low levels of 226Ra and 238U are little, and short term exposures cause solely very little risks (4, 5).
When uranium is high in the soil, it can cause to
222
Rn and its airborne progeny is a significant internal health hazard (6). Uranium as a heavy metal is a natural constituent of the earth's crust and the presences of it in soil are natural and anthropogenic when the main sources of anthropogenic exist in various industrial sources and agricultural activities such using fertilizer while the result of these activities are causing soil pollution by these types of heavy metals.
1 Department of Physics, College of Science for Women,
University of Bagdad, Baghdad, Iraq.
2 Department of Physics, College of Science, Al-Nahrain
University, Baghdad, Iraq.
*Corresponding author: [email protected]
The maximum permissible levels of metal concentrations in soil complyed with the idea of preventing toxic exposure of plants, animals and humans (7, 8).
On average, the human body contains
approximately 90μg of uranium, which comes from the normal consumption of food, air and water. About 66% are concentrated in the skeleton, 16% in the liver, 8% in the kidneys and 10% in other tissues (9) .Uranium decomposes primarily through the emission of alpha particles that do not penetrate the outer layers of the skin, but may affect the body's internal cells (which are most vulnerable to the ionizing effects of alpha particles) when ingested or inhaled uranium exposure to alpha and beta particles as a result of the inhalation of insoluble uranium particles may damage lung tissue and increase the risk of lung cancer (10). If taken through the digestive system it has a multiplier effect when uranium enters through the mouth and food digested into the bloodstream and is transferred to all members of the body to concentrate mostly in kidney, bone, and liver. The kidney is one of the most sensitive members of uranium in the body (11).
within the Midland Refineries Company (Doura refinery) and soil samples from Abu Tayara Street and ALshortaa District outside of the refinery for comparison as well as to determine the risk of lung cancer in people in these areas.
Materials and Methods:
The small piece of detector were used (1x1) cm2, was sensitive to the alpha particles that released by
radon and its progeny, fixed at the top of the cup (can technique)(12).Soil samples were collected in May 2017 from the study areas. Samples were taken from nine areas of operational units deployed inside the refinery (Three samples from each site).
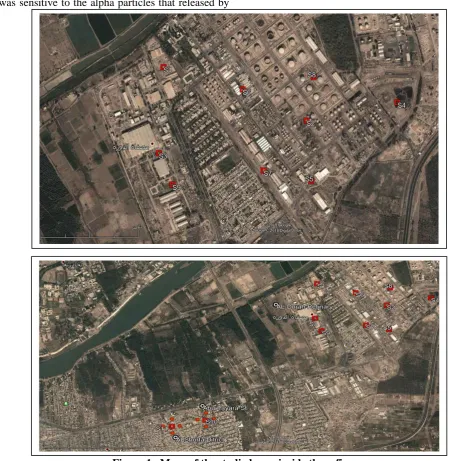
The study area from which samples are taken within the refinery limits is approximately 3.43 km2 as shown in Fig . 1.
Figure 1 . Maps of the studied area inside the refinery.
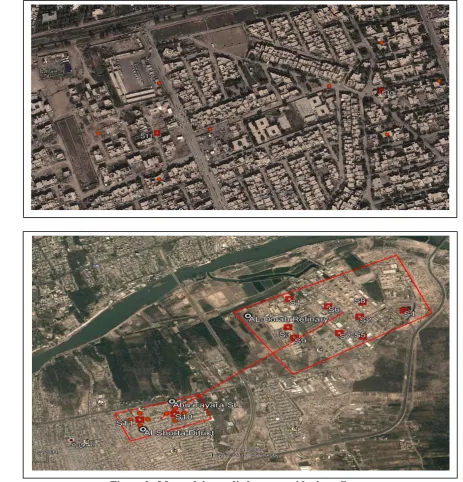
Samples were collected from the area of the Abu Tayara Street and ALshortaa District that outside distance 3.3 km from the refinery, and then the sampling rate for each area was taken , as shown Fig. 2. The samples were taken for depths (3-10) cm. After collecting the soil samples, weight 12 g is was placed in cup (can technique) and left for 50 days to obtain the radiative equilibrium state. The CR-39 detectors were etched at several conditions. The optimum condition for the etching
Figure 2 . Maps of the studied area outside the refinery.
For chemical scavenging technology, we use NaOH solution and standard 6.25 N. The straw solution is placed in a water bath for heating up to 70 °C for 6 hours. At this stage, the effects are detected by selecting the appropriate magnification of 40 X objective lens, and then counting the effects of the area unit using a special lens divided into several squares and calculating the average number of effects taken for each sample (14, 15).
𝜌𝑥 is the track density of studied samples which can calculated by (15):
𝛒𝐗 =
𝐍𝐚𝐯𝐚
𝐀 … 𝟏 𝑪×
𝛒× =
𝐂𝐒
𝛒𝐒 … 𝟐
Uranium concentrations Cx were calculated in soil samples from the following relationship:
𝐂𝐗 =
𝛒𝐗
𝐬𝐥𝐨𝐩𝐞 … 𝟑
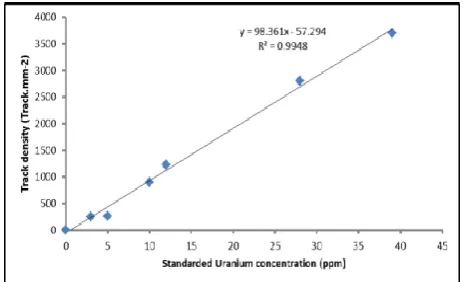
Figure 3. The relation between track density and uranium concentration for standard geological soil samples. followed Al-Baidhani (16) and Qusy (17).
Results and Discussion:
United Nation Environment Program (UNEP) proved that uranium can diffuse into soil with 15cm for 8 years. Therefore, uranium concentration (UC) was measured for 3-10 cm depths of soil samples collected from 11 districts. (Each sample represent the average value of three samples were taken from the site).
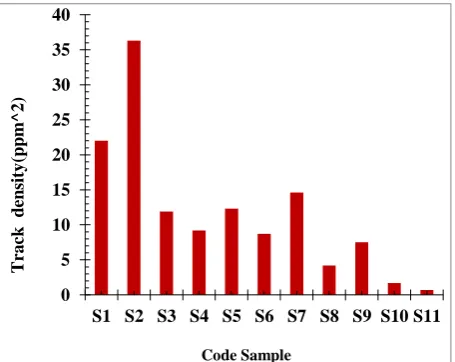
Table 1 shows the results of track density and concentrations of uranium in these areas. The results show that the maximum values of track density were 36.3 Track/mm2 in casinos tanks and the minimum values were 4.2 Track/mm2 in Storage of chemicals site, whereas, the average values were 14.07 Track/mm2 .
In this study, uranium concentrations were determined at different sites inside Doura refinery and shows that the highest concentration of was
0.36 ppm in S2 (casinos tanks). The lowest
concentration was 0.04 ppm in S8 (Storage of chemicals). The average value for all sites was 1.15 ppm.
Table 2 presents the results track density and concentrations of uranium for different samples in areas outside the refinery. Then the samples rate for each area was taken (Samples were taken from nearby areas and away from the refinery to see how affected they were ).
The results shows that the average value of track density was 1.7 Track/mm2 and the average value of uranium concentrations was 0.01 ppm in S10 (Abu Tayara Street) while the average value of
track density and uranium concentrations were 0.7 Track/mm2 and 0.007 ppm in S11 ( Al-Shortaa District) respectivelyas shown in Figs 4 and 5. It is observed that the concentration of uranium in the soil outside the refinery is less than the concentration of uranium in the refinery soil. These results can be attributed to the fact the refinery in an industrial area and is exposed daily to industrial waste while the areas outside the refinery are far away and surrounded by agricultural land.
The concentrations of uranium values in the study areas remain within the permissible global limit (18, 19). This is a clear indication that uranium radiation activity is acceptable compared to other studies (20, 21).
Table 1 and 2 show that the concentration of uranium that calculated in the study areas fluctuates between 0.04-0.36 ppm, these values are within the permissible limit as the allowable limit is less than 11.7 ppm according to UNSCEAR (19).
Table 1. The uranium concentration of soil samples inside the refineries company – Doura.
Table 2. The uranium concentration of soil samples outside the refineries company – Doura.
Code Sites Name of Site Track Density (Track/mm2) Uranium Concentration (ppm)
S10 Abu Tayara Street 1.7 0.01
S11 ALshortaa District 0.7 0.007
Average 1.2 0.008
Code
Sites Latitude Longitude Name of Location
Track Density (Track/mm2)
Uranium Concentration
ppm S1 330 21' 34" 440 33' 25" Laboratory Gas Analyzes 22 0.22 S2 330 51' 22" 440 22' 03" Casinos tanks 36.3 0.36 S3 330 17' 15" 440 02' 24" API depot (1) 11.9 0.119 S4 330 51' 26" 440 06' 27" Industrial Water Treatment Unit 9.2 0.09 S5 330 44' 09" 440 27' 40" Assembling barrels of Ferfera l (fat) 12.3 0.12 S6 330 07' 29" 440 45' 46" Chemical storage containers 8.7 0.08 S7 330 50' 11" 440 13' 52" Cabs for barrels 14.6 0.14 S8 330 25' 32" 440 56' 05" Storage of chemicals 4.2 0.04 S9 330 59' 08" 440 29' 27" API depot (2) 7.5 0.07
Figure 4 shows the relationship between uranium concentration and code samples in studied areas while Fig. 5 represents the relationship of the track density relative to code samples.
Figure 4. The relationship between uranium concentration and code samples in studied area.
Figure 5. The relationship between track density and code samples in studied area.
Conclusions:
The average uranium concentration in industrial soil collected from doura refinery are 0.37 ppm and in areas outside the refinery are 0.008 ppm. These values of concentrations are within the permissible limit as the allowable limit is less than 11.7 ppm
according to UNSCEAR .
This study showed that uranium concentrations is available, even if a few, so we recommend to take special preventive measures to prevent the occurrence of any incidents of radiation exposure in any time by speeding up the work and to wear protective clothing.
Conflicts of Interest: None.
References
1. Merrill E, Gressel T. Environmental Radio activity. th
2. Garnier Laplace J, Colle C, Morello M. Uranium Naturel Environment. 2001; IRSN, 2-6.
3. Henner P, Garcia-Sanchez L. Thorium 232 et Environment. 2002; IRSN, 2-7.
4. Hana NA. Determination of uranium in teeth paste by using CR-39 detector. Thesis. M.Sc. College of Science,The University of Mosul; 2002.
5. Abojassim Ali Abid , Fares Al-kufI, Abbas Mohsen Ali. Determination of effective radium content and uranium for the soap and the detergent powder samples in Iraq. Curr Pediatr Res. 2017; 21 (3): 485- 489 .
6. Lubin J. Studies of Radon and Lung Cancer in North America and China. Radiation Protection Dosimetr. 2003; 104(4), 315.
7. Shapiro JB. A preliminary screening technique for selected metals at waste sites. JRNC. 1995; 192 (2), 275.
8. Kamal O. Abdullah, Salar Z. Muhammed, Adil M. Hussein. Assessment of Rn and U Concentrations in the Soil of Qadafery, Kalar and Zarayan Located in Sulaimani Governorate of Kurdistan Region- Iraq .Am J Environ Protect. 2015; 4 (1): 40-44 .
9. World Health Organization , Department of Protection of the Human Environment. Depleted uranium, Sources, Exposure and Health Effects. Geneva; April 2001.
10. Contemporary Physics Education Project (CPEP). Nuclear Science, A Guide to the Nuclear Science Wall Chart; 2003.
11. World Health Organization, Department of Protection of the Human Environment . Depleted uranium, Sources, Exposure and Health Effects. Geneva; April. 2011.
12. Ruwiadah Tarek Mahdi. Measurement of Indoor Radon Gas Concentration in same Region of Baghdad Governorate Using CR-39 Nuclear Track Detector. Baghdad Sci J . 2017; 14 (4) : 688- 691.
13. Ruwiadah T M , Basim K R , Asael K M. Radon Concentration and the Annual Effective Dose in the Soil Samples of the Midland Refineries Company Doura Baghdad Iraq. Int J Sci Res. 2017 ; 6 ( 8): 1513-1516 .
14. Basim Kh. R. and Gofraan Th. A. Radon Gas Concentration Measurement in Air of Al - Haswaa City in Province of Baghdad. Iraqi J Sci. 2017; 58 (2A): 663-668.
15. Nisar A, Muhammad S j , Sohail A K, Tabassum N, Sajjad A, Muhammad R . Measurement Of Radon Exhalation Rate, Radium Activity And Annual Effective Dose From Bricks And Cement Samples collected From Dera Ismail Khan. Am J App Sci. 2014 ; 11 (2) : 240-247.
16.Al-Baidhani M A. Determination of the Radioactivity in Soil and Water in Baghdad, Karbala and Basrah Samples. M.Sc. Thesis. Al-Nahrain University, College of Science. 2006.
17. Qusay Ragheb Ali. Study and Measure the Concentration of Uranium in Soil Samples for West Baghdad Areas using nuclear track detector (CR-39). JNUS. 2009; 12 (3) : 9-15.
0 0.2 0.4 0.6 0.8 1 1.2
S1 S2 S3 S4 S5 S6 S7 S8 S9 S10 S11
C o n ce n tra ti o n o f U ra n iu m (p p m ) Code Sample 0 5 10 15 20 25 30 35 40
S1 S2 S3 S4 S5 S6 S7 S8 S9 S10 S11
18. Henryk B, Firyal B. Environmental and Health Consequences of DU Use in the 1991 Gulf War. Environ Int. 2004; 30 : 123 -134.
19. UNSCEAR United Nations Scientific Committee on the effect of Atomic Radiation. Sources, Effect, and Risks of Ionizing Radiation", Report to the general Assembly with Scientific Annexes, United Nation; 1993.
20. Zainab K Al-Ani. Study of Transfer Factor of Radionuclide's From Soil to Plant. M. Sc. Thesis, Al-Nahrain University, College of Science. 2003. 21. Mizzen H H. Measurement of radon concentrations
in the soil of different region from Anbar governorate Using CR-39 Nuclear Track Detector, JUAPS. 2010; 4 (2).
ةرودلا طسولا يفاصم ةكرش ةبرت تانيع يف موينارويلا زيكرت سايق
دادغب
–
قارعلا
قراط ةديور
يدهم
1
عزف رماث نادجو
2
هجر فلخ مساب
1
1
ةيلك ,ءايزيفلا مسق ادغب ةعماج ,تانبلل مولعلا
دادغب ,د , قارعلا .
2
دادغب ,نيرهنلا ةعماج ,مولعلا ةيلك ,ءايزيفلا مسق ,
قارعلا .
ةصلاخلا
:
ةينقت تمدختسا ثحبلا اذه يف CR-39
)ةرودلا ىفصم( طسولا يفاصم ةكرش ةبرت نم تانيع يف موينارويلا زيكرت باسحل ,
دادغب ,
يوونلا رثلاا فشاك يف موينارويلا نم ةثعبنملا افلا تاميسج راثا دع للاخ نم اهسايق مت ةبرتلا تانيع يف موينارويلا زيكرت ,قارعلا CR-39
.
م لخاد ةفلتخم عقاوم نم ةبرت تانيع عست عمج مت تانيع و ةرودلا ىفص
ىرخا جراخ عقت ةطرشلا يحو ةرايط وبا عراش قطانمل ةبرتلا نم
وه موينارويلا زيكارت لدعمب ةريغتم ميق دوجو جئاتنلا ترهظا .ةنراقملل ىفصملا 0.37
ppm عقت يتلا قطانملل ةبسنلاب اما ,ىفصملا لخاد
وه موينارويلازيكرت لدعم نا دجو ىفصملا جراخ 0.008
ppm .حومسملا يملاعلا دحلا نم لقأ جئاتنلا هذه تناكو
ا ةيحاتفملا تاملكل
فشاك, افلا تاميسج : CR-39