www.atmos-meas-tech.net/7/3667/2014/ doi:10.5194/amt-7-3667-2014
© Author(s) 2014. CC Attribution 3.0 License.
Direct aerosol chemical composition measurements to evaluate the
physicochemical differences between controlled sea spray aerosol
generation schemes
D. B. Collins1,***, D. F. Zhao1,*,***, M. J. Ruppel1, O. Laskina2, J. R. Grandquist2, R. L. Modini3,**, M. D. Stokes3, L. M. Russell3, T. H. Bertram1, V. H. Grassian2, G. B. Deane3, and K. A. Prather1,3
1Department of Chemistry and Biochemistry, University of California, San Diego, La Jolla, CA 92093, USA 2Department of Chemistry, University of Iowa, Iowa City, IA 52242, USA
3Scripps Institution of Oceanography, University of California, San Diego, La Jolla, CA 92093, USA
*now at: Institute of Energy and Climate Research, IEK-8: Troposphere, Forschungszentrum Jülich GmbH, 52425 Jülich, Germany
**now at: École Polytechnique Fédérale de Lausanne (EPFL), 1015 Lausanne, Switzerland ***These authors contributed equally to this work.
Correspondence to: K. A. Prather ([email protected])
Received: 4 June 2014 – Published in Atmos. Meas. Tech. Discuss.: 3 July 2014
Revised: 26 September 2014 – Accepted: 29 September 2014 – Published: 6 November 2014
Abstract. Controlled laboratory studies of the physical and chemical properties of sea spray aerosol (SSA) must be un-derpinned by a physically and chemically accurate represen-tation of the bubble-mediated production of nascent SSA par-ticles. Bubble bursting is sensitive to the physicochemical properties of seawater. For a sample of seawater, any im-portant differences in the SSA production mechanism are projected into the composition of the aerosol particles pro-duced. Using direct chemical measurements of SSA at the single-particle level, this study presents an intercomparison of three laboratory-based, bubble-mediated SSA production schemes: gas forced through submerged sintered glass filters (“frits”), a pulsed plunging-waterfall apparatus, and break-ing waves in a wave channel filled with natural seawater. The size-resolved chemical composition of SSA particles duced by breaking waves is more similar to particles pro-duced by the plunging waterfall than those propro-duced by sin-tered glass filters. Aerosol generated by disintegrating foam produced by sintered glass filters contained a larger fraction of organic-enriched particles and a different size-resolved el-emental composition, especially in the 0.8–2 µm dry diam-eter range. Interestingly, chemical differences between the methods only emerged when the particles were chemically analyzed at the single-particle level as a function of size;
3668 D. B. Collins et al.: Composition measurements of laboratory-generated SSA also serves as a guideline for future laboratory studies of SSA
particles.
1 Introduction
Understanding the production and characteristics of natural atmospheric aerosol particles is critical for constraining their influence on our global climate (e.g., Charlson et al., 1992; Ramanathan et al., 2001; Menon et al., 2002; Lohmann and Feichter, 2005; Carslaw et al., 2013; Ghan et al., 2013; Tsi-garidis et al., 2013) and for the accurate prediction of chemi-cal processes in the atmosphere (Andreae and Crutzen, 1997; Brown and Stutz, 2012). Sea spray aerosol (SSA) particles, which are ejected from the ocean surface through the disinte-gration of whitecap foam (Blanchard and Woodcock, 1957; Lewis and Schwartz, 2004; de Leeuw et al., 2011), repre-sent one of the most dominant types of natural atmospheric aerosol (Andreae and Rosenfeld, 2008). The production flux and physicochemical properties of SSA that are emitted over the wide range of possible oceanic conditions are not suf-ficiently constrained for proper inclusion in climate models (Lewis and Schwartz, 2004; de Leeuw et al., 2011; Quinn and Bates, 2011; Gantt and Meskhidze, 2013; Tsigaridis et al., 2013).
While SSA has long been known to consist of both in-organic salts and in-organic material (Blanchard, 1964; Duce and Hoffman, 1976; Novakov et al., 1997), field studies dur-ing the past decade have suggested that the organic fraction of marine aerosol is enhanced when the particles are ejected from seawater that is host to elevated biological activity (e.g., O’Dowd et al., 2004). Seasonal trends in organic aerosol mass supporting the influence of biological activity on SSA composition have been observed in the northern and southern midlatitudes (Yoon et al., 2007; Sciare et al., 2009), but am-bient studies cannot always unambiguously assign changes in the composition of SSA to specific primary, secondary, anthropogenic, and/or continental sources (Sorooshian et al., 2009; Shank et al., 2012).
Laboratory studies are quite commonly conducted to gen-erate and study nascent SSA that is uncontaminated by par-ticles found in the marine boundary layer that are produced by other sources. These studies produce SSA from disinte-grating foam in natural seawater or proxy materials mainly by means of sintered glass bubblers or plunging water jets. (Sellegri et al., 2006; Keene et al., 2007; Tyree et al., 2007; Fuentes et al., 2010b; Hultin et al., 2010; Bates et al., 2012; Park et al., 2014). Since it is well known that SSA is pro-duced by the bursting of air bubbles at the sea surface (e.g., Blanchard and Woodcock, 1957; Lewis and Schwartz, 2004; de Leeuw et al., 2011), the differences between generation methods for SSA in the laboratory differ primarily by the method of bubble production. Recent reports indicate that pneumatic atomization does not produce particles of similar physical or chemical properties to those generated by bubble
bursting (Fuentes et al., 2010b; Gaston et al., 2011). Until re-cently, two different bubble production techniques have been utilized for laboratory studies of aerosol composition: (1) air (or N2)forced through sintered glass filters (“frits”) (Cloke et al., 1991; Keene et al., 2007; Wise et al., 2009; Fuentes et al., 2010b; Modini et al., 2010; Park et al., 2014), and (2) imping-ing water jets (Facchini et al., 2008; Fuentes et al., 2010b; Hultin et al., 2010). A new approach introduced by Prather et al. (2013) produces SSA using reproducible breaking waves in a linear wave channel filled with natural, filtered seawater. While laboratory waves may not reproduce all of the factors that lead to SSA production over the ocean, they do produce bubble size distributions that compare favorably with those measured in whitecaps (Deane and Stokes, 2002). Conse-quently, aerosol generation by means of the wave-breaking method provides the closest proxy to natural SSA currently available in a controlled environment.
Experiments to compare the characteristics of aerosols produced using sintered glass filters, plunging water jets or waterfalls, and breaking waves have shown that each has a distinctly different and characteristic size distribution (Sell-egri et al., 2006; Fuentes et al., 2010b; Prather et al., 2013; Stokes et al., 2013). Some intercomparison studies have in-vestigated water uptake properties of the aerosol as indirect measures of composition (Fuentes et al., 2010b; King et al., 2012); however, the findings of each study depend on the spe-cific operating conditions of each bubble-mediated aerosol generation method tested. In this study, direct chemical mea-surements of SSA generated using sintered glass filters and a plunging waterfall were compared against SSA produced by laboratory breaking waves to investigate the importance of reproducing various physical elements of the wave-breaking process in the generation of nascent SSA in the laboratory. The impact of continuous bubble production, which can re-sult in the accumulation of foam at the water surface several bubble layers thick, on the composition of SSA is also dis-cussed.
2 Experimental methods
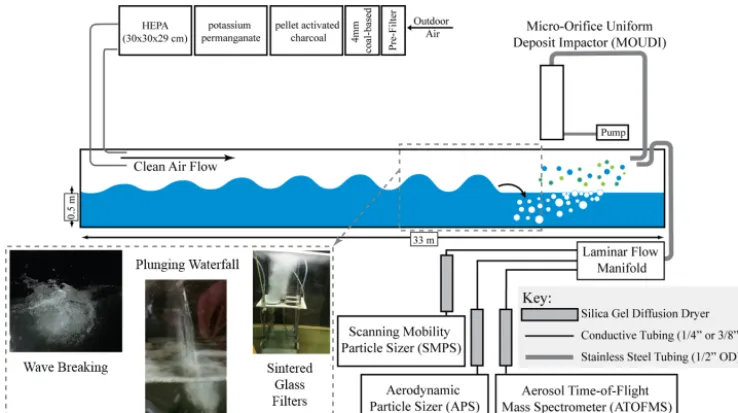
2.1 Sea spray generation methods intercomparison Sea spray aerosol particles were generated using sintered glass filters, a plunging waterfall, and breaking waves in a 33 m×0.5 m×0.6 m (length–width–water depth, 9900 L) glass-walled wave channel managed by the Hydraulics Laboratory at SIO, which has been recently adapted for ocean–atmosphere interaction studies (Prather et al., 2013), and is shown schematically in Fig. 1. Prior to each experi-ment, the wave channel was filled with natural, coastal sea-water from 275 m offshore and approximately 4 m below the low-tide line at the SIO Pier (La Jolla, CA; 32◦52.00N, 117◦15.40W). Detailed information on the seawater delivery system to the wave channel facility is provided by Prather et al. (2013). All SSA generation methods tested in these intercomparison experiments were operated using the same sample of seawater within 24 h of filling the wave chan-nel to ensure that the biogeochemical state of the seawater closely represented the natural seawater supply and chem-ical changes in the seawater itself were minimized. Sweep air that was filtered and scrubbed of reactive trace gases was supplied to the wave channel headspace continuously with a linear velocity of approximately 6 cm s−1. Bubbles were gen-erated using each of the three methods approximately 1 m up-stream of the sampling manifold, giving a particle residence time in the headspace of the wave channel of approximately 17 s.
2.1.1 Controlled breaking waves
Individual breaking waves were generated by a computer-controlled hydraulic paddle. The breaking waves were formed when a train of wave pulses of varying amplitude and speed generated at one end of the channel were focused and superimposed to form a plunging breaker at a set location along the wave channel’s long axis. This hydraulic-paddle-induced wave production at the SIO Hydraulics Laboratory wave channel facility is described in detail elsewhere (Deane and Stokes, 2002; Callaghan et al., 2013). Waves were gen-erated with a maximum frequency of 1 min−1. Bubbles en-trained in the water column by the wave-breaking event pen-etrated to approximately 15 cm below the water surface. The lack of background particle contamination was verified every 5 min by generating a wave pulse train with an amplitude in-sufficient to induce a wave-breaking event to ensure that the wave generation mechanism did not contaminate the sample. 2.1.2 Plunging waterfall
Specifically designed as a physical mimic to wave breaking, a plunging-waterfall apparatus was implemented to generate aerosol in the same location of the wave channel where wave breaking occurs. In this technique, seawater was recirculated from the wave channel through a centrifugal pump to a hor-izontal slotted cylinder approximately 40 cm above the
wa-ter surface. The recirculating flow to the wawa-terfall appara-tus was modulated with a 6 s on/6 s off cycle that allowed the foam patch at the waterfall impinging location to de-cay before plunging resumed. As a result of the modulated flow, the waterfall swept across a 30 cm×50 cm patch of the wave channel surface, disturbing the surface and form-ing bubbles throughout the swept area. This system is based on the same design criteria used to engineer the plunging-waterfall system in the Marine Aerosol Reference Tank de-scribed by Stokes et al. (2013).
2.1.3 Sintered glass filters
The setup utilized in this intercomparison was similar to that implemented by Keene et al. (2007) and is identical to that utilized by Prather et al. (2013). The distance from the top of the sintered glass filter, where bubbles are released into the water, to the water surface was approximately 35 cm, which is smaller than the 115 cm rise distance used by Keene et al. (2007). Nitrogen gas was forced through two sintered glass filters of porosity “A” (145–174 µm pore diameter) and four of porosity “E” (4–8 µm pore diameter). Each set of glass filters of a particular porosity was supplied a total of 0.5 L per minute N2gas, so that the gas flux for the two sets of bubble sizes was equal.
2.2 Foam production experiments
The impact of standing foam on SSA composition was in-vestigated using the plunging-waterfall mechanism in a Ma-rine Aerosol Reference Tank (MART) system (Stokes et al., 2013). The plunging waterfall utilized in the intercompari-son experiment performed in the wave channel (Sect. 2.1.2) is mechanistically similar to the aerosol generation system implemented in the MART. The plunging waterfall was op-erated in two modes: “continuous” and “pulsed”. While in “continuous” mode, the waterfall was continuously gener-ated by recirculating water from the bottom of the tank to the waterfall apparatus suspended above the water surface through a centrifugal pump. In “pulsed” mode, the recircu-lation flow to the waterfall apparatus was modulated with a 4 s on, 4 s off pattern. During the “on” cycle, the flow rate of water was approximately 40 L per minute.
3670 D. B. Collins et al.: Composition measurements of laboratory-generated SSA
Figure 1. Schematic of the linear wave channel with interchangeable bubble generation apparatuses for SSA production. Each of these
bubble generation mechanisms were tested within the wave channel within 24 hours, and with the same natural seawater sample.
place over the course of 1 to 2 weeks, in which the large majority of the autotrophic biomass consisted of diatoms. Proliferation of heterotrophic bacteria was observed upon phytoplankton senescence in agreement with the canonical view of biological processes active within the microbial loop (Pomeroy et al., 2007). Chlorophyllaconcentrations reached as high as 140 mg m−3and then subsided to 20 mg m−3, at which time the foam production experiments were conducted (Sect. 3.2). Autotrophic organisms, the abundance of which is indicated through the chlorophyllaconcentration, are well known to exude organic material, increasing the organic mat-ter concentration in the seawamat-ter throughout the bloom life-time. Heterotrophic organisms (e.g., bacteria, grazers) then process these organic exudates (Ogawa et al., 2001; Teeling et al., 2012), chemically altering the dissolved organic matter produced by the autotrophic biomass. This method of enrich-ing the seawater with organic matter allows for natural dy-namic ecosystem processes to shape the composition of the organic matter in the seawater, similar to the types of inter-actions found in natural phytoplankton blooms (Azam and Malfatti, 2007; Pomeroy et al., 2007; Teeling et al., 2012). While the total chlorophylla concentration in these experi-ments is an indirect indicator of the autotrophic biomass, it is notable that various controlled SSA generation studies have shown that the amount of organic matter imparted to SSA is only a weak function of the seawater chlorophyll concen-tration, and depends instead on the amount and composition of organic matter in the seawater (Ault et al., 2013; Collins et al., 2013; Prather et al., 2013; Park et al., 2014; Quinn et al., 2014). Total organic carbon (TOC) concentrations in the seawater were measured by means of the high temperature combustion method (Shimadzu Scientific Instruments) after acidifying the sample with 12N hydrochloric acid. While the
exact molecular identity of the organic compounds in the seawater in these experiments was not known, the compo-sition of the seawater utilized in this experiment can be rea-sonably expected to be more chemically similar to regions of the ocean that are naturally organic-matter-enriched than a salt water mixture doped with organic proxy molecules. This experiment therefore also benefits from naturally accu-rate influences of organic matter physicochemical properties on bubble physics and sea surface microlayer properties. 2.3 Aerosol measurements
All aerosol measurements were conducted after passing the sample through silica gel diffusion driers to attain a relative humidity < 15 %. Number size distributions of aerosol parti-cles were measured using a scanning mobility particle sizer (SMPS) for particles with mobility diameters (dm)between 0.013 and 0.7 µm, and an aerodynamic particle sizer (APS) for particles with aerodynamic diameters (da) between 0.6 and 20 µm. Size distributions from these two different instru-ments with different size metrics were unified by converting bothdm andda to the physical diameter (dp)according to Eqs. (1) and (2) (DeCarlo et al., 2004), assuming all parti-cles were spherical and had a density (ρp)of 1.8 g cm−3 (Ze-lenyuk et al., 2007) and a reference density (ρ0)of 1 g cm−3.
dp=dm (1)
dp=da
ρ
0 ρp
1/2
(2)
dm by 8 %, and would increasedp derived fromda by 4 % (DeCarlo et al., 2004). SSA is an external mixture of parti-cles with different compositions and physicochemical prop-erties (Collins et al., 2013; Prather et al., 2013), including size-dependent differences in morphology (Ault et al., 2013). Caution is therefore encouraged when making quantitative comparisons between SSA size distributions reported using different methods.
The size-resolved chemical composition of SSA was characterized by aerosol time-of-flight mass spectrometry (ATOFMS). Two ATOFMS instruments were used in paral-lel: one was fitted with a converging nozzle inlet (Gard et al., 1997) and measured particles with vacuum aerodynamic di-ameters (dva)between 0.5 and 3 µm, while a second, using an aerodynamic lens inlet (Su et al., 2004), measured par-ticles with dva between 0.1 and 2.5 µm. In both ATOFMS instruments, particles transmitted through the inlet reach a size-dependent terminal velocity in a differentially pumped vacuum chamber, where they intersect two continuous wave lasers (532 nm; 50 mW) positioned at a fixed distance along the flight trajectory. The light scattered as the particle inter-sects each beam is collected and the time between each set of light scatter pulses is used to determine the velocity of each particle. Particle velocities are translated to dva using a calibration curve generated using polystyrene latex (PSL) spheres of known diameter (density=1.05 g cm−3). In order to make convenient correspondence with the number size dis-tributions presented herein,dvawas converted todpusing the density of PSL in this case forρ0(Eq. 3); however, caution in making comparisons is again encouraged due to the inher-ent morphology and density assumptions required for con-versions between size metrics.
dp=dva ρ0 ρp
(3) The measured particle velocity is also used to trigger a pulsed, Q-switched Nd:YAG laser (266 nm; 1.3 mJ; 7 ns) that intersects each particle in the ion source region of the mass spectrometer, where particle desorption and ionization occur using a single laser pulse. Positive and negative ion time-of-flight mass spectra are obtained for each particle. Informa-tion about the ATOFMS is provided in greater detail in prior publications (Gard et al., 1997; Su et al., 2004). ATOFMS data were post-processed using the YAADA toolkit (http: //www.yaada.org) for Matlab (The MathWorks Inc.). Parti-cles were classified according to their mass spectral signa-tures using a neural network algorithm, Art-2a (Song et al., 1999), with a vigilance factor of 0.85 and a learning rate of 0.05. The resulting clusters were refined by computation-ally regrouping with a threshold of 0.90. Five distinct parti-cle types (Fig. 2) were formed by manually grouping Art-2a classes based on their characteristic mass spectra based on the classifications described by Prather et al. (2013).
In addition to in situ single-particle composition mea-surements using ATOFMS, SSA samples were collected for
1.0 0.8 0.6 0.4 0.2 0.0
Relative Ion Area (A.U.)
-150 -100 -50 0 50 100 150
Mass-to-Charge Ratio (m/z)
23 Na+ 40 Ca+ 75,77 CaCl+ 56 CaO+ 57 CaOH+ -35,-37 Cl --26 CN -Carbohydrate -42 CNO -Carbohydrate -79 PO3 --129,-131,-133 MgCl3 -Carbohydrate
Organic Dominated (OC) 1.0 0.8 0.6 0.4 0.2 0.0
Relative Ion Area (A.U.)
-150 -100 -50 0 50 100 150
Mass-to-Charge Ratio (m/z)
24 Mg+ 40 Ca+ 107,109 Ag+ 54,56 Fe+ -35,-37 Cl --26 CN --42 CNO -Carbohydrate -79 PO3 --129,-131,-133 MgCl3 -Biological (Bio) 63 CrO+ Carbohydrate Carbohydrate 1.0 0.8 0.6 0.4 0.2 0.0
Relative Ion Area (A.U.)
-150 -100 -50 0 50 100 150
Mass-to-Charge Ratio (m/z)
23 Na+ 39 K+ 40 Ca+ 81,83
Na2Cl
+ 56 KOH+ 56 CaO+ -35,-37 Cl --26 CN --23 Na --42 CNO --58 NaCl --93,-95,-97 NaCl2 --129,-131,-133 MgCl3
-Sea Salt (SS)
1.0 0.8 0.6 0.4 0.2 0.0
Relative Ion Area (A.U.)
-150 -100 -50 0 50 100 150
Mass-to-Charge Ratio (m/z)
23
Na+
39
K+
40
Ca+ 81,83Na2Cl
+ 56 KOH+ 56 CaO+ -35,-37 Cl --26 CN --23 Na --42 CNO --58 NaCl --93,-95,-97 NaCl2 --129,-131,-133 MgCl3
-Sea Salt with Organic Carbon (SS-OC)
Figure 2. Representative mass spectra for each of the particle types
described in this study.
offline analysis by scanning electron microscopy (SEM). Aerosol samples were deposited on silicon wafer substrates using a micro-orifice uniform deposit impactor (MOUDI; MSP Corporation). SEM images were collected using a Hi-tachi S-4800 scanning electron microscope with a 5 kV accelerating voltage and a 9.2–9.6 mm working distance. Single-particle analysis was performed using computer-controlled SEM combined with an IXRF Systems energy dispersive X-ray (EDX) spectrometer (CCSEM/EDX). EDX data were analyzed with Iridium Ultra software (IXRF Systems) for automated particle analysis. The computer-controlled system analyzes the sample on a field-by-field ba-sis. Once particles are identified in a field of view, the soft-ware acquires an X-ray spectrum for each particle. X-ray spectra were acquired for 20 s at a beam current of 15 µA and an accelerating voltage of 5 kV. Particle size was deter-mined by automated measurement of the area of each parti-cle. The area-equivalent diameter (dae)was then calculated using Eq. (4):
dae=
4A
π
1/2
3672 D. B. Collins et al.: Composition measurements of laboratory-generated SSA
Table 1. Tabulated number of particles analyzed by SEM-EDX in
each size bin.
dae Sintered Plunging Wave
(µm) glass filters waterfall breaking
0.3–0.4 166 171 54
0.4–0.5 76 75 41
0.5–0.6 29 42 37
0.6–0.7 17 37 31
0.7–0.8 13 49 28
0.8–0.9 38 48 32
0.9–1.0 31 29 27
1.0–1.1 35 38 28
1.1–1.2 25 29 25
1.2–1.3 20 41 22
1.3-1.4 14 44 26
1.4–1.5 11 45 30
1.5–1.7 16 59 45
1.7–1.9 33 62 27
1.9–2.1 26 52 33
2.1–2.3 20 36 17
2.3–2.5 18 19 13
2.5–2.7 23 13 9
2.7–3.0 17 5 6
Total
0.3–3.0 678 963 546
whereAis the geometric area of the particle in the image. Conversion of area equivalent diameter to physical diameter for particles deposited on MOUDI substrates are associated with an uncertainty in particle shape. The shape of particles deposited on a substrate depends on viscosity and surface tension (O’Brien et al., 2014), neither of which are known for SSA. Consequently, particle sizes within the CCSEM/EDX analysis were not converted todp.
In total, 2187 particles withdaebetween 0.3 and 3 µm were analyzed. Any particle intersected by the boundary of the image was neglected to ensure that only particles that were completely imaged are included in the analysis. All mea-sured particles were segregated into size bins for analysis. The number of particles analyzed in each size bin for each aerosol generation method can be found in Table 1.
3 Results
3.1 SSA generation method intercomparison
The physicochemical properties of SSA particles have been associated with the physical characteristics of bubbles in many prior publications (e.g., Blanchard and Woodcock, 1957; Lewis and Schwartz, 2004; Sellegri et al., 2006; Fuentes et al., 2010b; de Leeuw et al., 2011; King et al., 2012); however, direct comparison with SSA produced by a breaking wave in the laboratory, assumed to be a good proxy
for nascent sea spray, has only recently been realized (Prather et al., 2013). The physicochemical characteristics of aerosol production from bubble bursting have been linked not only to the size distribution of SSA (Sellegri et al., 2006; Fuentes et al., 2010b; Zábori et al., 2012) but also to the water uptake properties of SSA particles (Fuentes et al., 2010b; King et al., 2012). This study extends prior investigations by directly probing the influence of bubble-bursting mechanisms on the detailed composition of SSA particles using direct chemical measurements at the single-particle level.
As discussed earlier, aerosol particles were generated us-ing breakus-ing waves, a plungus-ing waterfall, and sintered glass filters in natural seawater. The laboratory breaking waves used here have bubble size distributions that are represen-tative of those observed in open-ocean waves (Deane and Stokes, 2002) and particles from the breaking waves are taken to be the best proxy for oceanic SSA. As discussed by Prather et al. (2013), the number size distribution of SSA particles derived from sintered glass filters had a modal diam-eter of approximately 60 nm, whereas the plunging waterfall and wave-breaking particles exhibit modal diameters of ap-proximately 190 and 200 nm, respectively (Fig. 3b). The dif-ferences in size distribution shape and modal diameter sug-gest that the dominant SSA production mechanism of SSA from the sintered glass filters could be different from SSA produced by wave breaking and the plunging waterfall. On the other hand, differences in the number size distribution of aerosols produced by each method could feasibly result from simple scaling of aerosol sizes to the bubble sizes (as is ac-cepted for the jet droplet mechanism; Lewis and Schwartz, 2004), since bubbles from the sintered glass filters did not produce bubbles larger than 1 mm (Prather et al., 2013). If this were the case, the size-resolved composition and mixing state of the SSA produced by each method would be expected to be identical.
3.1.1 Mixing state measurements by ATOFMS
1.0 0.8 0.6 0.4 0.2 0.0
6 7 8
0.1
2 3 4 5 6 7 8
1 Physical Diameter (dp; µm)
1.0 0.8 0.6 0.4 0.2 0.0 1.0 0.8 0.6 0.4 0.2 0.0
Number Fraction (ATOFMS)
0.1 2 3 4 5 6 7 8 1 2
Vacuum Aerodynamic Diameter (dva; µm)
Wave Breaking
Plunging Waterfall
Sintered Glass Filters
1000 0
ATOFMS Total Counts
(a)
SS SS-OC
Biological OC
Other
0.001 0.1 10 1000
0.01
2 4
0.1
2 4
1
2 4
10 Physical Diameter (dp; µm)
0.001 0.1 10 1000
Number Conc. (dN/dlogD
p
; cm
-3 )
0.001 0.1 10 1000 (b)
Figure 3. (a) Size-resolved chemical composition of SSA particles
measured by ATOFMS for each bubble/aerosol generation method, noted in white text. The vertical scale indicates the number fraction of particles sampled by ATOFMS. The grayscale bar at the top of each panel indicates the number of particles sampled in each size bin. (b) Number size distributions measured by SMPS and APS, corresponding to the data shown in (a). The sintered glass filter method generates a significantly different number size distribution of SSA particles and shows an enhancement in organic-rich parti-cles in thedva=0.8–2 µm range, when compared with the other two generation methods. The second size axis in (a) labeled “Physical Diameter” is provided for comparison with (b), noting that dva is the size metric directly measured by ATOFMS.
by a larger ratio of organic marker ions (CN− and CNO−, for example) to chloride. In addition, the contribution of salt ion clusters (NaCl−2, MgCl−3)is greater in the SS-OC type than in the SS type, and the total absolute intensity of these mass spectra were smaller than for SS. Particles within the SS-OC type had a similar size distribution to SS-OC par-ticles measured by transmission electron microscopy with energy dispersive X-ray analysis (TEM-EDX) in prior stud-ies of nascent SSA produced by wave breaking (Ault et al., 2013; Prather et al., 2013). It is notable that both the SS and SS-OC types have different size distributions and mass spec-tral signatures, yet both contain markers for organic material (e.g., CN−). The “biological” (Bio) particle type is charac-terized by the presence of positive ion markers for Mg, Ca, and transition metals with organic nitrogen, phosphate, and carbohydrate negative ion markers (Pratt et al., 2009; Guasco et al., 2013). The “organic carbon-dominated” (OC) particle type has a large Ca ion marker, with Na also present but to a smaller degree than in the SS and SS-OC types. The negative ion spectrum contains markers for organic nitrogen, carbo-hydrates, phosphate, and chloride. The presence of Ca in this particle type is in correspondence with CCSEM/EDX anal-ysis presented below and discussed further in Sect. 3.1.2 in the context of the marine organic matter literature.
Particles withdva> 1 µm were characterized by large num-ber fractions of SS and Bio particles, while particles with dva< 1 µm were dominated by SS-OC and OC particles. The size-resolved chemical composition of SSA produced by each of the bubble generation methods shown in Fig. 3a is shown alongside the corresponding number size distributions for each method in Fig. 3b. The sampling efficiency for par-ticles withdva> 1 µm in these experiments was greater than for particles with dva< 1 µm. Therefore, the ability for the ATOFMS to chemically speciate particles at sizes approach-ingdva=0.1 µm was dependent on the number concentra-tion of particles present at that size. The sintered glass filters produced approximately 10-fold higher size-resolved num-ber concentrations than the other two methods (Fig. 3b).
The fraction of OC particles is higher for all mea-sured sizes in the sintered-glass-filter-generated SSA parti-cles compared to wave breaking, whereas the overexpression of OC particles from the plunging waterfall is more mod-erate. A slightly larger number fraction of biological parti-cles with dva> 1 µm was also observed in the aerosol gen-erated by plunging waterfall and sintered glass filters, com-pared with wave breaking. Overall, the fraction of organic and biological SSA particles generated in these experiments increases with a distinct trend: wave breaking < plunging wa-terfall < sintered glass filters. This trend is especially evident in the supermicron size range, which is also the size range containing the majority of the chemically characterized par-ticles in this study. These ATOFMS results indicate that the size-resolved composition of SSA is directly affected by the physical mechanism of bubble generation.
3.1.2 Elemental composition measurements by electron microscopy
par-3674 D. B. Collins et al.: Composition measurements of laboratory-generated SSA
32 1
2
3
Figure 4: Elemental composition of particles produced via (a.) plunging waterfall (PW) and 4
(b.) sintered glass filters (SGF), compared to particles produced via wave breaking (WB). The 5
comparison is made using the ratio of the EDX intensities (counts per second) for Mg, K, and 6
Ca referenced to Na in SSA particles. Deviation from unity indicates differences in chemical 7
composition. The number of particles in each size bin can be found in Table 1. 8
9
10
11
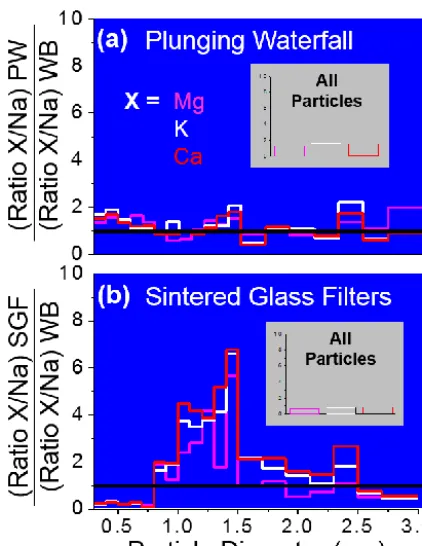
Figure 4. Elemental composition of particles produced via (a)
plunging waterfall (PW) and (b) sintered glass filters (SGF), com-pared to particles produced via wave breaking (WB). The compari-son is made using the ratio of the EDX intensities (counts per sec-ond) for Mg, K, and Ca referenced to Na in SSA particles. Devia-tion from unity indicates differences in chemical composiDevia-tion. The number of particles in each size bin can be found in Table 1.
ticles withdae< 0.8 µm, these ionic species are depleted rela-tive to wave-generated SSA, shown byX/ Na ratios less than 1. It is important to note that the enhancement and deple-tion ofX/ Na ratios relative to wave-generated particles only emerges when their size-resolved composition is measured. Despite the significant deviations from unity observed in the size-resolved particles produced by the sintered glass filter, all three of the elemental ratio comparisons are close to unity when averaged over all particle sizes (Fig. 4, insets). This disparity between the two means of analysis highlights the importance of making size-resolved single-particle measure-ments due to inherent chemical heterogeneity in an externally mixed aerosol.
Common results from both ATOFMS and CCSEM/EDX analyses are the enrichment of Mg, Ca, and K in SSA generated by sintered glass filters in supermicron particles. ATOFMS measurements show that these cations are mainly localized to OC and biological SSA particles (Fig. 2). The tendency for inorganic cations to coordinate, or strongly as-sociate, with organic and biological material in the ocean and in SSA particles has long been recognized (e.g., Duce and Hoffman, 1976). Divalent cations, such as Mg2+ or Ca2+, have the ability to stabilize organic supramolecular
struc-tures (Verdugo, 2012) and coordinate surface-active organic ligands at interfaces (Casillas-Ituarte et al., 2010). Magne-sium has been shown to be a good tracer for SSA produced from bacteria-rich seawater (Guasco et al., 2013) and has been observed in aerosol over the ocean in association with biological activity (Gaston et al., 2011). Hence, the enrich-ment of Ca, Mg, and K in the 1–1.5 µm size range in the CC-SEM/EDX analysis is in good agreement with the ATOFMS results, which show an increased fraction of OC and biolog-ical particles from the sintered glass filter-generated SSA in this same size range, relative to wave production. The deple-tion of Mg, K, and Ca in particles withdae< 0.8 µm observed by CCSEM/EDX suggests that smaller particles have chemi-cal trends opposite those withdae> 1 µm. ATOFMS measure-ments did not achieve sufficient sampling statistics for de-tailed comparative analysis. Consequently, any suppression of organic matter in the dae=0.1–0.8 µm size range could not be dually corroborated and should be a topic of future work.
3.1.3 Internal mixing state particles of SS-OC particles
The trend of increasing organic matter enrichment in SSA by plunging waterfall and sintered glass filters compared to wave breaking is not restricted to the variety of particle types observed. Individual types of SSA particles, described in Sect. 3.1.1, often contain mixtures of chemicals within each particle; this is referred to as the “internal” mixing state. The size-resolved fraction of particles containing sea salt mixed with organic carbon (SS-OC) does not appear to change sig-nificantly across the three methods (Fig. 3); however, the amount of organic matter in SS-OC particles is different for each bubble generation method. Figure 5 shows the fraction of SS-OC particles that contain mass spectral markers for organic matter, binned by the area under each ion marker peak (an indicator of the quantity of each species in the parti-cle). The fraction of particles that contain NaCl and each or-ganic marker, as well as the oror-ganic ion marker peak area, in-crease with the same pattern as described previously: break-ing waves < plungbreak-ing waterfall < sintered glass filters. There-fore, even within the SS-OC particle type, organic matter is enriched in SSA particles generated by sintered glass filters, while the plunging waterfall produced only a moderate en-richment in organic matter compared to breaking waves.
1.0 0.8 0.6
0.4 0.2 0.0 1.0
0.8 0.6 0.4
0.2 0.0
Number Fraction (ATOFMS)
1.0 0.8
0.6 0.4 0.2
0.0
Plunging Waterfall
Sintered Glass Filters CN- (m/z -26)
CH3COO- (m/z -59)
PO3- (m/z -79) SS-OC Particle Type
ATOFMS Peak Area (Arb. Units) 10000-20000 5000-10000
1000-5000 500-1000
100-500 50-100
Wave Breaking
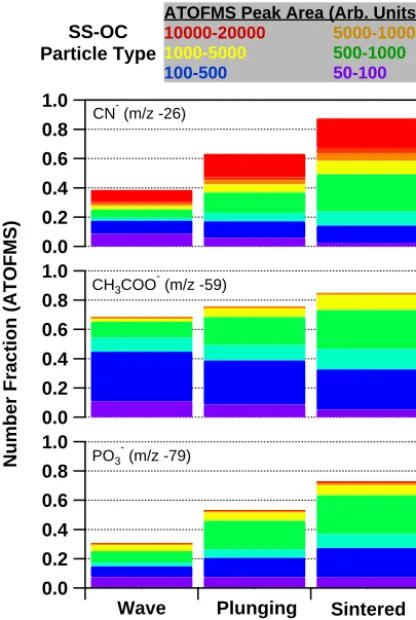
Figure 5. Colstack plots showing ATOFMS ion markers for
or-ganic nitrogen (CN−), oxygenated organic carbon (CH3COO−), and phosphate (PO−3), considering only particles composed of an internal mixture of sea salt and organic compounds (SS-OC) all sizes. The vertical axis indicates the number fraction of SS-OC particles whose mass spectrum includes each marker, with the color indicating the peak area of the marker. Notice that, from left to right, a larger fraction of SS-OC particles contain these or-ganic/biomolecule marker ions; the peak area also increases, sug-gesting that each particle contains more of each chemical species moving from left to right.
method (Eq. 5). C=4π A
P2 , (5)
where A is the area of an individual particle and P is its perimeter. Particles were counted as either spherical, if C was within 10 % of the value for an ideal sphere (C=1.00±0.10), or cubic, if C was within 10 % of the value for an ideal cube (C=0.79±0.08). Only the “core” of each particle was accounted for in the circularity deter-mination; “shadows” observed around the particles were ne-glected. It was found that 56 % of the SSA particles gener-ated by sintered glass filters were classified as spherical un-der vacuum, whereas 44 % of the SSA particles generated by the plunging waterfall and 32 % of the SSA particles gen-erated by wave breaking were classified as spherical. Less
than 1 % of the particles measured were characterized as nei-ther spherical nor cubic. For particles that are composed of a mixture of sea salt and organic matter (e.g., SS-OC parti-cles), it has been shown previously that increasing circularity is associated with a greater organic/inorganic volume mixing ratio as cubic crystallization is inhibited (Laskin et al., 2012; Ault et al., 2013). Hence, agreement was observed between the SEM morphology analysis and single-particle analysis by ATOFMS: particles generated by the sintered glass filter method contain more organic matter.
3.2 Continuous foam formation and SSA composition Natural SSA is mainly produced by whitecaps in the ocean, which are episodic in nature (de Leeuw et al., 2011). The vis-ible white area on the sea surface during and subsequent to a wave-breaking episode is due to the presence of foam, a col-lection of bubbles floating at the air–sea interface, each sep-arated from the next by a thin liquid film (Bikerman, 1973). Whitecap foam persistence, measured in terms of its expo-nential decay time, lies mostly in the range of 2–4 s, oc-casionally extending to times as long as 10 s (Callaghan et al., 2012). The discrete, episodic nature of wave breaking in the natural environment and in wave channel experiments re-ported here (mimicked also by the duty cycle of the plung-ing waterfall) is in contrast to the behavior of continuously generated bubble plumes from sintered glass filters. Con-tinuous production of bubbles results in a persistent surface foam, which has been implicated in alterations to SSA pro-duction mechanisms (Keene et al., 2007; Tyree et al., 2007) and water uptake properties (King et al., 2012). These obser-vations led to the investigation of the role of time-modulated (or “pulsed”) versus continuous bubble generation on parti-cle production. Using a MART system (Stokes et al., 2013), which produces aerosol through a plunging-waterfall appa-ratus similar to that implemented in the wave channel inter-comparison experiments described above, the sensitivity of SSA composition to the intermittent nature of the plunging waterfall was tested using both unamended natural seawa-ter ([TOC]=85 µM) and organic-enriched natural seawater ([TOC]=400 µM) as described in Sect. 2.2.
3.2.1 Size distributions
plung-3676 D. B. Collins et al.: Composition measurements of laboratory-generated SSA
Figure 6. SEM images of particles generated by each of the three laboratory SSA generation mechanisms considered in this study (two
images shown for each case). All samples are dried in the vacuum of the SEM during the analysis process. The increased circularity of the particle cores is visible when comparing the sintered glass filter SSA samples to the plunging-waterfall and wave-breaking samples.
ing in the same seawater. Continuous plunging resulted in a tank-wide layer of foam that accumulated on the water sur-face, whereas surface foam had a patchy character when the plunging waterfall was pulsed at 4 s intervals. The reduced concentration of particles withdp> 0.3 µm during continuous plunging could be due to weakened jet droplet production, and will be discussed in further detail in Sect. 4.3.
The correlation of changes in the size distribution for dp< 0.05 µm with particles having dp> 0.3 µm suggests a physical link between the production mechanism of both large (dp> 0.3 µm) and small (dp< 0.05 µm) SSA particles. The presence of a significant surface foam layer appeared to enhance the production of SSA withdp=0.05–0.125 µm, suggesting that cap film breakup plays a significant role in the production of SSA particles in this limited size range. Hence, this type of deliberate foam accumulation experiment is a po-tentially useful tool for isolating the production mechanism of SSA particles via thin fluid film fragmentation for more detailed studies.
3.2.2 Chemical composition
The chemical composition of SSA produced via continuous and pulsed plunging were indistinguishable when generated from unaltered natural seawater (Fig. 8a, c). However, con-tinuous plunging in organic-enriched natural seawater was associated not only with a change in the SSA particle size distribution (Fig. 7) but also with more organic matter in SSA particles sampled by ATOFMS (Fig. 8b). For instance, the fraction of SS-OC particles measured by ATOFMS that con-tained organic carbon markers, as well as the area under the organic carbon marker peaks in the SS-OC particles’ mass
spectra, was substantially higher in SSA produced by contin-uous plunging, as compared to pulsed plunging in organic-enriched seawater (Fig. 8). This finding is in general agree-ment with the response of cloud condensation nuclei activity to foam buildup in a similar type of laboratory experiment utilizing sodium laurate as a surface-active chemical proxy for dissolved organic matter (King et al., 2012). Achieving similar results to those of King et al. (2012) in this study with only 1 % of the concentration of organic material rein-forces the critical importance of the naturally complex chem-ical composition of organic matter used to alter the seawater in this and other recent laboratory SSA experiments (Fuentes et al., 2010a; Moore et al., 2011; Ault et al., 2013; Collins et al., 2013; Prather et al., 2013). The differences observed in SSA composition between the pulsed and continuous plung-ing modes explored here stress the importance of preservplung-ing the transient nature of surface foam inherent to the wave-breaking process in the production of SSA in the laboratory when concentrations of organic matter in the seawater are el-evated.
4 Discussion
800
600
400
200
0
Number Conc. (dN/dlogd
p
; cm
-3 )
0.01
2 4 6
0.1
2 4 6
1
2 4 6
10 Particle Diameter (dp; µm)
Seawater [TOC] = 400 µM
Continuous Plunging Pulsed Plunging
(b.) 800
600
400
200
0
Number Conc. (dN/dlogd
p
; cm
-3 )
0.01 2 4 60.1 2 4 6 1 2 4 6 10 Particle Diameter (dp; µm)
Seawater [TOC] = 85 µM
Continuous Plunging Pulsed Plunging
(a.)
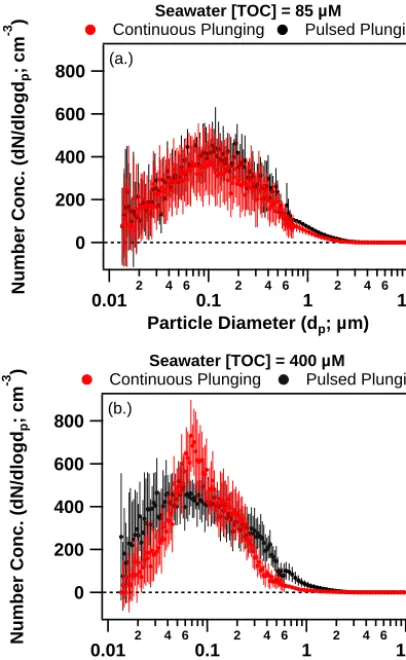
Figure 7. Number size distributions for MART-generated SSA
par-ticles using continuous (red) and pulsed (black) plunging-waterfall modes (±1σerror bars). The change in the shape of the size distri-bution is clearly evident between the continuous and pulsed plung-ing cases when the seawater is enriched with organic matter. Con-centrations of particles withdp> 0.3 anddp< 0.05 µm are smaller during continuous plunging, indicating a change in the SSA particle production mechanism due to the overproduction of foam.
4.1 Bubble-mediated surfactant transport
As described in detail above, the size-resolved chemical composition of SSA generated by sintered glass filters con-tains a larger number fraction of OC particles in the super-micron size range than are found in SSA from breaking waves (Figs. 3 and 4). In addition, particles within the SS-OC type, which do not show as significant a change in number fraction as the OC particles, still undergo an enrichment in organic matter from sintered glass filter production, as com-pared to SSA from wave breaking and plunging waterfall (Figs. 5 and 6). As discussed by Prather et al. (2013), the bubble size distribution produced by the sintered glass filter setup did not produce bubbles with radius > 1 mm. Subsur-face bubbles are known to scavenge surSubsur-face-active material from the water column and transport the organics to the sea surface (Liss, 1975). Since the efficiency of surfactant
3678 D. B. Collins et al.: Composition measurements of laboratory-generated SSA
Figure 8. (a, b) Comparison of color-stack plots generated by sampling SSA produced by a plunging waterfall under “continuous” bubble
generation versus “pulsed” (4 s on/off) bubble generation. Large differences in SSA composition are observed when seawater organic matter concentrations are high ([TOC]=400 µM), coinciding with major differences in surface foam accumulation between the generation modes. Only SS-OC particles are considered in (a) and (b). On the right, (c) shows a matrix of pie charts indicating the fractional contribution of each of the particle types to SSA from both pulsed and continuous plunging with both low (85 µM) and high (400 µM) organic matter concentrations in the seawater.
Plunging
WaterFoam Accumulation
Turbulent
Mixing Bubble
Scavenging Trapped Bubbles
Film Drainage
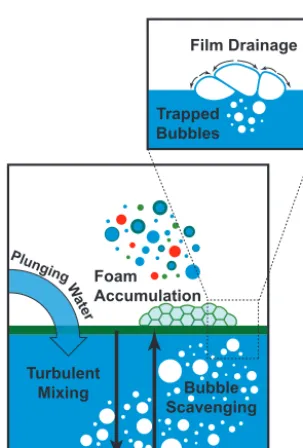
Figure 9. Process diagram of SSA production depicting phenomena
described in Sect. 4.
4.2 Surface water mixing
In the breaking wave and plunging-waterfall mechanisms, mixing of sea surface material back into the water column is a phenomenon that counteracts bulk-to-surface transport of surface-active organic matter by the rising bubble plume. Vertical mixing of surface water was observed concurrently with air entrainment and bubble generation in prior wave channel studies of plunging breakers (Rapp and Melville, 1990), and is expected to translate to bubble entrainment by
the plunging waterfall due to the similarity of the bubble for-mation processes between these two SSA generation meth-ods. The lack of mixing of the organic-enriched SML back into the water column, as is likely the case for sintered glass filters due to the lack of surface penetration, could also con-tribute to the observed enhancements of organic matter in SSA relative to wave breaking, as described above. The re-sults provided in this study suggest that generating aerosol using a technique where surface-active organic material is mixed back into the water column provides a similar mitiga-tion of organic enrichment in the SML. Based on this expla-nation, the composition of SSA from the plunging waterfall suggests that the surface water mixing regime lies between that of wave breaking and sintered glass filters.
4.3 Foam layer accumulation
The impact of a layer of accumulated, persistent foam on SSA production was investigated by comparing the size dis-tribution and composition of SSA produced from the plung-ing waterfall in pulsed and continuous operation. The two op-eration modes produced SSA differently only while the sea-water was enriched with organic matter ([TOC]=400 µM), and a persistent layer of foam was observed on the water sur-face.
concentration (60–85 µM), but not when using seawater that is enriched with organic matter (Figs. 7 and 8). Addition of soluble surfactants to salt water is known to increase bubble lifetime (Modini et al., 2013), and can lead to more persistent whitecap foam following a breaking wave event (Callaghan et al., 2013). The properties of persistent foam are temporally dynamic. Foam cell size distributions are subject to fluid film rupture, which gives rise to processes which can both coarsen the foam by coalescence (e.g., Colin, 2012) and cause foam fining through daughter bubble production (Bird et al., 2010). Direct measurements of aerosol production with quantitative measurements of foam properties have not been shown in the literature to date; however, results shown in Sect. 3.2, along with those reported by King et al. (2012), indicate that foam properties can exert a significant influence on the physical and chemical characteristics of SSA.
As bubbles age on the seawater surface, the cap films are known to drain and thin; these types of time-dependent pro-cesses have been shown to influence aerosol production in single bubble experiments (Modini et al., 2013). In this study, the production of SSA particles from persistent foam that is greater than one bubble layer thick (continuous plunging, high [TOC]) was associated with increased organic matter in the particles compared to SSA generated from the bursting of bubbles while a less pronounced foam layer existed (pulsed plunging, low [TOC]; Fig. 8). We hypothesize that foam bub-ble bursting could (1) preferentially produce particles that are more enriched in organic matter than free bubbles bursting at the air–sea interface due to bubble cap film draining and thin-ning processes, and/or (2) droplets produced by the bursting of thin fluid films (film drops) are inherently enhanced in or-ganics as a result of their production mechanism. While these hypotheses are not mutually exclusive and the former would require further detailed measurements, the latter concept is supported by the coincidence of the accepted film droplet size distribution (Lewis and Schwartz, 2004; de Leeuw et al., 2011) and the size-resolved enhancement of organic matter in nascent, submicron SSA particles (e.g., Keene et al., 2007; Facchini et al., 2008; Gantt and Meskhidze, 2013; Prather et al., 2013).
The existence of a layer of foam on the seawater surface was also associated with a change in the shape of the SSA size distribution (Fig. 7). The low concentrations of SSA particles with dp> 0.3 µm is perhaps indicative of reduced aerosol production by the jet droplet mechanism, based on particle size (Lewis and Schwartz, 2004; de Leeuw et al., 2011). The existence of the foam layer on the seawater sur-face may be capable of prohibiting or curtailing jet droplet production by assimilating rising bubbles into the foam layer prior to rupture. The mechanism for jet droplet formation via rapid retraction of surface water within the cavity (Lewis and Schwartz, 2004) of a bursting bubble is likely to be impossi-ble in the absence of a continuous liquid phase beneath the bursting bubble, as in a foam that is greater than one bub-ble layer thick. In addition, we suggest that jet droplets that
may have formed beneath the foam layer would have been sequestered by the overlying foam, causing a reduction in jet droplet introduction to the air above the foam (Fig. 9, in-set). In either case, the reduced formation of particles with dp> 0.3 µm when a persistent layer of foam was observed clearly links a change in SSA production with surface foam accumulation.
5 Conclusions
Due to uncertainties in the projections of global climate that stem from natural aerosol sources, detailed studies of SSA in controlled environments approximating preindustrial con-ditions are of great importance (Menon et al., 2002; Ghan et al., 2013; Tsigaridis et al., 2013). At the same time, con-trolled laboratory studies that utilize physicochemically ac-curate SSA production taking into account realistic biogeo-chemical systems are critical for developing an understand-ing of natural geochemical and geophysical interactions that influence the global climate system. It has been shown in this study that the composition of laboratory-generated SSA was inherently sensitive to the physicochemical environment (controlled by the bubble production mechanism) in which bubbles were generated and allowed to burst. In addition, the pulsed or periodic nature of bubble production was impor-tant in controlling the transfer of organic matter to SSA via surface foam accumulation when high concentrations of or-ganic matter are present in the seawater. Based on the results presented in Sect. 3.2, it is also shown that SSA production studies with accumulated foam layers can be a useful tool in enhancing the formation of SSA via thin fluid film rupture.
3680 D. B. Collins et al.: Composition measurements of laboratory-generated SSA possible that a careful redesign of the sintered glass filter
setup used in this study could allow for SSA production that more closely matches the wave-breaking method described in this study. In general, new SSA generation schemes should not only replicate the bubble size distribution of open ocean waves but also the inherently turbulent and discrete nature of the wave-breaking process.
The correspondence of similarities and differences in both the size distribution and chemical composition of SSA parti-cles generated by the methods explored in this study stresses the inherent coupling between the SSA production mecha-nism and its composition. Hence, this study indicates that the similarity of the number size distribution of laboratory-generated SSA to the best available reference (e.g., labora-tory breaking waves) can be utilized as a first-order check on SSA composition. This study takes important steps toward bringing the marine environment into the laboratory by eval-uating the natural fidelity of the starting material utilized for many chemical and physical studies of SSA particles through a critical intercomparison of various SSA generation mecha-nisms.
Acknowledgements. This study was funded through the Center
for Aerosol Impacts on Climate and the Environment (CAICE), a National Science Foundation Center for Chemical Innovation (CHE-1305427). Dave Aglietti, John Lyons, Paul Harvey, and Charles Coughran of the Scripps Institution of Oceanography Hydraulics Laboratory provided valuable assistance and expertise to the technical development of the facilities used in this study. Total organic carbon analysis reported herein was performed by M. Porrachia at Scripps Institution of Oceanography. The referees of this manuscript are acknowledged for their thorough, thoughtful, and constructive criticism. Any opinions, findings, conclusions, or recommendations expressed in this material are those of the authors and do not necessarily reflect the views of the National Science Foundation.
Edited by: P. Herckes
References
Aller, J. Y., Kuznetsova, M. R., Jahns, C. J., and Kemp, P. F.: The sea surface microlayer as a source of viral and bacterial enrichment in marine aerosols, J. Aerosol. Sci., 36, 801–812, doi:10.1016/j.jaerosci.2004.10.012, 2005.
Andreae, M. O. and Crutzen, P. J.: Atmospheric aerosols: Biogeo-chemical sources and role in atmospheric chemistry, Science, 276, 1052–1058, doi:10.1126/science.276.5315.1052, 1997. Andreae, M. O. and Rosenfeld, D.:
Aerosol-cloud-precipitation interactions. Part 1. The nature and sources of cloud-active aerosols, Earth-Sci. Rev, 89, 13–41, doi:10.1016/j.earscirev.2008.03.001, 2008.
Ault, A. P., Moffet, R. C., Baltrusaitis, J., Collins, D. B., Ruppel, M. J., Cuadra-Rodriguez, L. A., Zhao, D. F., Guasco, T. L., Ebben, C. J., Geiger, F. M., Bertram, T. H., Prather, K. A., and Grassian, V. H.: Size-Dependent Changes in Sea Spray Aerosol
Composi-tion and Properties with Different Seawater CondiComposi-tions, Environ. Sci. Technol., 47, 5603–5612, doi:10.1021/Es400416g, 2013. Azam, F. and Malfatti, F.: Microbial structuring of
ma-rine ecosystems, Nat. Rev. Microbiol., 5, 782–791, doi:10.1038/Nrmicro1747, 2007.
Bates, T. S., Quinn, P. K., Frossard, A. A., Russell, L. M., Hakala, J., Petaja, T., Kulmala, M., Covert, D. S., Cappa, C. D., Li, S. M., Hayden, K. L., Nuaaman, I., McLaren, R., Massoli, P., Canagaratna, M. R., Onasch, T. B., Sueper, D., Worsnop, D. R., and Keene, W. C.: Measurements of ocean derived aerosol off the coast of California, J. Geophys. Res.-Atmos., 117, D00v15, doi:10.1029/2012jd017588, 2012.
Bikerman, J. J.: Foams, Applied Physics and Engineering, 10, Springer Verlag, New York, 337 pp., 1973.
Bird, J. C., de Ruiter, R., Courbin, L., and Stone, H. A.: Daugh-ter bubble cascades produced by folding of ruptured thin films, Nature, 465, 759–762, doi:10.1038/Nature09069, 2010. Blanchard, D. C.: Sea-to-Air Transport of Surface Active Material,
Science, 146, 396–397, 1964.
Blanchard, D. C.: Bubble Scavenging and Water-to-Air Transfer of Organic Material in Sea, Adv. Chem. Ser., 360–387, 1975. Blanchard, D. C. and Syzdek, L. D.: Concentration of Bacteria in
Jet Drops from Bursting Bubbles, J. Geophys. Res., 77, 5087, doi:10.1029/Jc077i027p05087, 1972.
Blanchard, D. C. and Syzdek, L. D.: Electrostatic Collection of Jet and Film Drops, Limnol. Oceanogr., 20, 762–774, 1975. Blanchard, D. C. and Woodcock, A. H.: Bubble Formation and
Modification in the Sea and Its Meteorological Significance, Tel-lus, 9, 145–158, 1957.
Brown, S. S. and Stutz, J.: Nighttime radical observa-tions and chemistry, Chem. Soc. Rev., 41, 6405–6447, doi:10.1039/c2cs35181a, 2012.
Callaghan, A. H., Deane, G. B., Stokes, M. D., and Ward, B.: Observed variation in the decay time of oceanic whitecap foam, J. Geophys. Res.-Oceans, 117, C09015, doi:10.1029/2012jc008147, 2012.
Callaghan, A. H., Deane, G. B., and Stokes, M. D.: Two Regimes of Laboratory Whitecap Foam Decay: Bubble-Plume Controlled and Surfactant Stabilized, J. Phys. Oceanogr., 43, 1114–1126, doi:10.1175/Jpo-D-12-0148.1, 2013.
Carlson, D. J.: Dissolved Organic Materials in Surface Microlay-ers – Temporal and Spatial Variability and Relation to Sea State, Limnol. Oceanogr., 28, 415–431, 1983.
Carslaw, K. S., Lee, L. A., Reddington, C. L., Pringle, K. J., Rap, A., Forster, P. M., Mann, G. W., Spracklen, D. V., Woodhouse, M. T., Regayre, L. A., and Pierce, J. R.: Large contribution of natural aerosols to uncertainty in indirect forcing, Nature, 503, 67–71, doi:10.1038/nature12674, 2013.
Casillas-Ituarte, N. N., Callahan, K. M., Tang, C. Y., Chen, X. K., Roeselova, M., Tobias, D. J., and Allen, H. C.: Surface organiza-tion of aqueous MgCl2and application to atmospheric marine aerosol chemistry, P. Natl. Acad. Sci. USA, 107, 6616–6621, doi:10.1073/pnas.0912322107, 2010.
Charlson, R. J., Schwartz, S. E., Hales, J. M., Cess, R. D., Coakley, J. A., Hansen, J. E., and Hofmann, D. J.: Climate Forcing by Anthropogenic Aerosols, Science, 255, 423–430, doi:10.1126/science.255.5043.423, 1992.
Aerosol Generated by Bubble Bursting, Mar. Chem., 34, 77–95, doi:10.1016/0304-4203(91)90015-O, 1991.
Colin, A.: Coalescence in Foams, in: Foam Engineering: Funda-mentals and Applications, edited by: Stevenson, P., John Wiley & Sons, Ltd., Chichester, UK, 75–90, 2012.
Collins, D. B., Ault, A. P., Moffet, R. C., Ruppel, M. J., Cuadra-Rodriguez, L. A., Guasco, T. L., Corrigan, C. E., Pedler, B. E., Azam, F., Aluwihare, L. I., Bertram, T. H., Roberts, G. C., Gras-sian, V. H., and Prather, K. A.: Impact of marine biogeochemistry on the chemical mixing state and cloud forming ability of nascent sea spray aerosol, J. Geophys. Res.-Atmos., 118, 8553–8565, doi:10.1002/Jgrd.50598, 2013.
Cunliffe, M., Upstill-Goddard, R. C., and Murrell, J. C.: Microbiol-ogy of aquatic surface microlayers, FEMS Microbiol. Rev., 35, 233–246, doi:10.1111/J.1574-6976.2010.00246.X, 2011. Cunliffe, M., Engel, A., Frka, S., Gasparovic, B., Guitart, C.,
Mur-rell, J. C., Salter, M., Stolle, C., Upstill-Goddard, R., and Wurl, O.: Sea surface microlayers: A unified physicochemical and bi-ological perspective of the air-ocean interface, Prog. Oceanogr., 109, 104–116, doi:10.1016/j.pocean.2012.08.004, 2013. Deane, G. B. and Stokes, M. D.: Scale dependence of bubble
cre-ation mechanisms in breaking waves, Nature, 418, 839–844, doi:10.1038/nature00967, 2002.
DeCarlo, P. F., Slowik, J. G., Worsnop, D. R., Davidovits, P., and Jimenez, J. L.: Particle morphology and density character-ization by combined mobility and aerodynamic diameter mea-surements. Part 1: Theory, Aerosol Sci. Tech., 38, 1185–1205, doi:10.1080/027868290903907, 2004.
de Leeuw, G., Andreas, E. L., Anguelova, M. D., Fairall, C. W., Lewis, E. R., O’Dowd, C., Schulz, M., and Schwartz, S. E.: Pro-duction Flux of Sea Spray Aerosol, Rev. Geophys., 49, Rg2001, doi:10.1029/2010rg000349, 2011.
Duce, R. A. and Hoffman, E. J.: Chemical Fractionation at Air-Sea Interface, Annu. Rev. Earth Pl. Sc., 4, 187–228, doi:10.1146/annurev.ea.04.050176.001155, 1976.
Facchini, M. C., Rinaldi, M., Decesari, S., Carbone, C., Finessi, E., Mircea, M., Fuzzi, S., Ceburnis, D., Flanagan, R., Nilsson, E. D., de Leeuw, G., Martino, M., Woeltjen, J., and O’Dowd, C. D.: Primary submicron marine aerosol dominated by insoluble or-ganic colloids and aggregates, Geophys. Res. Lett., 35, L17814, doi:10.1029/2008gl034210, 2008.
Fuentes, E., Coe, H., Green, D., de Leeuw, G., and McFiggans, G.: On the impacts of phytoplankton-derived organic matter on the properties of the primary marine aerosol – Part 1: Source fluxes, Atmos. Chem. Phys., 10, 9295–9317, doi:10.5194/acp-10-9295-2010, 2010a.
Fuentes, E., Coe, H., Green, D., de Leeuw, G., and McFiggans, G.: Laboratory-generated primary marine aerosol via bubble-bursting and atomization, Atmos. Meas. Tech., 3, 141–162, doi:10.5194/amt-3-141-2010, 2010b.
Gantt, B. and Meskhidze, N.: The physical and chemical character-istics of marine primary organic aerosol: a review, Atmos. Chem. Phys., 13, 3979–3996, doi:10.5194/acp-13-3979-2013, 2013. Gard, E., Mayer, J. E., Morrical, B. D., Dienes, T.,
Fergen-son, D. P., and Prather, K. A.: Real-time analysis of in-dividual atmospheric aerosol particles: Design and perfor-mance of a portable ATOFMS, Anal. Chem., 69, 4083–4091, doi:10.1021/ac970540n, 1997.
Gaston, C. J., Furutani, H., Guazzotti, S. A., Coffee, K. R., Bates, T., Quinn, P., Aluwihare, L. I., Mitchell, B. G., and Prather, K. A.: Unique ocean-derived particles serve as a proxy for changes in ocean chemistry, J. Geophys. Res.-Atmos., 116, D18310, doi:10.1029/2010JD015289, 2011.
Ghan, S. J., Smith, S. J., Wang, M. H., Zhang, K., Pringle, K. J., Carslaw, K. S., Pierce, J. R., Bauer, S. E., and Adams, P. J.: A simple model of global aerosol indirect effects, J. Geophys. Res.-Atmos., 118, 6688–6707, doi:10.1002/jgrd.50567, 2013. Guasco, T. L., Cuadra-Rodriguez, L. A., Pedler, B. E., Ault, A. P.,
Collins, D. B., Zhao, D., Kim, M. J., Ruppel, M. J., Wilson, S. C., Pomeroy, R. S., Grassian, V. H., Azam, F., Bertram, T. H., and Prather, K. A.: Transition metal associations with primary bio-logical particles in sea spray aerosol generated in a wave channel, Environ. Sci. Technol., 48, 1324–1333, doi:10.1021/es403203d, 2013.
Hultin, K. A. H., Nilsson, E. D., Krejci, R., Martensson, E. M., Ehn, M., Hagstrom, A., and de Leeuw, G.: In situ laboratory sea spray production during the Marine Aerosol Production 2006 cruise on the northeastern Atlantic Ocean, J. Geophys. Res.-Atmos., 115, D06201, doi:10.1029/2009jd012522, 2010.
Keene, W. C., Maring, H., Maben, J. R., Kieber, D. J., Pszenny, A. A. P., Dahl, E. E., Izaguirre, M. A., Davis, A. J., Long, M. S., Zhou, X. L., Smoydzin, L., and Sander, R.: Chemical and physical characteristics of nascent aerosols produced by bursting bubbles at a model air-sea interface, J. Geophys. Res.-Atmos., 112, D21202, doi:10.1029/2007jd008464, 2007.
King, S. M., Butcher, A. C., Rosenorn, T., Lieke, K. I., de Leeuw, G., Nilsson, D., and Bilde, M.: Investigating primary marine aerosol properties: CCN activity of sea salt and mixed inorganic-organic particles, Environ. Sci. Technol., 46, 10405–10412, doi:10.1021/es300574u, 2012.
Laskin, A., Moffet, R. C., Gilles, M. K., Fast, J. D., Zaveri, R. A., Wang, B. B., Nigge, P., and Shutthanandan, J.: Tropospheric chemistry of internally mixed sea salt and organic particles: Sur-prising reactivity of NaCl with weak organic acids, J. Geophys. Res.-Atmos., 117, D15302, doi:10.1029/2012jd017743, 2012. Lewis, E. R. and Schwartz, S. E.: Sea Salt Aerosol Production:
Mechanisms, Methods, Measurements, and Models – A Criti-cal Review, GeophysiCriti-cal Monograph 152, American Geophysi-cal Union, Washington, DC, 413 pp., 2004.
Liss, P. S.: Chemistry of the sea surface microlayer, in: Chemical Oceanography, edited by: Riley, J. P. and Skirrow, G., Academic Press, London, 193–244, 1975.
Liss, P. S. and Duce, R. A.: The Sea Surface and Global Change, Cambridge University Press, New York, 519 pp., 1997. Lohmann, U. and Feichter, J.: Global indirect aerosol effects: a
re-view, Atmos. Chem. Phys., 5, 715–737, doi:10.5194/acp-5-715-2005, 2005.
Menon, S., Del Genio, A. D., Koch, D., and Tselioudis, G.: GCM Simulations of the aerosol indirect effect: Sensitivity to cloud pa-rameterization and aerosol burden, J. Atmos. Sci., 59, 692–713, 2002.
Modini, R. L., Harris, B., and Ristovski, Z. D.: The organic frac-tion of bubble-generated, accumulafrac-tion mode Sea Spray Aerosol (SSA), Atmos. Chem. Phys., 10, 2867–2877, doi:10.5194/acp-10-2867-2010, 2010.
3682 D. B. Collins et al.: Composition measurements of laboratory-generated SSA
bubble-produced aerosol particles, J. Geophys. Res.-Atmos., 118, 1388–1400, doi:10.1002/Jgrd.50186, 2013.
Moore, M. J. K., Furutani, H., Roberts, G. C., Moffet, R. C., Gilles, M. K., Palenik, B., and Prather, K. A.: Effect of organic compounds on cloud condensation nuclei (CCN) activity of sea spray aerosol produced by bubble bursting, Atmos. Environ., 45, 7462–7469, doi:10.1016/j.atmosenv.2011.04.034, 2011. Novakov, T., Corrigan, C. E., Penner, J. E., Chuang, C. C., Rosario,
O., and Bracero, O. L. M.: Organic aerosols in the Caribbean trade winds: A natural source?, J. Geophys. Res.-Atmos., 102, 21307–21313, doi:10.1029/97jd01487, 1997.
O’Brien, R. E., Neu, A., Epstein, S. A., MacMillan, A. C., Wang, B., Kelly, S. T., Nizkorodov, S. A., Laskin, A., Moffet, R. C., and Gilles, M. K.: Physical properties of ambient and laboratory-generated secondary organic aerosol, Geophys. Res. Lett., 41, 4347–4353, doi:10.1002/2014GL060219, 2014.
O’Dowd, C. D., Facchini, M. C., Cavalli, F., Ceburnis, D., Mircea, M., Decesari, S., Fuzzi, S., Yoon, Y. J., and Putaud, J. P.: Bio-genically driven organic contribution to marine aerosol, Nature, 431, 676–680, doi:10.1038/nature02959, 2004.
Ogawa, H., Amagai, Y., Koike, I., Kaiser, K., and Benner, R.: Pro-duction of refractory dissolved organic matter by bacteria, Sci-ence, 292, 917–920, doi:10.1126/science.1057627, 2001. Park, J. Y., Lim, S., and Park, K.: Mixing State of Submicrometer
Sea Spray Particles Enriched by Insoluble Species in Bubble-Bursting Experiments, J. Atmos. Ocean. Tech., 31, 93–104, doi:10.1175/Jtech-D-13-00086.1, 2014.
Pomeroy, L. R., Williams, P. J. I., Azam, F., and Hobbie, J. E.: The Microbial Loop, Oceanography, 20, 28–33, 2007.
Prather, K. A., Bertram, T. H., Grassian, V. H., Deane, G. B., Stokes, M. D., DeMott, P. J., Aluwihare, L. I., Palenik, B. P., Azam, F., Seinfeld, J. H., Moffet, R. C., Molina, M. J., Cappa, C. D., Geiger, F. M., Roberts, G. C., Russell, L. M., Ault, A. P., Baltru-saitis, J., Collins, D. B., Corrigan, C. E., Cuadra-Rodriguez, L. A., Ebben, C. J., Forestieri, S. D., Guasco, T. L., Hersey, S. P., Kim, M. J., Lambert, W. F., Modini, R. L., Mui, W., Pedler, B. E., Ruppel, M. J., Ryder, O. S., Schoepp, N. G., Sullivan, R. C., and Zhao, D. F.: Bringing the ocean into the laboratory to probe the chemical complexity of sea spray aerosol, P. Natl. Acad. Sci. USA, 110, 7550–7555, doi:10.1073/pnas.1300262110, 2013. Pratt, K. A., DeMott, P. J., French, J. R., Wang, Z., Westphal, D. L.,
Heymsfield, A. J., Twohy, C. H., Prenni, A. J., and Prather, K. A.: In situ detection of biological particles in cloud ice-crystals, Nat. Geosci., 2, 397–400, doi:10.1038/Ngeo521, 2009. Quinn, P. K. and Bates, T. S.: The case against climate regulation via
oceanic phytoplankton sulphur emissions, Nature, 480, 51–56, doi:10.1038/nature10580, 2011.
Quinn, P. K., Bates, T. S., Schultz, K. S., Coffman, D. J., Frossard, A. A., Russell, L. M., Keene, W. C., and Kieber, D. J.: Contribution of sea surface carbon pool to organic mat-ter enrichment in sea spray aerosol, Nat. Geosci., 7, 228–232, doi:10.1038/ngeo2092, 2014.
Ramanathan, V., Crutzen, P. J., Kiehl, J. T., and Rosenfeld, D.: At-mosphere – Aerosols, climate, and the hydrological cycle, Sci-ence, 294, 2119–2124, doi:10.1126/science.1064034, 2001. Rapp, R. J. and Melville, W. K.: Laboratory Measurements of
Deep-Water Breaking Waves, Philos. T. Roy. Soc. A, 331, 735–800, doi:10.1098/rsta.1990.0098, 1990.
Sciare, J., Favez, O., Sarda-Esteve, R., Oikonomou, K., Cachier, H., and Kazan, V.: Long-term observations of carbonaceous aerosols in the Austral Ocean atmosphere: Evidence of a biogenic ma-rine organic source, J. Geophys. Res.-Atmos., 114, D15302, doi:10.1029/2009jd011998, 2009.
Sellegri, K., O’Dowd, C. D., Yoon, Y. J., Jennings, S. G., and de Leeuw, G.: Surfactants and submicron sea spray generation, J. Geophys. Res.-Atmos., 111, D22215, doi:10.1029/2005jd006658, 2006.
Shank, L. M., Howell, S., Clarke, A. D., Freitag, S., Brekhovskikh, V., Kapustin, V., McNaughton, C., Campos, T., and Wood, R.: Organic matter and non-refractory aerosol over the re-mote Southeast Pacific: oceanic and combustion sources, Atmos. Chem. Phys., 12, 557–576, doi:10.5194/acp-12-557-2012, 2012. Song, X. H., Hopke, P. K., Fergenson, D. P., and Prather, K. A.: Classification of single particles analyzed by ATOFMS using an artificial neural network, ART-2A, Anal. Chem., 71, 860–865, 1999.
Sorooshian, A., Padro, L. T., Nenes, A., Feingold, G., McComiskey, A., Hersey, S. P., Gates, H., Jonsson, H. H., Miller, S. D., Stephens, G. L., Flagan, R. C., and Seinfeld, J. H.: On the link between ocean biota emissions, aerosol, and maritime clouds: Airborne, ground, and satellite measurements off the coast of California, Global Biogeochem. Cy., 23, GB4007, doi:10.1029/2009gb003464, 2009.
Stokes, M. D., Deane, G. B., Prather, K., Bertram, T. H., Ruppel, M. J., Ryder, O. S., Brady, J. M., and Zhao, D.: A Marine Aerosol Reference Tank system as a breaking wave analogue for the pro-duction of foam and sea-spray aerosols, Atmos. Meas. Tech., 6, 1085–1094, doi:10.5194/amt-6-1085-2013, 2013.
Su, Y. X., Sipin, M. F., Furutani, H., and Prather, K. A.: Develop-ment and characterization of an aerosol time-of-flight mass spec-trometer with increased detection efficiency, Anal. Chem., 76, 712–719, doi:10.1021/ac034797z, 2004.
Teeling, H., Fuchs, B. M., Becher, D., Klockow, C., Gardebrecht, A., Bennke, C. M., Kassabgy, M., Huang, S. X., Mann, A. J., Waldmann, J., Weber, M., Klindworth, A., Otto, A., Lange, J., Bernhardt, J., Reinsch, C., Hecker, M., Peplies, J., Bockel-mann, F. D., Callies, U., Gerdts, G., Wichels, A., Wiltshire, K. H., Glockner, F. O., Schweder, T., and Amann, R.: Substrate-Controlled Succession of Marine Bacterioplankton Populations Induced by a Phytoplankton Bloom, Science, 336, 608–611, doi:10.1126/science.1218344, 2012.
Tsigaridis, K., Koch, D., and Menon, S.: Uncertainties and importance of sea spray composition on aerosol direct and indirect effects, J. Geophys. Res.-Atmos., 118, 220–235, doi:10.1029/2012jd018165, 2013.
Tyree, C. A., Hellion, V. M., Alexandrova, O. A., and Allen, J. O.: Foam droplets generated from natural and ar-tificial seawaters, J. Geophys. Res.-Atmos., 112, D12204, doi:10.1029/2006jd007729, 2007.
Verdugo, P.: Marine Microgels, Annu. Rev. Mar. Sci., 4, 375–400, doi:10.1146/annurev-marine-120709-142759, 2012.
Wurl, O., Wurl, E., Miller, L., Johnson, K., and Vagle, S.: Forma-tion and global distribuForma-tion of sea-surface microlayers, Biogeo-sciences, 8, 121–135, doi:10.5194/bg-8-121-2011, 2011. Yoon, Y. J., Ceburnis, D., Cavalli, F., Jourdan, O., Putaud, J.
P., Facchini, M. C., Decesari, S., Fuzzi, S., Sellegri, K., Jen-nings, S. G., and O’Dowd, C. D.: Seasonal characteristics of the physicochemical properties of North Atlantic marine at-mospheric aerosols, J. Geophys. Res.-Atmos., 112, D04206, doi:10.1029/2005jd007044, 2007.
Zábori, J., Matis¯ans, M., Krejci, R., Nilsson, E. D., and Ström, J.: Artificial primary marine aerosol production: a laboratory study with varying water temperature, salinity, and succinic acid concentration, Atmos. Chem. Phys., 12, 10709–10724, doi:10.5194/acp-12-10709-2012, 2012.