https://doi.org/10.5194/tc-13-1-2019
© Author(s) 2019. This work is distributed under the Creative Commons Attribution 4.0 License.
Definition differences and internal variability affect the simulated
Arctic sea ice melt season
Abigail Smith and Alexandra Jahn
Department of Atmospheric and Oceanic Sciences and Institute of Arctic and Alpine Research, University of Colorado Boulder, Boulder, USA
Correspondence:Abigail Smith ([email protected]) Received: 29 August 2018 – Discussion started: 10 September 2018
Revised: 5 December 2018 – Accepted: 5 December 2018 – Published: 2 January 2019
Abstract.Satellite observations show that the Arctic sea ice melt season is getting longer. This lengthening has impor-tant implications for the Arctic Ocean’s radiation budget, ma-rine ecology and accessibility. Here we assess how passive microwave satellite observations of the melt season can be used for climate model evaluation. By using the Community Earth System Model Large Ensemble (CESM LE), we eval-uate the effect of multiple possible definitions of melt on-set, freeze onset and melt season length on comparisons with passive microwave satellite data, while taking into account the impacts of internal variability. We find that within the CESM LE, melt onset shows a higher sensitivity to definition choices than freeze onset, while freeze onset is more greatly impacted by internal variability. The CESM LE accurately simulates that the trend in freeze onset largely drives the ob-served pan-Arctic trend in melt season length. Under RCP8.5 forcing, the CESM LE projects that freeze onset dates will continue to shift later, leading to a pan-Arctic average melt season length of 7–9 months by the end of the 21st century. However, none of the available model definitions produce trends in the pan-Arctic melt season length as large as seen in passive microwave observations. This suggests a model bias, which might be a factor in the generally underestimated re-sponse of sea ice loss to global warming in the CESM LE. Overall, our results show that the choice of model melt sea-son definition is highly dependent on the question posed, and none of the definitions exactly match the physics underlying the passive microwave observations.
1 Introduction
Arctic sea ice melt season characteristics play an important role in the radiation balance of the Arctic. Changes in the melt season have important implications for the Arctic cli-mate system as a whole (Markus et al., 2009), and therefore are crucial for anticipating ecological changes and informing economic development in the region. In this study, we quan-tify the impact of definition choices and internal variability on Arctic sea ice melt season characteristics (averages and trends of melt onset, freeze onset and melt season length). This allows us to assess how best to compare observed and modeled melt season changes and diagnose model biases.
caves necessary for birthing (Hezel et al., 2012). Polar bears are also dependent on the timing of melt and freeze onset, as they use sea ice as a platform for seasonal hunting and breeding (Stern and Laidre, 2016). Moreover, prediction of melt onset dates is increasingly important for operational sea ice forecasts that inform local decision-making in the Arctic (Collow et al., 2015).
Previous efforts to assess melt onset, freeze onset and melt season length in climate models have used a variety of def-initions, as no model definition of melt and freeze onset di-rectly corresponds to remote sensing definitions (Wang et al., 2011; Jahn et al., 2012; Mortin and Graversen, 2014; Hol-land and Landrum, 2015; Johnson and Eicken, 2016; Wang et al., 2017). This inconsistent definition of melt and freeze onset complicates both comparisons between models and be-tween models and observations. Furthermore, because of the chaotic nature of the climate system, there will always be a limit to how well model projections fit observations, even for trends of more than 35 years (Kay et al., 2015; Notz, 2015; Swart et al., 2015). In particular, it has been shown that the full CMIP5 distribution of 35-year September sea ice extent trends could be due to internal variability (Swart et al., 2015). Recent work suggests that sea ice trends sim-ilar to observations are only found in climate models with too much global warming (Rosenblum and Eisenman, 2017). But global warming, known to drive sea ice extent trends (Mahlstein and Knutti, 2012), is also strongly impacted by internal variability (Jahn, 2018). Furthermore, observational estimates of the sea ice sensitivity are highly uncertain due to observational uncertainties in both sea ice extent and global temperature (Niederdrenk and Notz, 2018).
Further complicating the issue, even observational assess-ments of melt season characteristics do not use just one def-inition of melt onset and freeze onset (Smith, 1998; Drobot and Anderson, 2001; Belchanksy et al., 2004; Markus et al., 2009; Bliss et al., 2017). Passive remote sensing techniques utilize brightness temperatures, which are sensitive to the changes in emissivity that occur when snow and ice change phase. Algorithms for deriving melt and freeze onset dates from brightness temperature vary in their methodologies, and differences between algorithms can arise from
inconsisten-ternal variability and utilize daily model variables that are not available from the CMIP5 archive, thereby allowing us to assess the comparability of different melt and freeze onset definitions. We also show how melt and freeze onset dates and melt season length are projected to change by the end of the 21st century under a strong emission scenario (RCP8.5) and how internal variability and definition differences impact those projections.
2 Methods
In this study, we use both model and passive microwave (PMW) satellite data to assess the timing of continuous sea ice melt and freeze onset in the Arctic, defined here as north of 66◦N. A map of the major Arctic seas and features re-ferred to throughout the text is shown in Fig. S1 in the Supplement. Pan-Arctic means are taken between 66 and 84.5◦N. Pan-Arctic trends in melt season characteristics are calculated as the slope of the least-squares linear regression of the pan-Arctic mean from 1979 to 2014. Individual grid cell trends in melt season characteristics are calculated where there are melt onset dates, freeze onset dates or melt sea-son lengths available for at least 20 years of the 36-year pe-riod (as was done in Stroeve et al., 2014). Individual grid cell trends represent the slope of the least-squares linear regres-sion of each melt season characteristic from 1979 to 2014.
Barn-hart et al., 2016; Jahn et al., 2016; Rosenblum and Eisenman, 2017; Jahn, 2018; Massonnet et al., 2018; Labe et al., 2018). Under RCP8.5 forcing, Arctic sea ice in the CESM LE first reaches September ice-free conditions by the middle of the 21st century (2032–2053 using monthly means of ice extent; Jahn et al., 2016). By the end of the 21st century, ice-free conditions persist for 4–5 months in most years (Jahn, 2018).
2.2 Passive microwave melt and freeze onset data We utilize the PMW dataset of melt and freeze onset dates from Markus et al. (2009), updated by Stroeve et al. (2014), gridded to 25 km×25 km (data accessed on 16 May 2016; available at the NASA Cryosphere Science Research Por-tal). This dataset applies the PMW melt and freeze onset al-gorithm to passive microwave brightness temperatures col-lected over the period 1979–2014 from the Nimbus 7 Scan-ning Multichannel Microwave Radiometer (SMMR), the Special Sensor Microwave/Imager (SSM/I) and the Special Sensor Microwave Imager and Sounder (SSMIS). The PMW algorithm uses brightness temperatures from the 37 V GHz and 19 V GHz (18 V GHz on SMMR) sensor channels.
Specifically, the PMW melt and freeze onset algorithm de-scribes and utilizes three parameters (137, GRice,P) based
on brightness temperatures. The parameters are described in detail in Markus et al. (2009). The parameters are weighted based on their respective normalized expected ranges, and the sum of the weights is used to determine the dates of melt and freeze onset at each pixel for each year. In order to min-imize the effects of noise in the data, the validity of the pro-duced melt and freeze onset date is assessed at each pixel us-ing the neighborus-ing eight pixels. Dates are considered valid if more than four of the surrounding pixels do not vary by more than 1 day. In areas of thin ice, ice concentration in-formation supplements the brightness temperature parame-ters. If no clear melt signal is available in thin ice areas, the melt onset date is taken as the day at which ice concentra-tion drops below 80 % for the last time. Similarly, if no clear freeze signal is detected, the freeze onset date is taken as the first day at which ice concentration exceeds 80 %.
As noted earlier, other melt and freeze onset algorithms ex-ist in addition to the PMW algorithm, such as the advanced horizontal range algorithm (AHRA). AHRA computes melt onset (but not freeze onset) over both first-year ice and mul-tiyear ice based on passive microwave temperatures (Drobot and Anderson, 2001), improving upon earlier work that only provided melt onset over multiyear sea ice (Smith, 1998). While both the PMW and AHRA algorithms utilize pas-sive microwave brightness temperatures, they are not equally sensitive to changes in brightness temperatures. The PMW dataset includes early melt and freeze onset dates as well as continuous melt and freeze onset dates. The former is defined as the first day of melt/freeze, while the latter is the day that melting or freezing conditions begin and persist throughout the rest of the season. Comparison of the PMW Combined
data (which are composed of PMW early melt onset dates except when early melt is not detected, then the PMW con-tinuous melt onset date is used) versus the AHRA data shows large mean differences in early melt onset dates and differ-ences in trends over 1979–2012 (Bliss et al., 2017). When re-produced with the same inter-sensor calibration adjustments and masking techniques, trend agreement improves between PMW Combined and AHRA, but large differences in mean early melt onset dates remain (Bliss et al., 2017).
Because the PMW algorithm can be used to derive both melt and freeze onset dates across the entire Arctic for a 36-year period, the resulting data are best suited for climate model evaluation. In this study, we use the continuous melt and freeze onset dates so that we can determine the contin-uous melt season length. By using contincontin-uous melt season length, we aim to evaluate changes in season-long charac-teristics of the melt season. All further discussion of melt and freeze onset refers to continuous melt and freeze onset. Note that by using continuous melt and freeze onset dates, we use an observational melt season length definition that differs from the Stroeve et al. (2014) definition of melt sea-son length, which incorporates early melt and freeze onset dates.
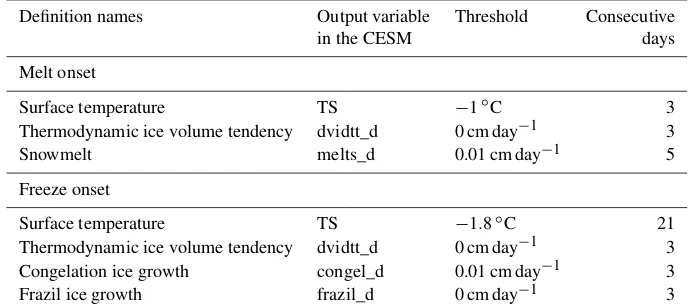
2.3 Model definitions of melt and freeze onset
Because climate models, including the CESM LE, do not simulate brightness temperatures, we cannot apply the same methodology as used in the PMW algorithm to define melt and freeze onset in the model. However, in contrast to PMW data, we can obtain the actual melt and freeze onset from physical variables in the model. Here, we define several melt and freeze onset dates from the existing daily output of the CESM LE that make physical sense to assess the impor-tance of definition choices and their suitability for compar-isons with the PMW data. Details of the definitions can be found in Table 1. In particular, we make use of daily means of snowmelt, surface temperature, frazil and congelation ice growth, and thermodynamic ice volume tendency. Of these, only surface temperature and thermodynamic ice volume ten-dency are available for all 40 ensemble members. All others were only saved for two ensemble members (34 and 35). Fur-thermore, the surface temperature is from the atmospheric model, while all other variables are from the sea ice model. To minimize errors associated with regridding, we generally use the variables on their original grid, which differs between the sea ice and atmospheric models in CESM. That means that surface temperature is only regridded onto the sea ice grid when necessary for melt season length calculations.
ex-Congelation ice growth congel_d 0.01 cm day−1 3
Frazil ice growth frazil_d 0 cm day−1 3
pect that the snowmelt definition matches the PMW defini-tion most closely, as the brightness temperature melt crite-ria capture changes in liquid water content in the snow. The temperature criteria likely also capture snowmelt onset, but less directly than if melt onset is based on actual snowmelt. In contrast, the thermodynamic volume tendency captures the onset of surface, basal and lateral ice melt rather than snowmelt. These different CESM LE definitions of melt on-set provide insight into a range of melt processes. While not all of them are expected to correspond to satellite observa-tions, the differences in timing between the model definitions themselves may be important for certain applications, such as for biophysical processes (Jin et al., 2007) and the trans-port of sediments and contaminants by sea ice (Pfirman et al., 1995).
As the PMW is based on liquid water content in the snow-pack, and the snowmelt definition is due to snowmelt itself, even the snowmelt melt onset definition likely does not cor-respond perfectly to the PMW-based definition. Furthermore, snowmelt is only saved in two ensemble members, which does not allow an assessment of the impact of internal vari-ability on this definition. We will compare all three defini-tions in order to quantify how the diagnosed melt onset in the model varies based on the variable used.
For freeze onset in the CESM LE, we create four different definitions (Table 1): one using thermodynamic ice volume tendency (for all 40 members) and a second using surface temperature where ice concentration is greater than zero (for all 40 members). It is important for comparisons with PMW observations that we define freeze onset using both surface temperature and thermodynamic ice volume tendency, since refreezing of liquid water in the snow on sea ice is not ac-counted for as ice growth in the CESM LE. In the CESM LE, thermodynamic ice volume tendency is a sum of conge-lation ice growth along existing sea ice and frazil ice growth in the water column. Thus, only a surface-temperature-based
definition is able to capture potential freeze onset processes within the snowpack, which are detected in satellite observa-tions. We also create two additional freeze onset definitions using frazil ice growth and congelation ice growth, in order to compare the impact of these two ice growth processes.
Melt season length is calculated at each grid cell for each year as the difference between local freeze onset date and melt onset date. In total, we create five unique definitions of melt season length, which are detailed in Table 2. Two def-initions of melt season length keep like variables together (i.e., use both melt and freeze onset dates from surface tem-perature definitions or thermodynamic volume tendency def-initions), while the other three combine variable definitions (e.g., use melt onset dates from the snowmelt definition and freeze onset dates from the frazil ice growth definition) in order to span the full range of possible melt season length definitions in the CESM.
Table 2.CESM LE definitions for melt season length, showing the various melt and freeze onset definition combinations used to compute melt season length. For each combination, the melt onset date is subtracted from the freeze onset date at each grid cell every year.
Melt season length definition name Melt onset definition Freeze onset definition
Volume–volume Thermodynamic ice volume tendency Thermodynamic ice volume tendency
Temperature–temperature Surface temperature Surface temperature
Congelation–snowmelt Snowmelt Congelation ice growth
Frazil–snowmelt Snowmelt Frazil ice growth
Temperature–snowmelt Snowmelt Surface temperature
3 Results
3.1 CESM LE definitions: average melt season characteristics
3.1.1 Pan-Arctic averages
Using the definitions described in Sect. 2.3, we find that there are large differences in the pan-Arctic averages of melt sea-son characteristics between CESM LE definitions (Fig. 1). To quantify pan-Arctic definition differences, we define the spread as the average difference between the earliest and lat-est melt and freeze onset definitions over 1979–2014, as well as the difference between the shortest and longest melt sea-son length definitions over this time period. Here we discuss only ensemble member 35, as differences in spreads between ensemble members 34 and 35 are small (Figs. 1 and S2). We find that the spread in pan-Arctic melt onset definitions in the chosen ensemble member is 35 days, due largely to the early melt onset dates from the thermodynamic ice volume tendency definition, which captures ice melt (including basal melt; see Sect. 3.1.2 for a discussion of the spatial fields, which explains the large spread). This spread of 35 days in melt definitions is much larger than the 13-day spread found between the freeze definitions. The large spread in melt on-set dates also affects differences between melt season length definitions, leading to a spread of 43 days in ensemble mem-ber 35. Note that spreads in pan-Arctic melt and freeze onset do not sum to the spread in melt season length, as the melt season length is calculated at each grid cell and not as a dif-ference in the pan-Arctic means.
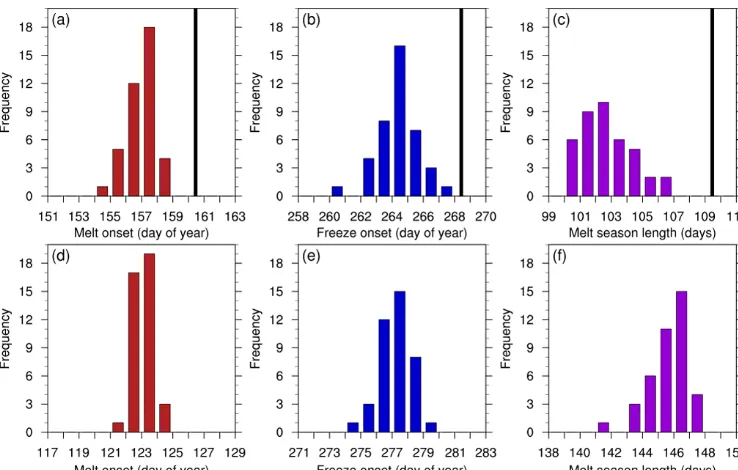
Internal variability introduces additional differences in di-agnosed pan-Arctic melt onset, freeze onset and melt sea-son length (Fig. 2). However, these are much smaller than the definition spreads, ranging between 4 and 8 days. Aver-age melt onset dates are less impacted by internal variabil-ity than average freeze onset dates, based on the temperature and thermodynamic ice volume tendency definitions where all 40 ensemble members are available. Pan-Arctic melt on-set dates fall within a range of 5 days, while pan-Arctic freeze onset dates fall within a range of 8 days. Average melt season length is affected by internal variability similarly to average freeze onset dates, with a range of 7 days in both definitions.
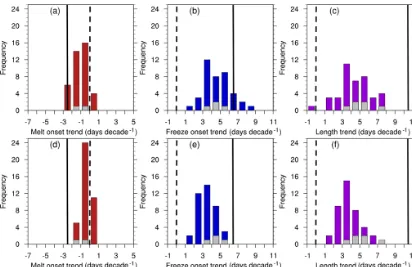
Figure 2.Histograms of the pan-Arctic average melt season characteristics over 1979–2014 using the surface temperature definitions(a–c) and thermodynamic ice volume tendency definitions(d–f)for all 40 CESM LE ensemble members, showing the impact of internal variability. PMW observations are denoted by black lines(a–c). Note that thex-axis limits are different in each panel, but the range is the same (12 days), to facilitate the assessment of the impact of internal variability for different processes and definitions.
3.1.2 Spatial averages
Areas in the marginal ice zone have earlier melt onset dates and later freeze onset dates than those in the central Arctic, but specific spatial distributions of average melt season char-acteristics in the CESM LE depend on the definition. For ex-ample, melt onset derived from the snowmelt definition oc-curs in mid-June to late June in the central Arctic and parts of the Laptev Sea (Fig. 3a). Melt onset dates in the surface tem-perature definition are generally later than in the snowmelt definition (Fig. 3b), with mid-June to late June melt on-sets stretching from the central Arctic into the East Siberian, Chukchi and Beaufort seas. The thermodynamic ice volume tendency melt onset definition yields central Arctic melt on-set dates about 10 days earlier than the other definitions, as well as earlier onset dates in the Barents and Chukchi seas (Fig. 3c). Average melt onset dates from the thermodynamic ice volume tendency definition over the satellite era are ear-lier in the inflow regions than those derived from surface def-initions in the CESM LE (snowmelt, surface temperature) and PMW observations, since the thermodynamic ice vol-ume tendency definition reflects basal melt during spring. Spring basal melt in the CESM LE is largest in the inflow regions, particularly in the Greenland and Barents seas. Aver-ages of melt season characteristics over 1979–2014 are sim-ilar for ensemble members 34 (shown in Figs. S3–S5) and 35 (Figs. 3–5), as the impact of internal variability on the 36-year means of the selected variables is small.
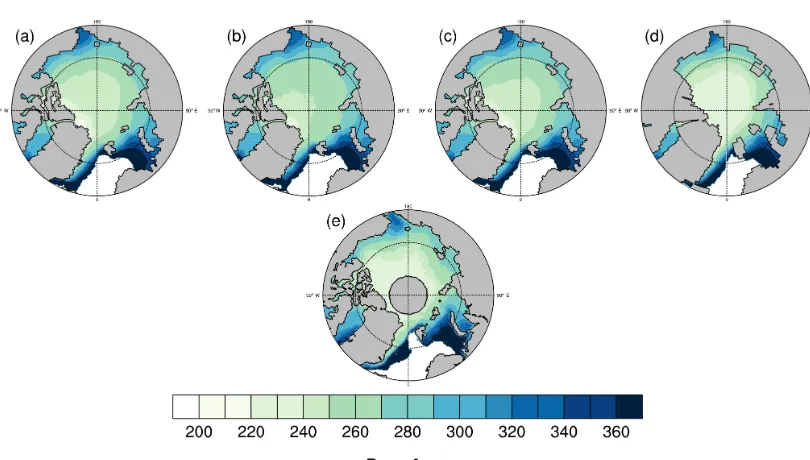
Average freeze onset dates over the satellite era also vary spatially by definition (Fig. 4a–e). In the central Arctic, the surface temperature definition yields freeze onset dates in early August to mid-August. Freeze onset definitions based on sea ice variables also show early August to mid-August freeze onset dates in the region north of the Canadian Arc-tic and Greenland, but later freeze onset dates throughout the rest of the central Arctic. In all definitions, there are strong gradients in freeze onset in the marginal seas. For example, in the Chukchi Sea, which is impacted by Pacific water in-flow, freeze onset occurs between mid-September and the end of November. Even stronger gradients exist in the Bar-ents Sea, which is impacted by Atlantic inflow. Strong gra-dients in the marginal ice zones are expected, as these areas show the largest trends in winter ice loss and are impacted most strongly by sensible and latent heat fluxes (Deser et al., 2000).
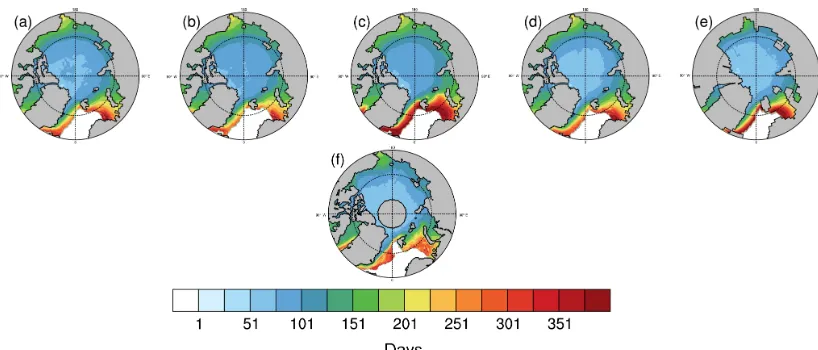
Figure 3.Average melt onset dates over 1979–2014 for each CESM LE definition using ensemble member 35:(a)snowmelt definition, (b)thermodynamic ice volume tendency definition,(c)surface temperature definition and(d)PMW satellite observations. The black line denotes the mean March ice edge (15 % ice concentration) from 1979 to 2014 using(a–c)the CESM LE and(d)NSIDC Bootstrap sea ice concentrations (Comiso, 2017). Melt onset dates south of the mean ice edge are less reliable than those north of the edge. Plots from ensemble member 34 are very similar and shown in Fig. S3.
Figure 5.Average melt season lengths over 1979–2014, for each CESM LE definition using ensemble member 35:(a)congelation–snowmelt, (b)frazil–snowmelt,(c)volume–volume,(d)temperature–snowmelt,(e)temperature–temperature and(f)PMW satellite observations. Plots from ensemble member 34 are very similar and shown in Fig. S5.
the volume–volume definition (Fig. 5c). Additionally, in the Laptev Sea, surface temperature melt onset dates are later than those from the other definitions, and this drives shorter melt season lengths in the temperature–temperature defini-tion than the other CESM LE definidefini-tions by about 25 days (Fig. 5e).
3.2 CESM LE definitions: trends in melt season characteristics
3.2.1 Pan-Arctic trends
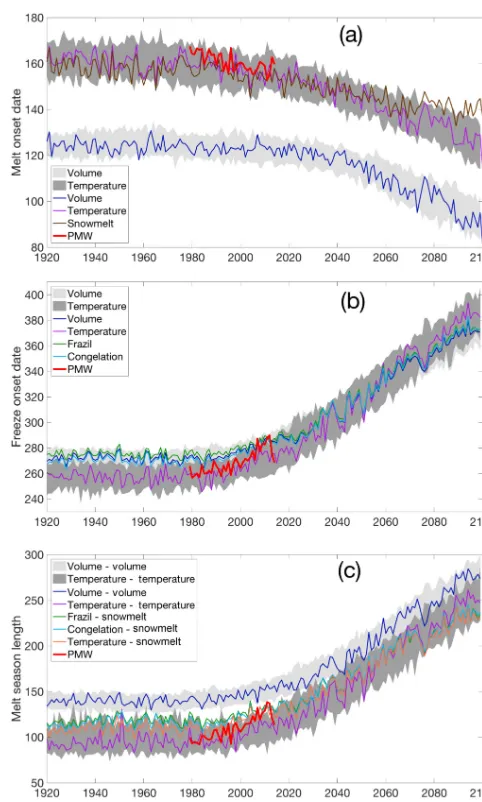
Definitions in the CESM LE generally show pan-Arctic melt onset dates trending earlier and pan-Arctic freeze onset trending later over the period 1979–2014 (Table 3, Fig. 6), in agreement with previous work (Stroeve et al., 2014; Mortin and Graversen, 2014; Johnson and Eicken, 2016). But in the CESM LE, internal variability affects the magnitude of these 36-year trends, and in a few cases for melt onset and melt season length even the sign of the trends. The large effect of internal variability on these trends is already evident when comparing trends between ensemble members 34 and 35 (Ta-ble 3). Ensem(Ta-ble member 35 shows larger pan-Arctic trends than ensemble member 34 over 1979–2014 for almost all model definitions and melt season characteristics. The only exception is the trend in melt onset derived from thermody-namic ice volume tendency, which is the smallest trend in both ensemble members, and shows a negative trend in mem-ber 34 but a small positive trend in memmem-ber 35 (Table 3). The impact of internal variability on the 1979–2014 melt on-set trends is even more pronounced using the full 40-member CESM ensemble, where melt onset trends fall between−2.4 and 0.8 days decade−1for the surface temperature and ther-modynamic volume tendency definitions (Fig. 6). However, all members show negative 36-year melt onset trends for the
rest of the model simulation if we shift the trend start year to 1990 for the surface temperature definition and to 2008 for the volume tendency definition. This shows that forced melt onset trends over the observed period can be masked by in-ternal variability for some of the definitions of melt onset in the model.
Pan-Arctic freeze onset trends in the CESM LE are larger than trends in melt onset in all 40 ensemble members, regard-less of definition, and are always positive over the satellite era (indicating later freeze onset). The 36-year trends in freeze onset are positive throughout the remainder of the model sim-ulation as well. The surface temperature definition of freeze onset yields the largest trend over the satellite era in ensem-ble members 34 and 35 (Taensem-ble 3). The maximum trend of all ensemble members is also larger in the surface temperature definition than in the thermodynamic volume tendency defi-nition (Table 3). In Fig. 2, the pan-Arctic average freeze onset dates are more affected by internal variability than the aver-ages melt onset dates. This is true for the pan-Arctic trends as well: there is greater variability between ensemble mem-bers in the freeze onset trends than in the melt onset trends (Fig. 6).
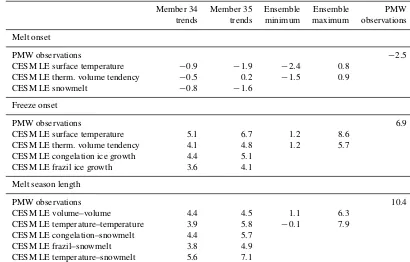
Table 3.Trends in pan-Arctic melt onset, freeze onset and melt season length (days decade−1) over 1979–2014 using PMW observations and CESM LE definitions.
Member 34 Member 35 Ensemble Ensemble PMW
trends trends minimum maximum observations
Melt onset
PMW observations −2.5
CESM LE surface temperature −0.9 −1.9 −2.4 0.8
CESM LE therm. volume tendency −0.5 0.2 −1.5 0.9
CESM LE snowmelt −0.8 −1.6
Freeze onset
PMW observations 6.9
CESM LE surface temperature 5.1 6.7 1.2 8.6
CESM LE therm. volume tendency 4.1 4.8 1.2 5.7
CESM LE congelation ice growth 4.4 5.1
CESM LE frazil ice growth 3.6 4.1
Melt season length
PMW observations 10.4
CESM LE volume–volume 4.4 4.5 1.1 6.3
CESM LE temperature–temperature 3.9 5.8 −0.1 7.9
CESM LE congelation–snowmelt 4.4 5.7
CESM LE frazil–snowmelt 3.8 4.9
CESM LE temperature–snowmelt 5.6 7.1
Since trends in pan-Arctic freeze onset are consistently larger than melt onset trends, the majority of the trend in melt season length over 1979–2014 stems from the freeze onset component, in agreement with PMW observations (Stroeve et al., 2014). For ensemble members 34 and 35, the temperature–snowmelt definition produces the largest trend in melt season length (Table 3). Internal variability in melt season length trends is as large as for the freeze onset trends, with pan-Arctic trends in melt season length between −0.1 and 7.9 days decade−1 using the surface temperature and thermodynamic ice volume tendency definitions (Fig. 6). While the majority of ensemble members show a trend to-ward a longer pan-Arctic melt season as expected, one mem-ber shows a trend toward a shorter melt season over 1979– 2014. This demonstrates that internal variability can have a large impact on trends, even over 36-year periods. The selec-tion of the trend start date also impacts the trend distribuselec-tion. By start year 1981, just 2 years past the beginning of the satellite period, all ensemble members and definitions have positive 36-year trends in melt season length for the remain-der of the model simulation.
3.2.2 Spatial trends
Spatially, trends in melt onset vary differently than trends in freeze onset. Melt onset trends are generally negative except along the Atlantic ice edge, indicating earlier melt onsets across most of the Arctic (Fig. 7). The complex pattern of
spatial trends near the Atlantic ice edge is likely related to the change in location of the ice edge over 1979–2014. A mov-ing ice edge means that conditions for melt and freeze onset may be met in grid cells along the edge during some years but not others. As noted in Sect. 2, trends are only evaluated at grid cells where there are at least 20 years of valid melt characteristics over the 36-year period.
Because the temperature and snowmelt melt onset defini-tions capture surface processes only, we find that the trends in these definitions are more similar to each other than to the thermodynamic volume tendency definition, which de-pends on sea ice melt. In both ensemble members 34 and 35, the snowmelt and surface temperature definitions of melt onset show negative trends in the Laptev, East Siberian and Chukchi seas that are not present in the thermodynamic ice volume tendency definition, indicating that these trends to-wards earlier melt represent snowmelt, rather than sea ice melt.
variabil-Figure 6.Histograms of the trends in pan-Arctic melt season characteristics over 1979–2014 using the surface temperature definitions(a–c) and thermodynamic volume tendency definitions(d–f)for all 40 CESM LE ensemble members. Gray bars represent trends from the other CESM LE definitions for ensemble members 34 and 35. PMW observations are denoted by solid black lines. The zero line is denoted by dashed black lines. Given the magnitude of the trends, the internal variability is very large. Note that thex-axis limits are different in each panel, but the range is the same (12 days decade−1), to facilitate the assessment of the impact of internal variability for different processes and definitions.
ity (Fig. 8). However, unlike the trends in melt onset defini-tions, the regional patterns in freeze onset trends are largely consistent between definitions. The similarity in trends be-tween definitions based on surface temperature and sea ice variables indicates that temperature trends are driving the de-layed freeze-up.
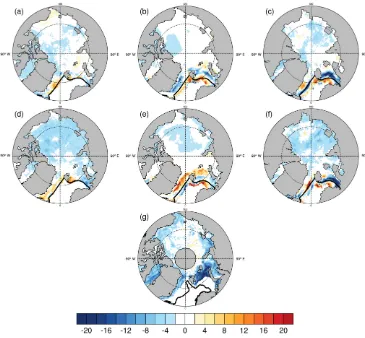
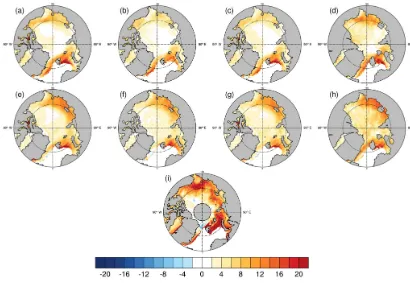
All CESM LE definitions show large positive trends in melt season length in the Barents Sea and in the Laptev and East Siberian seas, driven by the freeze onset trends in these regions (Fig. 9). Changes in freeze onset are particularly im-portant to changes in the melt season in the marginal ice zones, where sea ice has retreated the most over the satel-lite period. However, definition differences and internal vari-ability introduce large variations in the magnitude and even the sign of the diagnosed melt season lengths. The effect of definition differences is most pronounced to the north of the Beaufort Sea, where temperature-based definitions indi-cate a negative trend in melt season length, while all other definitions show no or small positive trends in that region (Fig. 9e, j). The effect of internal variability is seen most clearly in the central Arctic, where even the sign of the trend varies between ensemble members (Fig. 9). Internal variabil-ity also affects the magnitude of the melt season trends in the
marginal seas (Fig. 9), as sea ice loss is simulated differently in ensemble members 34 and 35.
3.3 Comparing CESM LE and PMW 3.3.1 Average melt season characteristics
Figure 7.Trends in melt onset dates over 1979–2014 for each CESM LE definition in the two members where they are available (member 34 in a–c, member 35 in d–f) as well as in the PMW satellite observations(g). The snowmelt definition is shown in(a)and (d), the thermodynamic ice volume tendency definition is shown in(b)and(e)and the surface temperature definition is shown in(c)and(f). The black line denotes the mean March ice edge (15 % ice concentration) from 1979 to 2014 using(a–f)the CESM LE and(g)NSIDC Bootstrap sea ice concentrations (Comiso, 2017).
but due to definition differences and/or an early melt onset model bias in the CESM LE. It is also possible that no model bias exists and that later melt onset in the PMW data is due to observational uncertainty. Uncertainty in satellite-derived melt onset dates was assessed by Bliss et al. (2017) using two different algorithms, the AHRA and the PMW Combined al-gorithm (which, as noted earlier, is composed of PMW early melt onset dates except when early melt is not detected, then the PMW continuous melt onset date is used). It was found that the AHRA algorithm shows earlier melt onset dates than the PMW Combined algorithm in nearly all locations across the Arctic (Bliss et al., 2017). The difference between pan-Arctic average PMW melt onset dates and the melt onset dates found in the CESM LE using surface-based definitions (snowmelt and surface temperature) is less than the approx-imately 20-day melt onset difference found between the two satellite algorithms in Bliss et al. (2017). Therefore the differ-ence between PMW and CESM LE melt onset dates might be
within the observational uncertainty rather than a model bias. However, Bliss et al. (2017) compared early melt onset algo-rithms, while we assess continuous melt onset. It is therefore unclear if the observational uncertainty is the same for early and continuous melt onset.
Figure 8.Trends in freeze onset dates over 1979–2014 for each CESM LE definition in the two members where they are available (member 34 ina–d, member 35 ine–h) as well as in the PMW satellite observations(i). The congelation ice growth definition is shown in(a)and(e), the frazil ice growth definition is shown in(b)and(f), the thermodynamic ice volume tendency definition is shown in(c)and(g)and the surface temperature definition is shown in(d)and(h).
on ice growth, explaining the later freeze onset of those defi-nitions compared to PMW data in the central Arctic.
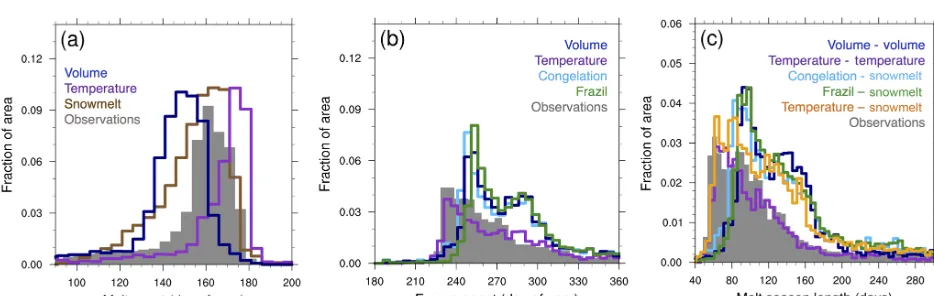
Comparisons of melt season length emphasize that no one definition fully captures the PMW observations. All CESM LE definitions show longer melt seasons in the Barents Sea than shown by the PMW data (Fig. 5). By areal fraction, most definitions show a longer melt season length in the CESM compared to PMW data (Fig. 10). In terms of pan-Arctic av-erages, CESM LE melt season lengths are both shorter and longer than PMW data depending on the definitions used.
3.3.2 Trends in melt season characteristics
In the PMW observations spanning 1979–2014 (Markus et al., 2009; Stroeve et al., 2014), pan-Arctic melt onset is occurring 2.5 days earlier per decade and pan-Arctic freeze onset is occurring 6.9 days later per decade (Table 3, Fig. 6). In agreement with PMW data and past studies (Stroeve et al., 2014; Wang et al., 2017), a larger trend in freeze onset than melt onset is produced by all CESM definitions. The PMW melt onset trend falls just outside the range of model def-inition trends (spanning −2.4 to 0.9 days decade−1), while the PMW freeze onset trend is bracketed by model definition trends (spanning 1.2 to 8.6 days decade−1).
Figure 9.Trend in melt season length over 1979–2014 for each CESM LE definition in the two members where they are available (member 34 ina–e, member 35 inf–j) as well as in the PMW satellite observations(k). The congelation–snowmelt definition is shown in(a)and(f), the frazil–snowmelt definition in(b)and(g), the volume–volume definition in(c)and(h), the temperature–snowmelt definition in(d)and(i) and the temperature–temperature definition in(e)and(j).
Figure 10.Average melt season characteristics from 66 to 84.5◦N for 1979–2014 for PMW satellite observations (filled gray) and each CESM LE definition (in ensemble member 35):(a)melt onset using the surface temperature, thermodynamic ice volume tendency and snowmelt definitions,(b)freeze onset using the surface temperature, thermodynamic ice volume tendency, frazil ice growth and congela-tion ice growth definicongela-tions and(c)melt season length using the temperature–temperature, temperature–snowmelt, volume–volume, frazil– snowmelt and congelation–snowmelt definitions. Plots from ensemble member 34 are very similar and are shown in Fig. S6.
3.3.3 Relationship between melt and freeze onset
Earlier melt and later freeze onset dates are related in both CESM LE definitions and PMW observations (Fig. S7). In previous work, earlier melt onset has been shown to delay fall freeze onset through increased solar absorption in the Arctic
(Fetterer et al., 2017). Trends in melt onset using the surface temperature, thermodynamic ice volume tendency and snowmelt definitions. (b)Trends in freeze onset using the surface temperature, thermodynamic ice volume tendency, frazil ice growth and congelation ice growth definitions.(c)Trends in melt season length using the temperature–temperature, temperature–snowmelt, volume–volume, frazil–snowmelt and congelation–snowmelt definitions. Lines represent the least-squares linear fits.
Figure 12.Trends in melt season characteristics versus trends in September sea ice sensitivity from 1979 to 2014 for PMW observations and all available CESM LE ensemble members. Each marker represents an ensemble member. Circles represent ensemble member 34 and triangles represent ensemble member 35. The red markers represent the PMW melt and freeze onset observations and sea ice sensitivity derived from HadCRUT (square), GISTEMP (+) and NCDC (diamond) global temperature observations and NSIDC September sea ice extent (Fetterer et al., 2017).(a)Trends in melt onset using the surface temperature, thermodynamic ice volume tendency and snowmelt definitions.(b)Trends in freeze onset using the surface temperature, thermodynamic ice volume tendency, frazil ice growth and congelation ice growth definitions.(c)Trends in melt season length using the temperature–temperature, temperature–snowmelt, volume–volume, frazil– snowmelt and congelation–snowmelt definitions. Lines represent the least-squares linear fits.
3.5 % of all available ensemble members and definitions in the CESM LE show positive correlations, indicating that in general, earlier melt onset dates are related to later freeze on-set dates in the same year. This forced relationship between melt onset and freeze onset is also apparent in the ensem-ble mean, which shows negative correlation coefficients that bracket the observations (−0.21 using thermodynamic ice volume tendency and−0.49 using surface temperature).
3.4 Melt season characteristics and September sea ice CESM LE members that have the largest trend in Septem-ber sea ice extent over the period 1979–2014 also have the largest melt season length trend (Fig. 11). Correlations be-tween trends in September sea ice extent and trends in the two CESM LE melt season length definitions with 40
avail-able ensemble members (surface temperature and thermody-namic ice volume tendency) are both−0.79. In Sect. 3.2 we showed that 36-year trends in melt season characteristics are affected strongly by internal variability. The same is true for September sea ice extent trends, as shown in previous work (Kay et al., 2011; Swart et al., 2015). But unlike the observed trend in melt season length, the observed trend in September sea ice extent falls within the range of internal variability in the CESM LE (Swart et al., 2015; Jahn, 2018).
Table 4.Pan-Arctic ensemble means of melt season characteristics averaged over the time periods 1979–1998, 2040–2059 (mid-century) and 2080–2099 (end of century). Surface temperature and thermodynamic ice volume tendency definitions are averaged over 40 ensembles, and all other definitions are averaged over the two ensemble members for which they are available (members 34 and 35).
Definition names 1979–1998 2040–2059 2080–2099 2040–2059 minus 2080–2099 minus
1979–1998 1979–1998
Melt onset
Surface temperature 160 144 127 16 34
Therm. volume tendency 124 114 96 10 29
Snowmelt 155 146 141 9 15
Freeze onset
Surface temperature 257 319 378 62 120
Therm. volume tendency 272 319 368 47 96
Congelation ice growth 273 320 368 48 95
Frazil ice growth 278 321 369 43 91
Melt season length
Temperature–temperature 96 166 245 70 149
Volume–volume 140 196 268 56 128
Congelation–snowmelt 120 174 230 54 111
Frazil–snowmelt 122 173 229 51 107
Temperature–snowmelt 115 170 226 56 112
per degree of global temperature change. Both models and observations have been shown to have an approximately lin-ear relationship between Arctic sea ice extent and global sur-face temperature (Mahlstein and Knutti, 2012). It has also been found that climate models producing global warming similar to observations have slower than observed sea ice loss (Rosenblum and Eisenman, 2017). However, large ob-servational uncertainty in sea ice sensitivity (Niederdrenk and Notz, 2018) complicates model assessment. This agrees with findings for the CESM LE, where the identification of a September sea ice sensitivity bias depends on the se-lected observations and period (Jahn, 2018). Over the pe-riod 1979–2014, September sea ice sensitivity using the GIS-TEMP (GISGIS-TEMP, 2017) global warming trend falls within the ensemble spread, but all ensemble members underesti-mate the sea ice sensitivity compared to those derived from HadCRUT4 (HadCRUT.4.5.0.0, 2017) and NCDC (NCDC, 2017) global warming trends (Fig. 12). In contrast, all CESM LE ensemble members and definitions underestimate the pan-Arctic trend in melt season length from 1979 to 2014 (as shown earlier, Figs. 11 and 12). Hence, if the CESM LE is indeed underestimating the September sea ice sensitivity, it is possible that the underestimation of the melt season length trend is a contributing factor.
3.5 Pan-Arctic projections under RCP8.5 forcing All CESM LE definitions project larger changes in freeze on-set than in melt onon-set by the end of the 21st century, and this pattern is consistent with modeled and observed trends over
the satellite era. Under RCP8.5 forcing, pan-Arctic melt on-set dates are projected to occur 1–2 weeks earlier by the mid-dle of the 20th century, while freeze onset dates are projected to occur 1–2 months later (Table 4). By the end of the 21st century, pan-Arctic melt onset dates are projected to occur 2 weeks to a month earlier under RCP8.5. At the same time, pan-Arctic freeze onset dates are projected to occur in Jan-uary of the following year, which is 3–4 months later than modeled and observed freeze onset dates over the satellite era. Later freeze onset dates are the primary driver of future changes in pan-Arctic melt season length under RCP8.5, and the melt season is projected to be 5–6 months long by the middle of the 21st century and 7–9 months long by the end of the 21st century (compared to 3–4 months long over the satellite era). The largest changes in projected melt season length are seen in the Chukchi, Beaufort and Barents seas (Fig. 13).
Figure 13.Melt season length averaged over the time periods 1979–1998 (top row), 2040–2059 (middle row) and 2080–2099 (bottom row) using ensemble member 35. Each column is a different definition:(a)congelation–snowmelt,(b)frazil–snowmelt, (c)volume–volume, (d)temperature–snowmelt and(e)temperature–temperature.
Melt season length definitions become more similar in large part due to the freeze onset component. In particu-lar, the area covered by the surface temperature freeze onset definition becomes more similar to the area covered by the thermodynamic ice volume tendency freeze onset definition (Fig. S8). This is likely due to the ice growth–thickness rela-tionship (Bitz and Roe, 2004), since thinner ice is less insu-lating and hence allows freeze onset quickly after tempera-tures drop below freezing. A lack of insulation also affects the increasingly large area of open water (Barnhart et al., 2016), where changes in surface temperature can quickly trigger frazil ice growth. Thus, as ice coverage decreases, the dates of freeze onset get more similar between surface temperature and thermodynamic ice volume tendency defini-tions.
Additionally, the internal variability of melt season char-acteristics depends on definition and is projected to increase through the 21st century. Figures 2 and 6 show that sur-face temperature definitions of melt onset, freeze onset and melt season length yield greater variations between ensem-ble members than thermodynamic ice volume tendency def-initions over the satellite era. This is also true over the pe-riod 2064–2099, as seen in Fig. 14, which shows the shift in ensemble trends between 1979–2014 and 2064–2099. In all melt season characteristics and definitions, the range of the pan-Arctic trends increases between 1979–2014 and 2064– 2099, indicating melt onset, freeze onset and melt season
length could be even more affected by internal variability in the future. Average pan-Arctic melt season characteris-tics also yield greater ranges over 2064–2099 (not shown). Changing internal variability means that future observations will be compared to a wider possible range of modeled melt season characteristics, making model bias detection even more challenging.
4 Conclusions
Figure 14.Histograms of the pan-Arctic trends in melt season characteristics for 1979–2014 (shaded in gray) and for the end of the 21st century (2064–2099, shaded in red for melt onset, blue for freeze onset and purple for melt season length). This shows the change in the trends over the 21st century as well as the changing impact of internal variability on these trends. The histograms use the surface temperature definitions(a–c)and thermodynamic ice volume tendency definitions(d–f)for all 40 CESM LE ensemble members. Note that thex-axis range is the same (25 days decade−1) for all panels shown in this figure, but different from Fig. 6.
the impact of definition choices and internal variability for diagnosing Arctic sea ice melt season characteristics (melt onset, freeze onset and melt season length). We utilize model simulations of the CESM LE with the goal of assessing how melt season projections are impacted by these factors, and to determine how satellite observations can be used for model evaluation using melt season characteristics.
We find that while some similarities exist between PMW observations and CESM LE definitions, no single definition fully captures the satellite observations. Definitions of melt season length show impacts of both melt and freeze onset definitions: a large range between definitions, related primar-ily to the melt onset, and a large range between ensemble members, related primarily to the freeze onset. The aver-age spread between the shortest and longest pan-Arctic melt season length definitions is over 40 days during the satel-lite period, primarily because of differences in the melt on-set definitions. In particular, the thermodynamic ice volume tendency definition (which is affected by surface, lateral and basal melt) produces melt onset dates much earlier than the surface definitions using snowmelt or surface temperature, which capture snowmelt rather than ice melt. These results indicate that the choice of melt onset definition is highly de-pendent on the application, and therefore on which processes
one is aiming to capture – sea ice melt or snowmelt. The PMW observations of melt onset, which capture snowmelt, therefore cannot be used for comparison to model definitions based on sea ice variables that capture ice melt. Even the snowmelt melt onset definition is not a perfect fit to PMW satellite observations. Furthermore, we find that in the late 21st century, the snowmelt melt onset definition in the model could become less effective for capturing melt onset over large areas of the Arctic, as spring snow cover on sea ice is projected to decline under RCP8.5 forcing (Blanchard-Wrigglesworth et al., 2015). How this decline might impact PMW brightness temperature-derived satellite observations is unclear.
pre-sulation and allows for faster ice growth once surface tem-peratures fall below freezing (Bitz and Roe, 2004). The fact that surface temperature drives ice growth also has important implications for internal variability. CESM LE freeze onset definitions experience greater internal variability than melt onset definitions. Similarly, surface temperature definitions are more variable than those based on thermodynamic ice volume tendency. This shows that the internal variability of a selected definition variable impacts the internal variability of the derived melt and freeze onset.
In both PMW observations and CESM LE definitions, ear-lier Arctic melt onset tends to be followed by later pan-Arctic freeze onset over the satellite era, in agreement with previous work (Stroeve et al., 2014). However, while the ensemble mean clearly shows this forced response, internal variability affects this relationship and can reverse this rela-tionship for individual years in the CESM LE over the satel-lite era.
The pan-Arctic trend in melt season length is driven mostly by the trend in freeze onset in the CESM LE, in agree-ment with previous work for the PMW melt season length (Stroeve et al., 2014). Yet, despite the use of multiple plau-sible definitions and 40 ensemble members, no model defi-nition produces trends in the pan-Arctic melt season as large as PMW observations. The inability of the CESM to pro-duce pan-Arctic melt season lengths as large as observations suggests a model bias. In particular, the marginal ice zones consistently show smaller trends for all model definitions of freeze onset and melt season length than PMW observations. This melt season trend bias may have important implica-tions for September sea ice. High correlaimplica-tions exist between September sea ice sensitivity and melt season length over the satellite era in the CESM LE. Observational uncertainty in sea ice sensitivity is substantial (Niederdrenk and Notz, 2018), but the data used here indicate that the CESM LE may underestimate September sea ice sensitivity. It is therefore possible that an underestimation of the trend in CESM LE melt season length is one factor contributing to the potential biases in the simulated sea ice sensitivity in the CESM.
Under RCP8.5 forcing, the CESM LE projects that the Arctic sea ice melt season will last 7–9 months by the end of
Cryosphere Science Research Portal (https://neptune.gsfc.nasa.gov/ csb/index.php?section=54, last access: 16 May 2016).
Supplement. The supplement related to this article is available online at: https://doi.org/10.5194/tc-13-1-2019-supplement.
Author contributions. AJ conceived the study, and AS analyzed the data and prepared the manuscript, with guidance and edits from AJ.
Competing interests. The authors declare that they have no conflict of interest.
Acknowledgements. This work is supported by the National Science Foundation Graduate Research Fellowship under grant no. DGE 1144083. We thank Julienne Stroeve and Thorsten Markus for sharing their passive microwave dataset of melt and freeze onset dates and helpful discussions. We also thank two anonymous referees for their constructive comments. Discussions with David Bailey, Julienne Stroeve, Maxwell Boykoff and Jennifer Kay on this work and discussions at the 2016 FAMOS workshop are appreciated. The CESM project is supported by the National Science Foundation and the Office of Science (BER) of the U.S. Department of Energy. Computing resources for the CESM ensembles were provided by the Climate Simulation Laboratory at NCAR’s Computational and Information Systems Laboratory (CISL), sponsored by the National Science Foundation and other agencies. Five of the CESM LE simulations were produced at the University of Toronto under the supervision of Paul Kushner. NCL (NCL, 2017) was used for data analysis.
Edited by: John Yackel
Reviewed by: two anonymous referees
References
Belchanksy, G., Douglas, D., and Platonov, N.: Duration of the Arctic Sea Ice Melt Season: Regional and Interannual Vari-ability, J. Climate, 17, 67–80, https://doi.org/10.1175/1520-0442(2004)017<0067:DOTASI>2.0.CO;2, 2004.
Bitz, C. and Roe, G.: Low-frequency variability in the Arc-tic atmosphere, sea ice, and upper-ocean climate sys-tem, J. Climate, 9, 3623–3632, https://doi.org/10.1175/1520-0442(1996)009<0394:LFVITA>2.0.CO;2, 1996.
Bitz, C. M. and Roe, G. H.: A Mechanism for the High Rate of Sea Ice Thinning in the Arctic Ocean, J. Cli-mate, 17, 3623–3632, https://doi.org/10.1175/1520-0442(2004)017<3623:AMFTHR>2.0.CO;2, 2004.
Blanchard-Wrigglesworth, E., Farrell, S. L., Newman, T., and Bitz, C. M.: Snow cover on Arctic sea ice in observations and an Earth System Model, Geophys. Res. Lett., 42, 10342–10348, https://doi.org/10.1002/2015GL066049, 2015.
Bliss, A. C., Miller, J. A., and Meier, W. N.: Comparison of passive microwave-derived early melt onset records on Arctic sea ice, Remote Sensing, 9, 1–23, https://doi.org/10.3390/rs9030199, 2017.
Collow, T. W., Wang, W., and Kumar, A.: Prediction of Arc-tic Sea Ice Melt Date as an Alternative Parameter for Lo-cal Sea Ice Forecasting, Science and Technology Infusion Climate Bulletin, 40th NOAA Annual Climate Diagnostics and Prediction Workshop, Denver, CO, USA, 26–29 October 2015, 26–29, available at: http://www.nws.noaa.gov/ost/climate/ STIP/40CDPW/40cdpw-TCollow.pdf (last access: 17 December 2018), 2015.
Comiso, J.: Bootstrap Sea Ice Concentrations from Nimbus-7 SMMR and DMSP SSM/I-SSMIS, Version 3. March monthly means 1979–2014, Boulder, Colorado USA. NASA National Snow and Ice Data Center Distributed Active Archive Center, https://doi.org/10.5067/7Q8HCCWS4I0R, 2017.
Deser, C., Walsh, J. E., and Timlin, M. S.: Arctic sea ice variability in the context of recent atmospheric circulation trends, J. Climate, 13, 617–633, https://doi.org/10.1175/1520-0442(2000)013<0617:ASIVIT>2.0.CO;2, 2000.
Drobot, S. D. and Anderson, M. R.: An improved method for de-termining snowmelt onset dates over Arctic sea ice using scan-ning multichannel microwave radiometer and Special Sensor Microwave/Imager data, J. Geophys. Res.-Atmos., 106, 24033– 24049, https://doi.org/10.1029/2000JD000171, 2001.
Fetterer, F., Knowles, K., Meier, W., Savoie, M., and Wind-nagel, A.: Sea Ice Index, Version 3, updated daily. Septem-ber monthly sea ice extent 1979–2014. Boulder, Col-orado USA. NSIDC: National Snow and Ice Data Center, https://doi.org/10.7265/N5K072F8, 2017.
GISTEMP: GISS Surface Temperature Analysis (GISTEMP), avail-able at: https://data.giss.nasa.gov/gistemp, last access: 7 Febru-ary 2017.
HadCRUT.4.5.0.0: HadCRUT.4.5.0.0 near surface temperature data, available at: http://www.metoffice.gov.uk/hadobs/hadcrut4/ data/current/download.html, last access: 7 February 2017. Hezel, P. J., Zhang, X., Bitz, C. M., Kelly, B. P., and
Massonnet, F.: Projected decline in spring snow depth on Arctic sea ice caused by progressively later autumn open ocean freeze-up this century, Geophys. Res. Lett., 39, 6–11, https://doi.org/10.1029/2012GL052794, 2012.
Holland, M. M. and Landrum, L.: Factors affecting projected Arctic surface shortwave heating and albedo change in cou-pled climate models, Philos. T. R. Soc. A, 373, 1–20, https://doi.org/10.1098/rsta.2014.0162, 2015.
Hurrell, J. W., Holland, M. M., Gent, P. R., Ghan, S., Kay, J. E., Kushner, P. J., Lamarque, J.-F., Large, W. G., Lawrence, D., Lindsay, K., Lipscomb, W. H., Long, M. C., Mahowald, N., Marsh, D. R., Neale, R. B., Rasch, P., Vavrus, S., Vertenstein, M., Bader, D., Collins, W. D., Hack, J. J., Kiehl, J., and Mar-shall, S.: The Community Earth System Model: A Framework for Collaborative Research, B. Am. Meteorol. Soc., 94, 1339– 1360, https://doi.org/10.1175/BAMS-D-12-00121.1, 2013. Jahn, A.: Reduced probability of ice-free summers for 1.5◦C
compared to 2◦C warming, Nat. Clim. Change, 8, 409–413, https://doi.org/10.1038/s41558-018-0127-8, 2018.
Jahn, A., Sterling, K., Holland, M. M., Kay, J. E., Maslanik, J. A., Bitz, C. M., Bailey, D. A., Stroeve, J., Hunke, E. C., Lipscomb, W. H., and Pollak, D. A.: Late-twentieth-century simulation of Arctic sea ice and ocean properties in the CCSM4, J. Climate, 25, 1431–1452, https://doi.org/10.1175/JCLI-D-11-00201.1, 2012. Jahn, A., Kay, J. E., Holland, M. M., and Hall, D. M.:
How predictable is the timing of a summer
ice-free Arctic?, Geophys. Res. Lett., 43, 9113–9120, https://doi.org/10.1002/2016GL070067, 2016.
Jin, M., Deal, C., Wang, J., Alexander, V., Gradinger, R., Saitoh, S., Iida, T., Wan, Z., and Stabeno, P.: Ice-associated phytoplankton blooms in the southeastern Bering Sea, Geophys. Res. Lett., 34, 1–6, https://doi.org/10.1029/2006GL028849, 2007.
Johnson, M. and Eicken, H.: Estimating Arctic sea-ice freeze-up and break-up from the satellite record: A comparison of different approaches in the Chukchi and Beaufort Seas, Elementa, 4, 1–16, https://doi.org/10.12952/journal.elementa.000124, 2016.
Kay, J. E., Holland, M. M., and Jahn, A.:
Inter-annual to multi-decadal Arctic sea ice extent trends in a warming world, Geophys. Res. Lett., 38, 2–7, https://doi.org/10.1029/2011GL048008, 2011.
Kay, J. E., Deser, C., Phillips, A., Mai, A., Hannay, C., Strand, G., Arblaster, J. M., Bates, S. C., Danabasoglu, G., Edwards, J., Holland, M., Kushner, P., Lamarque, J. F., Lawrence, D., Lindsay, K., Middleton, A., Munoz, E., Neale, R., Oleson, K., Polvani, L., and Vertenstein, M.: The Community Earth Sys-tem Model (CESM) Large Ensemble project: A community re-source for studying climate change in the presence of inter-nal climate variability, B. Am. Meteorol. Soc., 96, 1333–1349, https://doi.org/10.1175/BAMS-D-13-00255.1, 2015.
Labe, Z., Magnusdottir, G., and Stern, H.: Variability of Arctic sea ice thickness using PIOMAS and the CESM Large Ensemble, J. Climate, 31, 3233–3247, https://doi.org/10.1175/JCLI-D-17-0436.1, 2018.
Mahlstein, I. and Knutti, R.: September Arctic sea ice predicted to disappear near 2◦C global warming above present, J. Geophys. Res.-Atmos., 117, 1–11, https://doi.org/10.1029/2011JD016709, 2012.
Markus, T., Stroeve, J. C., and Miller, J.: Recent changes in Arctic sea ice melt onset, freezeup, and melt season length, J. Geophys. Res.-Oceans, 114, 1–14, https://doi.org/10.1029/2009JC005436, 2009.
Notz, D.: How well must climate models agree with obser-vations?, Philos. T. Roy. Soc. Lond. A, 373, 20140164, https://doi.org/10.1098/rsta.2014.0164, 2015.
Perovich, D. K., Nghiem, S. V., Markus, T., and Schweiger, A.: Seasonal evolution and interannual variability of the lo-cal solar energy absorbed by the Arctic sea ice-ocean sys-tem, Journal of Geophysical Research: Oceans, 112, C03005, https://doi.org/10.1029/2006JC003558, 2007.
Perovich, D. K., Jones, K. F., Light, B., Eicken, H., Markus, T., Stroeve, J., and Lindsay, R.: Solar partitioning in a changing Arctic sea-ice cover, Ann. Glaciol., 52, 192–196, https://doi.org/10.3189/172756411795931543, 2011.
Persson, P. O. G.: Onset and end of the summer melt sea-son over sea ice: Thermal structure and surface energy perspective from SHEBA, Clim. Dynam., 39, 1349–1371, https://doi.org/10.1007/s00382-011-1196-9, 2012.
Pfirman, S., Eicken, H., Bauch, D., and Weeks, W.: The potential transport of pollutants by Arctic sea ice, Sci. Total Environ., 159, 129–146, https://doi.org/10.1016/0048-9697(95)04174-y, 1995. Rosenblum, E. and Eisenman, I.: Sea ice trends in climate models
only accurate in runs with biased global warming, J. Climate, 30, 6265–6278, https://doi.org/10.1175/JCLI-D-16-0455.1, 2017.
1225, https://doi.org/10.1002/2013GL058951, 2014.
Stroeve, J. C., Crawford, A. D., and Stammerjohn, S.: Us-ing timUs-ing of ice retreat to predict timUs-ing of fall freeze-up in the Arctic, Geophys. Res. Lett., 43, 6332–6340, https://doi.org/10.1002/2016GL069314, 2016.
Swart, N. C., Fyfe, J. C., Hawkins, E., Kay, J. E., and Jahn, A.: In-fluence of internal variability on Arctic sea-ice trends, Nat. Clim. Change, 5, 86–89, https://doi.org/10.1038/nclimate2483, 2015. Timmermans, M. L.: The impact of stored solar heat on
Arc-tic sea ice growth, Geophys. Res. Lett., 42, 6399–6406, https://doi.org/10.1002/2015GL064541, 2015.
Wang, L., Wolken, G. J., Sharp, M. J., Howell, S. E. L., Derksen, C., Brown, R. D., Markus, T., and Cole, J.: Integrated pan-Arctic melt onset detection from satellite active and passive microwave measurements, 2000–2009, J. Geophys. Res., 116, 2000–2009, https://doi.org/10.1029/2011JD016256, 2011.