Chemistry on the Response of Gas-Sensitive
Resistors
by
Laura Jane Gellman
A thesis submitted to the University of London for the degree of
Doctor of Philosophy
Department of Chemistry,
Mardi 1995
University College London,
Christopher Ingold Laboratories,
20 Gordon Street,
The quality of this reproduction is dependent upon the quality of the copy submitted.
In the unlikely event that the author did not send a complete manuscript and there are missing pages, these will be noted. Also, if material had to be removed,
a note will indicate the deletion.
uest.
ProQuest 10017211
Published by ProQuest LLC(2016). Copyright of the Dissertation is held by the Author.
All rights reserved.
This work is protected against unauthorized copying under Title 17, United States Code. Microform Edition © ProQuest LLC.
ProQuest LLC
789 East Eisenhower Parkway P.O. Box 1346
This work describes the gas-sensing properties o f niobate oxide semiconductors. Three groups o f compounds were investigated; (a) tetragonal tungsten bronze-type series BagFe^Nbio-xOso (this was found to be basically Ba^FeNbgO^o with an impurity phase and (speculatively) intergrowths o f a spinel phase), (b) rutile type solid solution series CrxFei_xNb0 4 and (c) mixed phase FexNb2_x0 4 (found to be a mixture o f different phases
o f FeN b0 4 and the unreacted oxides). These materials function as gas-sensitive resistors
in that they exhibit considerable changes in their electrical resistance upon exposure to reducing gases present in low concentrations in air.
Variation o f stoichiometry and systematic substitution to form solid solutions were investigated with respect to their influence on the gas response to propane and carbon monoxide. These materials were synthesised using standard solid state ceramic methods and used in pellet form. They were characterized by X-ray powder diffraction (XRD), scanning-electron microcopy (SEM), Mossbauer spectroscopy, energy dispersive analysis o f X-rays (EDAX) and electron probe microanalysis (EPMA) techniques.
Two major factors influencing the gas response were identified. Firstly, the response was strongly dependent on the microstructure of the material as a result of the effects o f reaction and gas diffusion within the porous body. The consequence o f such a reaction was a concentration gradient within the pellet and hence a variation in electrical conductivity. These effects were particularly pronounced for Ba^Fe^Nbio xOgo. Secondly, in the series CrxFei_xNb0 4 , the responses were strongly inhibited by a
D .H .D aw son for practical assistance, constructive suggestions and continual moral support. Also for use o f figures 2.6, 2.7 and 2.8 in this thesis (extracted from D .H .D aw son, Technical Report, University College London, 1993).
I am grateful for use o f the SEM in the University o f London Institute o f Archaeology and to Mr. K.Reeves, and for use o f the University o f London Intercollegiate Research Service (ULIRS) Mossbauer facility at Birkbeck College, with much effort on the part o f Mr. C.Lawrence. Initial experiments were conducted at AEA Harwell Laboratories under the supervision o f Drs. P.T.M oseley and R.Peat. Early X-ray diffraction work was carried out by Dr. LG .W ood in the Department o f Geology, UCL, the computer simulation by Dr. R .H . Jones at the Royal Institution, London and the TG measurement in chapter 3 by Ms. M .Odlyha o f Birkbeck college (ULIRS thermal analysis service). I would also like to acknowledge Dr. G.S.Henshaw for the mass spectrometry data and stimulating discussion on aspects o f chapter 3 and Miss C .S .S .O ’Connor for the FTIR data in chapter 4. I would also like to express my gratitude to Miss S.Best o f Birkbeck College for translation o f reference 9 o f chapter 1 and Mrs. W .Stiddard for reference 9 of chapter 3. ICSD Daresbury data were provided by Dr. I.Abrahams and Mr. C.J.Cooksey.
Chapter 1: Introduction
1.1 Background
1.2 Mechanism o f gas sensitivity 1.3 Band theory related to gas sensing 1.4 Selectivity
1.5 Thesis outline Appendix 1.1 Appendix 1.2
page 17
20
28 31 36 38 40Chapter 2: Experimental
2.1 Preparation o f compounds 2.2 Scanning-electron microscopy 2.3 X-ray diffractommetry
2.4 Electron probe microanalysis 2.5 Mossbauer spectroscopy
2.6 Instrumental: Electrical measurements Appendix 2.1
Appendix 2.2
42 43 43 43 43 48 54 55
Chapter 3: Tetragonal Tungsten Bronze-type niobates
3.1 Introduction 3.2 Experimental
3.3 M aterials characterization
3.3.1 Scanning-electron microscopy 3.3.2 X-ray diffractometry
3.3.3 Electron-probe microanalysis 3.3.4 Mossbauer spectroscopy
3.4 Electrical characterization and gas response 3.4.1 Resistivities and activation energies
3.8 Suggestions for future work Appendix 3.1
83 85
Chapter 4: Chromium iron niobates
4.1 Introduction 87
4.2 Experimental 8 8
4.3 Materials characterization
4.3.1 Scanning-electron microscopy 89
4.3 .2 X-ray diffractometry 91
4.3.3 Mossbauer spectroscopy 93
4.4 Electrical characterization and gas response
4.4.1 Resistivities and activation energies 97
4 .4 .2 Seebeck voltage measurements 99
4.4.3 Response measurements 100
4 .4 .4 Effect o f moisture 107
4.4.5 Selectivity 115
4 .4 .6 Temperature dependence o f selectivity
4 .4 .6 (i) Preliminary experiments 119
4 .4 .6 (ii) Effects o f heat treatment 131
4 .4 .7 Stepped temperature in CO 135
4.5 The effect o f gross substitution of TP^ in chromium iron niobate
4.5.1 Philosophy o f these experiments 138
4 .5 .2 CO response vs temperature 138
4 .5.3 Effect o f pretreatment 142
4.6 Study o f the surface o f Cro 2Feo gNb0 4 by DRIFTS 143
4.9 Suggestions for future work Appendix 4.1
Appendix 4.2 Appendix 4.3 Appendix 4.4 Appendix 4.5
149 150 154 161 167 171
Chapter 5: Iron niobates of variable stoichiometry
5.1 Introduction 5.2 Experimental
5.3 Materials characterization
176 177
5.3.1 Scanning-electron microscopy 178
5 .3 .2 X-ray diffractometry 179
5.3.3 M ossbauer spectroscopy 180
5.4 Electrical characterization
5.4.1 Resistivities and activation energies 182
5 .4 .2 Preliminary response measurements 184
5.4.3 Effects o f moisture 189
5.4.4 Temperature dependence o f the selectivity 195
5.5 Discussion 206
5.6 Conclusion 207
Appendix 5.1 208
Appendix 5.2 209
Appendix 5.3 218
Appendix 5.4 2 2 1
Appendix 5.5 230
General Conclusion
2351.2 The principal energy states in a thin film gas sensor 25
1.3 Sintering models
(a) open neck 27
(b) closed neck 27
(c) Schottky barrier 28
1.4 (a) Anionic depletive chemisorption on an n-type semiconductor 29 (b) Anionic cumulative chemisorption on a p-type semiconductor 29
1.5 Responses for SnOi sensor doped with Ag 33
1.6 Gas composition profile in a porous pellet 34
1.7 Cylindrical hollow thick film Sn0 2 sensor 35
C h a p te r 2
2 . 1 Typical single line spectrum obtained when source
and sample are identical 44
2 . 2 Mossbauer transitions o f ^^Fe 46
2.3 Zeeman splitting o f energy levels in ^^Fe 46
2.4 Mossbauer spectrum o f BaFe02.72 at 293 K 47
2.5 Mossbauer spectrum o f BaFe02.72 at 4.2 K 47
2 . 6 General view o f the pellet test-rig 49
2.7 The electrode area o f the test-rig 50
2 . 8 Flow diagram for the multiple pellet rig 51
2.9 Conversion factor for the test gas mixture 52
C h a p te r 3
3.1 Resistance response o f a pellet o f Ba^FeNbOjo to reducing
and oxidizing gases in air at 500 °C 58
3.2 The tetragonal tungsten bronze structure 59
3.3 A transition from p to n-type behaviour on increasing
concentration o f reducing gas 60
3.4 A typical example o f a pellet o f Ba^FeNbOgo fired at 1200 °C 63
3.5 SEM micrographs o f pellets o f Ba^Fej gNbg4O3 0 fired at
different temperatures 64
3.6 (a) Experimental XRD pattern o f
Ba^FeNbgOgo 65
(b) XRD pattern o f Ba^FeNbgOso simulated
using LAZY-PULVERIX 65
3.7 EPMA linescan o f Ba^Fei 6Nbg4 0 3o 67
3.8 Graph o f experimental vs theoretical iron stoichiometry
in the series BagEe^Nbio-xOso 6 8
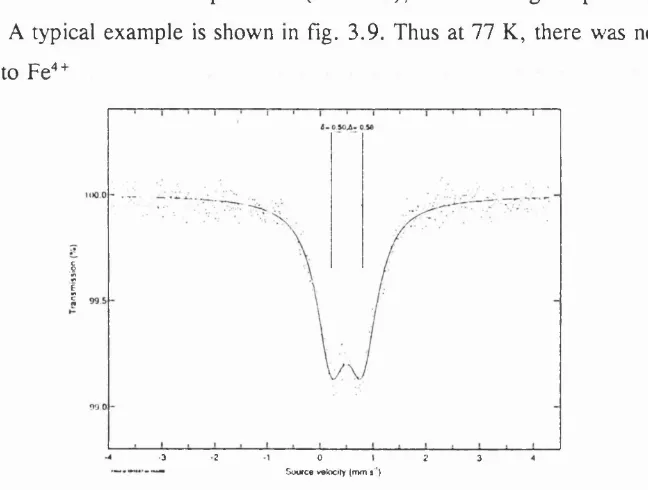
3.9 Mossbauer spectrum o f Ba^Fci gNbg 4O3 0 6 8
3.10 Resistance vs temperature for a pellet o f BagFei gNbg4O3 0
(in synthetic air) 70
3.11 In R vs 1/T for a pellet of Ba^Fei gNbg^Ogo
(in synthetic air) 70
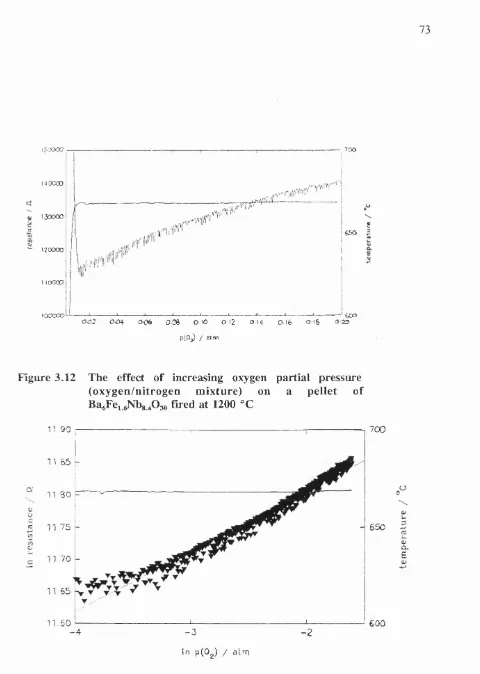
3.12 The effect o f increasing oxygen partial pressure on a pellet o f
BagFei gNbg 4O3 0: resistance as a function o f oxygen partial pressure 73
3.13 The effect in increasing oxygen partial pressure on a
pellet o f BagFei gNbg 4O3 0: In R vs In p(0 2) 73
3.14 (a) Response o f Ba6FeNb0 3o to propane 75
(b) Response o f Ba6FeNbg0 3o to CO 75
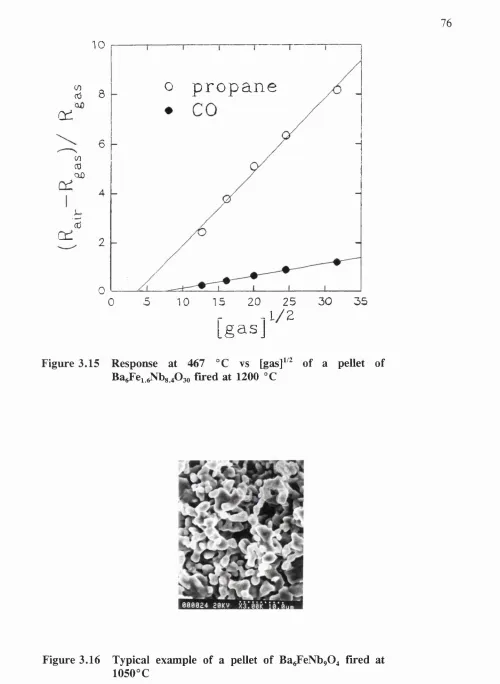
3.15 Response at 467 °C vs [gas]^'^ o f a pellet of
3.18 Ba^Fe^ ^Nhg.Ao in air, 1000 ppm carbon monoxide and
1000 ppm propane 79
3.19 Graph o f mass 44 (C0 2 ^) intensity vs reactor temperature
for the reaction 1000 ppm CO and 1000 ppm propane
over BagFei gNbg 4O3 0 80
Chapter 4
4.1 SEM micrographs o f Cr^Fci ^NbO^ 90
4.2 EPMA linescan o f Crg gFeo gNbO^ 91
4.3 Experimental X-ray diffraction patterns showing the
phase transition from monoclinic to tetragonal phase 92
4.4 Change in lattice parameters for the series Cro.2Feo.gNb0 4 92
4.5 Mossbauer spectra at 77 K o f CrxFei_^Nb0 4 94
4.6 (a) Change in chemical shift on traversing the series
Cr^Fei.,Nb04 95
(b) Change in quadrupole splitting on traversing the series
Cr^Fei_^Nb04 95
4.7 Resistivity vs chromium content for the series Cr^Fei_xNb0 4 98
4.8 In R vs 1/T for Cro.2Feo.gNb0 4 fired at 1200 °C 98
4.9 Activation energies for the series CrxFei.xNb0 4 98
4.10 Potential difference produced on heating a pellet
o f Cro2Feo_gNb0 4 99
4.11 Responses to 1000 ppm CO o f the series CrxFei.xNb0 4 102
4.13 Responses to 1000 ppm propane o f the series Cr^Fe^.^NbO^ 104
4.14 Response to 1000 ppm CO at selected temperatures for
the series Cr^Fei.^NbO^ 105
4.15 Responses to 1000 ppm CO for the second preparation
o f Cr^Fe^.^NbO^ 106
4.16 (a) Response o f Cro iFeogNbO^ to dry and moist CO 108 0)) Response o f Cro 2Feo gNb0 4 to dry and moist CO 108
4.17 (a) SEM micrograph o f preparation A o f Cro.2Feo.gNb0 4 110
(b) SEM micrograph o f preparation B o f Cro.2Feo.gNb0 4 110
4.18 (a) Response o f preparation A o f Cro.2Feo.gNb0 4 to
repeated exposures o f moist CO 111
(b) Response o f preparation B o f Cro.2Feo.gNb0 4 to
repeated exposures o f moist CO 111
4.19 Response o f Cro.2Feo.gNb0 4 to 1000 ppm CO before and
after exposure to moist air 113
4.20 (a) Resistance as a function o f temperature for Cro.2Feo.gNb0 4 before and after exposure
to moisture (prior heat treatment) 114
(b) Resistance as a function o f temperature for Cro.2Feo.gNb0 4 in a dry atmosphere
(no pretreatment) 114
4.21 Cro.2Feo.gNb0 4 (first preparation) in air and CO 117
4.22 (a) Cro.2Feo.gNb0 4 (first preparation) in air
and CO (expanded scale) 118
(b) Response plotted as a function of [gas]^^^ for
Cro.2Feo.gNb0 4 118
(c) Cro.2Feo.gNb0 4 (first preparation) in air
and propane (expanded scale) 119
4.23 (a) Cro.2Feo.gNb0 4 in air (temperature increasing) 121
0)) Cro 2Feo.gNb0 4 in air and 1000 ppm CO 122
(c) Cro.2Feo.gNb0 4 before, during and after
exposure to 1000 ppm CO 123
(d) Cro.2Feo.gNb0 4 before and after exposure
to 1000 ppm CO 124
(d) Cro.2Feo.gNb0 4 before and after exposure
to 1000 ppm CO (repeat experiment) 129
(e) Cro.2Feo.gI^ 0 4 in air and 1 0 0 0 ppm propane
(repeat experiment) 130
4.25 Cro 2Feo.gNb0 4 in air, 1000 ppm CO and 1000 ppm
propane after 5 hours at 700 °C 134
4.26 (a) Cro.2Feo.gNb0 4 in air, 1000 ppm CO and then air,
after 5 hours pretreatment (temperature decreasing) 134 (b) Cro.2Feo gNb0 4 in air, 1000 ppm CO and then air,
after 5 hours pretreatment (temperature increasing) 135
4.27 Cro 2Feo gNb0 4 in 1000 ppm CO (stepped temperature) 137
4.28 X-ray diffraction pattern o f (Cro.2Feo.gNb0 4)o.5(Ti0 2)o.5 139
4.29 SEM micrographs o f pellets (a) (b) and (c)
of (Cro 2Foo gNb0 4)o 5(Ti0 2)o. 5 140
4.30 (a) (Cro.2Feo.gNb0 4)o.5(TiO)o. 5 in air and 1000 ppm CO,
(pellet (c)) 140
4.30 (b) (Cro.2Feo.gNb0 4)o 5(7 1 0 2)0 . 5 in air and 1000 ppm CO,
(pellet (a)) 141
4.31 (Cro.2Feo.gNb0 4)o.5(Ti0 2)o. 5 in air and 1000 ppm CO
plotted as a function o f temperature (pellet (c)) 141
4.32 (a) (Cro.2Feo.gNb0 4)o.5(Ti0 2)o. 5 pellet (a) in air and
1000 ppm CO, with 5 hours pretreatment at 700 °C 142 (b) (Cro.2Feo.gNb0 4)o.5(Ti0 2)o. 5 pellet (a) in
air and 1000 ppm CO, with no pretreatment 143
4.33 (a) FTIR spectrum o f untreated Cro 2Feo gNb0 4 at
250 °C, in air 144
(b) FTIR spectrum o f heat-treated Cro 2Feo.gNb0 4
at 250 °C, in air 144
4.34 Resistivity-temperature profile for a porous pellet
Chapter 5
5.1 SEM micrographs o f iron niobates fired at 1100 °C 178
5.2 Mossbauer spectra at 77 K o f iron niobates 181
5.3 Plot o f In R vs 1/T for FeNbO^ 183
5.4 Response to 1000 ppm CO o f iron niobates 185
5.5 Response to 1000 ppn CO at 350 °C for iron niobates 186
5.6 Response o f Fei gNbg^O^ to 1000 ppm CO, plotted as
a function o f temperature 186
5.7 Response to 1000 ppm propane o f iron niobates 187
5.8 Response to 1000 ppm propane at 450 °C for iron niobates 188
5.9 Response to 1000 ppm propane o f Feo.sNbi 5O4 plotted
as a function o f temperature 188
5.10 Response to 1000 ppm propane o f Fe^ gNbo.^O^ plotted
as a function o f temperature 189
5.11 (a) Response o f Fe^ sNbo/yO^ to dry and moist 500
ppm CO 191
(b) Response o f Fe^ ^Nbo ^O^ to dry and moist 500
ppm CO 191
5.12 (a) Response o f Fe^ ^NbogO^ to repeated exposures
o f moist 500 ppm CO 193
(b) Response o f Fei o^Nbo g^O^ to repeated exposures
o f 500 ppm CO 193
5.13 Effect of moisture applied at low temperature on the CO
response o f Fe^ gNboyyO^ 194
5.14 (a) Fe^ gNbo^O^ in air 196
(b) Fe^ gNbo/yO^ in air and 1000 ppm CO 197
(c) Fe^ gNbgyyO^ in during, before and after
exposure to 1000 ppm CO 198
(d) Fe^ ^Nbo/yO^ before and after exposure to
1000 ppm CO 199
(d) Fe^ gNboyyO^ before and after exposure to
1000 ppm CO (repeat experiment) 204
(e) Fei 3Nbo. 7 0 4 in air and 1 0 0 0 ppm propane
Tables
Chapter 1
1.1 A selection o f materials from the previous literature on gas-sensitive resistors
page
18
Chapter 2
2.1 Preparation conditions 42
Chapter 3
3.1 Agreement o f experimental and simulated data
3.2 Lattice parameters for barium iron niobates
3.3 Mossbauer data for selected members o f the series
BagFe^Nb lo-x^so
3.4 Resitivities for barium iron niobates
3.5 Activation energies for barium iron niobates
3.6 Selectivities and sensitivities for barium iron niobate films
66
66
69 69 71 78Chapter 4
4.1 Lattice parameters for the tetragonal part o f the series
Cr,Fei.^Nb04 93
4.2 Mossbauer data for members o f the series
Cr^Fei.^NbO^ 0 < x < 0.6 96
4.3 Response at 250 °C for 0.1 < x < 0.3 101
4.4 Program for comparison o f CO response in dry and moist air 107
4.5 Program for the effect o f repeated exposures to CO in moist air 109
4.6 Program for the effect on the CO response o f moisture
Chapter 5
5.1 Phases present in the series Fe^N bi^A 170
5.2 Lattice parameters for the monoclinic component o f Fe^Nb^.^O^ 180
5.3 Mossbauer data for iron niobates 180
5.4 Resistivities for the series Fe^Nb^.^O^ 182
5.5 Activation energies for the series Fe^Nb^.xO^ 183
5.6 Program for comparison o f CO response in dry and moist air 190
In today’s industrialized society, the field o f gas detection is o f growing importance, with an ever-increasing requirement for sensors to detect a variety o f gases in the contexts o f combustion control, humidity measurement for industrial drying processes and inflammable/toxic gas detection.
Over the past decade or so, many materials have been used in a variety of gas- detection devices. These include systems based on SAW devices*^ metal phthalocyanines*^ (often incorporated in SAW devices), liquid electrolyte fuel cells*^, solid electrolytes*'^ and semiconducting oxides (as gas-sensitive resistors*^,p/n junction devices*® and using the Seebeck effect*^).
It was demonstrated in the 1950’s**’^, that the adsorption o f a gas on the surface o f a semiconductor can cause a significant change in the electrical resistance o f the material. This was first utilized commercially for the purpose o f gas detection in Japan in the 1960’s and 70 ’s*^°". However, one o f the major problems facing the development o f gas-sensor materials has been their lack o f selectivity*^^'^^'. There have been few reports o f truly selective gas sensors*^'^'^^'^®'^^ and o f these, none has come to any firm conclusion and adequately substantiated their claims as to what is responsible for the selectivity.
Many oxides show resistance changes in the presence o f oxidising/reducing gases. The most popular oxide material for resistive gas-sensor application has been Sn0 2*^®, which is an n-type semiconductor due to non-stoichiometry (oxygen
vacancies)*^^. Other binary oxides used have been ZnO*^°, Ti0 2 *^^ and Ce0 2 *^^. Ternary
oxides used include perovskites such as La-doped BaTiOg*^^. It has also been reported *^ that pyrochlores such as Bi2Sn2 0 7 and tungsten bronze-type niobates such as
Bi6Ti2Nbg0 3o and BagFeNbgOgo show gas-sensing properties. A selection illustrating the
is given in Table 1.1:
Table 1.1: A selection of materials from previous literature on gas-sensitive oxide
resistors,
gas material reference
CH, SnOg + Ce02 4- Pt Butta et al*^
CH4 Sn0 2 + Ti0 2 Chung et al.*^^
CH4 Sn02 + Rh Lee et al.*^^
CCI4 Sn0 2 Torvela et al.*^^
C2H5OH Sn02 + Pd Sberveglieri et al.*^
C2H5OH ZnSnOj Shen and Zhang*^^
C2H5OH La2.xSr,,Cu0 4 Grantscharova et al.*^
C2H5OH Sn0 2 + LagOg Matsushima et al.*^^
C4H,o oi - Fc2 0 3 + Sn + Pd Lee et al.*^^
C02 Xn2 0 3 + CaO Mizuno et al.*^^
C02 Sn0 2 + Laz03 Mizuno et al*^
CO Sn0 2-x Lee et al.*^^
CO Sn02 + Pt Lee et al.*^^
H, Gaz03 Fleischer and Meixner*^^
H, Sn0 2 + In/Bi SberveglierP*
H, TiOz/Rh Munuera et al.*^^
Hz ZnO Yamazaki et al.*^^
Hz InzOz Y.Yasukawa et al.'"^
H2O vapour a - FCzOz Pelino et al.*'^^
H,S SnOz Ando et al.*'^^
H^S SnOz Lantto et al.*'^®
NO2 In2 0 3 + SnOj Sberveglieri et al.*'^^
NO2 LaFe0 3 Matuura et al.*"^^
NQz ZnO + Ga Matsushima et al/'^^
NO2 SnOg + In + V Low et al.*^
NO, SnOz doped with Cd Sberveglieri et al.*^^
NH3 Zn^GeOyNj Rosse et al.*^^
NH3 ZnO + A1 Nanto et al.*^^
NH3 WO3 + Au Maekawa et al.*^
NH3 Or1.8Tio.2O3 Moseley and Williams*^^
0 , Sn02 + Li Sberveglieri et al.*^^
0 , SrTi03 + Mg Yu et al.*^^
0 , Ce0 2 Beie et al.*^^
PH3 Sn0 2 + Cu Ratcheva et al.*^*
TMA' Ti0 2 + either Ru or In Takao et al.*^®
TMA/DMA" ZnO + A1 Nanto et al.*“
1.2
Mechanism of gas sensitivity
Semiconducting oxides such as those in table 1.1 have generally been classed into two categories. In the first, ionic defect states*^^ are caused as a consequence o f intrinsic disorder or by a change in the stoichiometry o f the material (either by equilibration o f the solid with the gas phase or by doping with aliovalent impurities). These defect states*®^’^^ take the form o f one or more o f the following:
a) Schottky defect: These are pairs o f atoms (anion and cation) that leave their normal lattice sites to migrate to the surface, causing the formation o f a pair o f lattice vacancies
M X M X M X M X
X M M X X M
M X M X M X M X X M X M X M X M
b) Frenkel defect: this only involves one type o f ion (usually the smaller) and occurs when it is displaced from its normal lattice position to an interstitial site
M X M X M X M X X M X XIVI X M M X M X M X M X X M X M X M X M c) anti-site defects
M X M X M X M X M X M X X M X M M X M X M X M X
For example*^\ in titania, Frenkel defects induced by reduction processes are oxygen vacancies and interstitial titanium. Their relative numbers are governed chiefly by the temperature; oxygen vacancies dominate below ca. 1000 °C.
1) 2TiTi'' + Oo^ > 2 T \ j / + Vo * + 1/2 2) 2[TÏ]^,' --- .T ^ ^ + n^
Here, equation 1) represents the creation o f a donor state, a reduced titanium atom and equation 2) represents the activation o f an electron (nO from the donor state to the
conduction band
In general, the relationship between oxygen partial pressure and the electrical conductivity o f a semiconducting oxide gas sensor may be represented by
£7 = A exp(-EA/kT)p(02>^'“
where cr denotes the electrical conductivity, A is a constant, is the activation energy for conduction, p(0 2) is the oxygen partial pressure and n is a constant determined by
the type o f defect involved in the equilibrium between oxygen and the sensor.
At high enough temperatures (generally at 700 °C and above), all oxides conduct in this way. Another example o f such a material is ceria. For many materials, the conduction mechanism has both ionic and electronic components. Examples o f mixed ionic-electronic conduction occur in oxygen ion conductors such as UiCeOj, CeiThOj and gadolinium zirconium titanates (GZT)*^^. Tuller*®^ illustrated that CeOj solid solutions show a variety o f different conduction mechanisms according to the oxygen partial pressure. Figure 1.1 shows four regimes where different dominant defects are possible. As p(0 2) was varied, the stoichiometry adjusted accordingly, varying the
concentration o f the different species:
1) electrons n '
2) doubly positively charged oxygen vacancies Vq**
I
a
m
K
n=[Vo] n=2[Voi
n=[U c],„,
2[o:]=[U ce]
tot/o^fn-E) /Po2(in-E)
' CeJtot
S t o i c h i o m e t r y
log P02
F igu re 1.1 D efect d ia g ra m fo r U tC eO j, showing the c o n ce n tratio n dependences o f various defects on p(0)2, fo r fo u r regim es from Toiler
a) thermal excitation o f carriers from the valence band X # p + n^
b) the ionization o f donors D # 4- n
c) ionization o f acceptors A' # A + n'
d) charge balance p + foNo = f.N^ + n"
e) conductivity cr = fjL^&n + /XpCp
Where
a = conductivity Nq = number o f donors per unit volume e = electronic charge = number o f acceptors per unit volume /Xe = electronic mobility /Xp = hole mobility
fo = fraction o f ionized donors f^ = fraction o f ionized acceptors
p and n are concentrations o f holes and electrons respectively
Kj and K3 are constants dependent upon the thermal excitation o f carriers to the valence
band and the ionization o f acceptors
Using this scheme, Williams and Moseley*^ showed that conductivity can be expressed in terms o f the concentrations o f surface donor and acceptor states.
o-/e = /XeKjNo/NA + /XpKiNa/KjNd
Thus, the conductance type (n or p) and the magnitude of the response will be determined by the relative concentration o f donor and acceptor states.
It is a characteristic o f the lower temperature regime that the conductance of an oxide may become very sensitive to the presence o f reactive gases at low concentration in a background o f air. It is currently postulated*^^ that oxygen forms charged states (fig. 1.2) at the solid/gas interface by abstracting electrons from the conduction band
o f the oxide, to form species such as O , CF and O2 . O f these, O and O2 have been
react with reducing gases (R), such as CO, to form RO, which is desorbed. The reaction to form RO results in the release o f electrons to the solid to give a change in electrical conductivity*^*’^^.
CO + O' *C02 T n^
For an n-type semiconductor, this is measured as a decrease in resistance. W hen the reducing gas is removed from the atmosphere, the original surface state density is restored by reactions such as
O2 + n ^— > O2
Thus, surface-active materials only function in the presence o f oxygen. This has been illustrated by Jones et al.*^^, who showed that the response of a single crystal o f ZnO to CO is large in air, but negligible in nitrogen.
During gas sensing, anionic chemisorption (described in the following section) takes place. Here, the anionic species formed are those o f oxygen, which act as acceptor states. Thus the analyte gas (for example, CO) has no direct role in the sensing mechanism; it only controls the number o f surface states by reaction with oxygen. It is later shown in chapter 4, that for CO, there is indeed no direct adsorption onto the surface o f the oxide.
S u r f a c e Barrier Heigh t eA4>c C o n d u c t io n
Band
Donor Level
S u r f a c e S t a t e
zza f
Fermi Level
Vale nce Band
- 51 ;
c a,
D i s t a n c e . z
Metal oxide gas sensors show sublinear responses to reducing gases. The resistance R, o f a gas sensor, is related to the partial pressure, p, o f a combustible g a s : 61,70,71
R = RoP“
where typically 0 < n < 1.
Windischmann and Mark*^^ showed that for CO, the response was proportional to the square root o f the gas concentration (detail given in appendix 1.1). In the current work, the response o f a gas sensor is defined as (R ^- R g J / Rg^s (or Aa/cTo where a
denotes the conductivity). For an n-type material, this gives a positive number. For a p-type material, the response is defined as Ap/po or (Rq - Rg)/Ro, where p denotes the resistivity. The reason for choosing this definition is illustrated in appendix 1.2. Various different definitions have been used by other authors. Thus a graph o f the response vs [gas]^^^ for CO should be linear and using this graph, it is possible to define the gradient as the sensitivity.
The model described above for response to reactive gases was proposed*^^’^^’^^ for conduction in thin films. This model is also applicable to porous bodies such as pellets. In such porous bodies, the mechanism by which the conduction takes place will depend on the nature o f the intergranular contacts. Three cases o f intergranular contact have been postulated*^^:
1) well-sintered (large) open necks: Such necks are wider than the depletion layer thickness. Thus there exists a path o f low resistance through the middle o f the
Figure 1.3 (a) ‘open n eck ’ m odel, from Williams*^^
2 ) medium sintering, narrow, closed necks: here, the neck will be fully depleted.
In contrast to the open neck model, the resistance will be high throughout the neck and thus conduction will be determined by activation o f electrons from surface states, being directly controlled by gas adsorption.
Figure 1.3 (b) ‘closed neck ’ m odel, from Williams*^^
F ig u re 1.3 (c) Schottky b a rrie r m odel, from Williams*^^
In reality, conduction is likely to be controlled by more than one o f these mechanisms. From these models, it is clear that the nature o f the sintering and the subsequent grain structure will have a major influence on the electrical response o f these materials.
In both bulk and surface-sensitive materials, an increase in oxygen partial pressure leads to a conductance decrease for n-type semiconductors and a conductance increase for p-type semiconductors*^'^. Thus, by examining the effect o f variation in oxygen partial pressure, it is possible to define the conductivity type o f a chosen material.
1.3 B an d th eo ry related to gas sensing
The oxides in the present work are believed to act principally as extrinsic semiconductors in that over the temperature currently studied, thermal promotion of electrons from the valence band (V.B.) to the conduction band is o f relatively minor importance. Instead, it is envisaged that conduction is due to a donor level beneath the conduction band.
acceptor state which is between the valence band and the donor level in energy. As it abstracts electrons from the donor states, it raises the Fermi level (shown earlier in figure 1.2). In this case, the conduction band becomes depleted o f carriers, so that the energy is highest at the solid/gas interface. As a result of the depletive chemisorption, band bending occurs. However, in a p-type material (figure 1.4 (b)), the valence band is filled and the surface states form an acceptor level above it. In this case, transfer of electrons from the filled V.B. to the acceptor states causes no change in energy o f the conduction band and (in this depletive chemisorption) no band bending occurs.
V c le n c * b e n d ( f ii l e d )
Figure 1.4 (a) Anionic depletive chemisorption on an n- type sem iconductor. Extracted from
Chemical Kinetics, K .J.Laidler, M cGraw- Hill, New York, 1965
o o o o o o o o (e m p ty )
Figure 1.4 (b) Anionic cumulative chemisorption on a p-type sem iconductor.
If a new transition metal ion is introduced, the carrier density will change. For example, if Cr^^ (d^) is introduced to replace Fe^"^ (dO, the substitution o f Cr^^ for Fe^"^ would be expected to lead to the formation o f holes and increase the p-type character. The charge density may be changed by substitutions which force a valency change in order to maintain electroneutrality. Williams*^^ reported that it was possible to lower the conductivity o f barium ferrate, by substituting elements o f valency 4 or 5 (Ti or Ta, for example) for iron. He found that in the series BaFei yTayOg ^ (0 < x < 0.5), BaFe(III)o.5Tao. 5 0 3 was an n-type semiconductor, but that BaFe(III,IV)0^.x was
p-type. It was interpreted as follows: in the n-type reduced material, Fe^^ is reduced to Fe^'^, thereby creating electron-donor states and (more) oxygen vacancies were formed. However, in the p-type oxidized material, Fe^^ oxidizes to Fe"^^, creating holes and also interstitial oxygen is formed.
Similarly, if Sb^^ is substituted into Sn0 2 , some o f the Sn"*^ will be reduced to
Sn^^ in order to achieve the charge balance. For every y Sb introduced into Sn0 2 , for
each Sn site there must be two oxygen sites. However, the Sn site may be occupied by Sn or Sb. Each Sb on an Sn site introduces one positive charge, so one Sn"^^ is reduced to Sn^^ for every two Sb, leading to
(Snsn*(i-3/2y))(Snsn ^ )y/2(Sbsn )y ^ 2
In general terms:
(l-y)S n0 2 + y/2 Sb2 0g = (Sni_ySby) 0 2 + y/4 O2
Thus, the Sn(II) species (Sus/'' ) acts as an electron-donor state, causing the conductivity to rise.
Control o f the carrier density has been illustrated by Clark and Donaldson*^^, who showed that for M0O3 and WO3, it was possible to use lead and tin chlorides and
around the tin on increasing the oxide content. The authors postulated that at the halide- oxide interface, acceptor states are generated, which create holes in the s-band (Sn° = 5s^, Pb° = 6 s^, Sn^ = 5s° P b ^ = 6s°). Thus a p-type conductor was formed, so that
increasing the relative oxide concentration increased the conductivity until the acceptor band became full and, due to reduced carrier mobility, the conductivity decreased. In the case o f the SnBr2-W0 3 system, the conductivity rose, decreased and then rose again.
In the case o f SnBr2-W0 3 , it was suggested that the second rise in conductivity was due
to the involvement o f a second impurity level.
It should also be possible to introduce extra electrons or holes by changing the stoichiometry. In the present work, it is initially proposed that for barium iron niobates (chapter 3) and iron niobates (chapter 5), that an increase in iron concentration would lead to the oxidation Fe^"^— ^Fe"*^ and hence an increase in p-type behaviour, and that an increase in niobium concentration would lead to either the reduction Nb^"^— cr Fe^^—>Fe^^, and hence an increase in n-type characteristics. This is discussed more fully in chapter 3.
1.4
Selectivity
Various authors have suggested that selectivity is due to one or both o f two related factors. 1) geometry and microstructure, which have subsequent effects on the
rates o f diffusion o f the gases and 2) relative temperatures o f maximum responses for
Morrison*'^* has attempted to create specificity in sensors by using surface-state additives. This was applied to two systems. In the first, it was proposed that as V2O5
is an n-type semiconductor with a very low conduction band energy, applied as a surface additive, it would be expected to act as an acceptor. In addition, it was also stated that V2O5 is an active catalyst for the oxidation of xylene (dimethylbenzene). This
was added to the surface o f TiÛ2 and it was found that this combination was sensitive
to xylene and that the sensitivity to xylene was much greater than to CO. However, the comparison with pure T i0 2 was not provided and it was also unclear whether the V2O5
was functioning merely as a catalyst or creating surface states. In the second example, it was postulated that sulphanilic acid (4-aminobenzenesulphonic acid) NH2-C6H4-SO3H
, as an amine, would be expected to possess donor properties and that the addition of this to nickel oxide, a p-type semiconductor, would enhance the oxide’s response to oxidising gases. This caused a large response to NO2. However, this response was
irreversible. Again, the results for the pure material without sulphanilic acid were not shown.
To date, apart from works relating to chapter 3 o f this thesis*^^ *®, there have been no detailed studies o f the effects o f firing temperature and resulting microstructure in relation to selectivity in gas sensing. W ork has, however, been published on the effects o f sintering temperature on the gas sensitivity. Takahashi et al.**^ showed that for Sn0 2 prepared via a sol from SnC^, H C l and urea, the sensitivity to oxygen
(measured with respect to a nitrogen atmosphere) was highest for gels fired at lower temperatures (400 °C as opposed to 1100 °C). In contradiction, Ando et al.**^ reported that the H2S sensitivity o f Sn0 2 thin films, hydrothermally synthesised via the gel from
aqueous NH 4HCO3 and SnC^, was greatest for samples fired at higher firing temperature (700 °C as opposed to 400, 500 and 600 °C).
Although not a sintering study, a link between microstructure and gas-sensing characteristics with respect to the phase transition o f TiÛ2 from rutile to anatase in Sn0 2
- TiÛ2 (Sb, Pt) hydrocarbon gas sensors has been briefly mentioned by Chung et al.*^^
and reaction o f the gases. Komori et al*^ showed that in a SnC^ thin layer, it was possible to obtain selectivity to methane over butane, ethanol, hydrogen and carbon monoxide at 520 °C. They postulated that this selectivity was due to the different relative combustion and reaction rates so that the other gases burn on the outside o f the SnÛ2 film. However, the authors did not provide details o f how the gas components
were analyzed or present the supporting data.
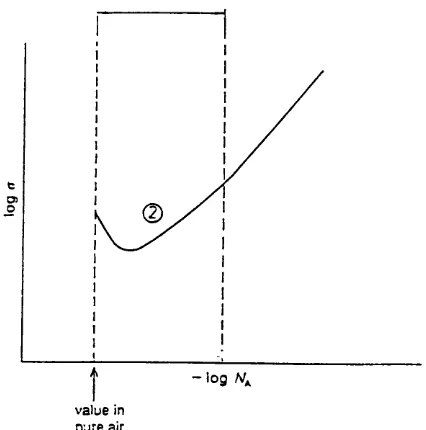
Yamazoe et a f ^ \ in work relating to the catalytic properties o f metals on Sn0 2,
showed that it was possible to obtain selectivity to propane over hydrogen, carbon monoxide and methane, using SnC^ doped with Ag, operated at ca. 370 °C. Here it was shown that the gas responses covered different temperature ranges (fig. 1.5), CO responding at low, and propane at high temperature. However, discussion o f the selectivity was not given. In this work, it was shown that the tem perature required and the rate o f catalytic oxidation for both QHg and H2 over SnC^ were dependent on the
metal additive.
100 200 300 ttOO / *C
F ig u re 1.5 Responses fo r SnOj sensor doped w ith Ag, from Yamazoe et al.**^
Malchenko et al.*®^ found that with Bi2 0 3 doped In2 0 3, it was possible to obtain
selective detection o f CO in the presence o f CH4 in air because o f a difference in
In addition, Lalauze et showed that in SnC^ sensors pretreated with SO3,
it was possible to obtain selectivity to H]S over NH 3, CO2, N O ,, H2, CO and SO2 at
100 °C. However, no results for the untreated SnC^ sensors were presented. Like Komori et al., they showed that the relative responses to different gases were temperature dependent.
Torvela et al.*^^ stated that by raising the operating temperature, it was possible to practically eliminate NO and SO2 interference in CO detection using SnC^ films
activated with a Pd catalyst, thus suggesting some degree o f temperature dependence of the selectivity. Smith et al.*^^ stated that the selectivity in Au-loaded W O3 films was
temperature dependent; at 200 °C, there was a peak in the H2S response, whilst the H2
sensitivity peaked between 225 and 250 °C, giving selective H2S detection.
Concentration gradients within the sensor material have been discussed in works by Williams*^\ M cAleer et aL^^ and Shimizu et al.**® The effects o f combustion on sensor response have been outlined by M cAleer et al*^, who suggested that the observed response is dependent upon the rate o f combustion and reaction o f the gas on the outside o f the pellet. The authors showed a porous body (fig. 1.6) as being surrounded by a combustion zone which becomes narrower as the temperature increases. Thus it was proposed that combustion o f the gas results in a concentration gradient within the sensor and that if the combustion rate is high enough, all the gas is burnt in a thin outer shell o f the device.
G ê s a c c e s s
C c ^ b u s T i o n z o n e
---“s ë^upport
/
I
\
C o n t a c t 1 C o n t a c t G a s a c c e s s
P r o d u c t (eQ.CO2.H2O)
P o s i t i o n
P e a c t a n t ( e Q . C H 4 . C O )
C o n c e n t r a t i o n
diffusion profile is controlled by the pore structure o f the material. The less reactive gas would reach the centre o f the pellet and cause conductivity changes, whereas the reactive one would have little effect, burning on the outside. It was proposed that it is possible to prom ote selectivity in the response for a less reactive gas over one that is more reactive.
Shimizu et al.*** have measured the relative responses to hydrogen on both the inside and outside o f a cylindrical hollow thick film SnC^ sensor. W hen hydrogen was applied from the outside, it was found that the interior exhibited a much higher hydrogen sensitivity than the surface. It was also found that the oxygen concentration was lower in the interior. It was suggested that the low interior oxygen concentration was due to the larger molecular size o f oxygen and its reaction with the hydrogen on the outside during combustion. The higher hydrogen sensitivity on the inside was interpreted as being due to a reduced concentration o f oxygen species in the centre leading to a higher carrier concentration. Thus the relative rates o f diffusion played an important role in the gas response. The authors concluded that the key factors controlling sensor response were microstructure, thickness, catalytic activity and electrode position.
S n O jo r Gold electrodes P orous muliite tube P i'S n O j film (Surface)
Oj(Hj) N , . 0 , (H,)
Gold electrodes (Interior)
Lead wire
1.5
Outline of this thesis
The objectives behind this thesis are twofold; Firstly it was required that a suitable material be found and characterized that was capable o f detecting propane in the presence o f carbon monoxide, for potential application in the monitoring o f car- exhaust emissions. In addition, the second aim was to establish and characterize a material capable o f detecting carbon monoxide, with a view to general environmental monitoring applications.
This work is based on two parent systems, both o f which are currently believed to conduct electronically. Both of these materials have not been routinely used for gas- sensing applications before in the general literature, although their gas sensing properties have been briefly reported*^’^ ’*®. In addition, they both offer opportunities for manipulating the stoichiometry in order to attempt to tailor the gas-sensing properties. The families o f compounds synthesized in this thesis were
(a) Ba^Fe^Nbio-xOso (Chapter 3), (b) Cr^Fei.^NbO^ (Chapter 4) and Fe^N b^.A (Chapter 5), derived from the parent compounds Ba^FeNbgOjo for (a) and FeNbO^ for (b) and (c).
Parent compound (a) was chosen for this study as it has been shown, in previous work*^, to exhibit an anomalous property (to be later discussed in chapter 3). Compound (b) also gave encouraging results in previous (unpublished) work**^.
In series (a), it was attempted to alter the electron-donor density by changing the stoichiometry o f the parent compound. Theoretically, this could have been achieved by altering the Fe/N b ratio. The relationship between stoichiometry and gas adsorption properties in oxides has not, to date, been characterized extensively in gas-sensing devices. However, there has been work published on the adsorption o f CO2 on Sr/Ca
hydroxyapatites o f varying Sr/Ca ratio*^.
and series (c) it was also attempted to alter the donor density by changing the Fe/Nb ratio.
All compounds were prepared by solid state reaction o f the oxides. In all cases, the materials were characterized by scanning-electron microscopy (SEM ), X-ray powder diffraction (XRD) and in some cases, Mossbauer Spectroscopy and / or electron microprobe analysis (EPMA). Electrical properties such as resistivity and activation energy were determined and the responses to carbon monoxide and propane investigated.
It is postulated in this work that three major factors influence the gas selectivity and sensitivity o f these materials: (1) the relative combustion temperatures o f the gases
in the atmosphere surrounding a particular material (2) grain size and porosity resulting
3
Appendix 1.1
W indischmann and Mark*^^ and also Wiliiams*^^ developed a model o f ‘surface-trap lim ited’ conductivity. In this case, all o f the electrons from donor states in the oxide are trapped on surface species, the sensitizer A (negatively charged oxygen species). For the adsorption o f sensitizer onto empty surface sites:
A(g) + S ^ O + n ' S^(A-)
and for the combination o f the sensitizer with the reactant gas (CO, for example):
Sa(A-) + R ^ ---) RO + Sa( ) + n '
The rate at which conduction electrons are formed is represented by the equation
d (n ')/d t =
kfRS^(A-)
+ k ,S ^ (A ) -k,(n)S^(
)P^ (1)They assume that the rate o f dissociation o f adsorbed sensitizer is much less than its rate o f formation
(a) k.iS^(A-) < <
k,(n)S(
)? ^and that the number o f vacant sites is much less than the number with adsorbed sensitizer
(b) S^O < < S^(A')
so that Sa(A‘) may be considered constant^.
All the electrons from the donor state are trapped as S(A") so that the surface concentration o f this adsorbed surface species is determined by the thickness o f the oxide film and the donor density o f this film. The authors assumed that the change in surface coverage caused by the reaction is negligible. Simplifying equation (1) with these assumptions,
d(nO/dt = - ^ (n )S ^ ( )
vacant site created, one conduction electron is released, the number o f conduction electrons is equal to that of vacant surface sites i.e.(n ') = Sa( )
From equation (2),
« Pr =
and thus n ' = (oj/iS.Pr)^'^
Appendix 1.2
(R ^ - Rgas)/Rgas was chosen as the definition o f response for an n-type semiconductor. This allows for the conductance/resistance to have a positive value when the gas concentration is zero, with a increasing with increasing gas concentration. This can be modelled simplistically as
CTg = (To (1 + f[gas])
jg/jo - 1 = f[gas]
and ((Xg - (To)/(To = Aa/ffo = f[gas]
but as ( 7 O' 1/R
Acr/ffo = (R a ir - R g J / R g a s
Similarly, for a p-type material, the resistance increases with increasing (reducing) gas concentration and to allow the resistance/conductivity to have a positive value when the gas concentration is zero,
Rg = R o ( l + f [ g a s ] ) Rg/Ro = 1 + f[gas]
Rg/Ro - 1 = f[gas]
Chapter 2: Experimental
2.1 Preparation of compounds
Compounds in all series were prepared by solid state reaction: the untreated oxides (Fe2 0 g Fluka > 99.0 %, Cr2 0 g Fluka > 99 %, Nb2 0 ^ Fluka > 99.9 % (later
changed to Johnson Matthey Grade 1) and, in the case o f the barium iron niobates, BaCOg Fluka > 99 %) in the relevant stoichiometries, were milled with ceramic (steatite for series (a) and (b) and zirconia for series (c)) beads in a ball mill. The solvent was then evaporated and the resulting powder cake fired for 12 hours . The solid produced was ground for 5 mins. in a mechanical grinder, pressed into 13mm diameter pellets o f approx. 3-4 mm thickness, using pressures 1-2 tons (0.75 - 1.5 ton cm’^) and then refired at the same temperature for another 12 hours. Preparation conditions are shown in table 2.1 (exceptions are shown in appendix 2.1). The phases in these materials were identified using powder X-ray diffraction and their microstructures were characterized by scanning-electron microscopy (SEM). In some cases, the compositions were confirmed by electron probe microanalysis (EPMA) and also in some cases, the Mossbauer spectra at 77 K were recorded.
Table 2.1 Preparation conditions
series milling time
(hours)
pressing pressure (tons)
firing temperature C C )
(a)
Ba^Fe^Nbio-xOso
9 1 . 5 - 2 (1.125-1.5
ton cm"^)
1 2 0 0
(b) Cr^Fei.^NbO^ 18-24 1-2 (0.75-1.5 ton
cm‘^)
1 2 0 0
unnecessary, and most o f the samples in this work were used as pellets with no preparation. The instrument was operated at 25 kV and 60-80 mA (beam diameter of a few microns (dependent on aperture size)).
2.3 X-ray diffractometry
In all cases, powders made from the pellets were used. For series (a) (on a Philips PW 1050 diffractometer), films were examined in reflection geometry mounted on a glass / metal slide. Co-K^ radiation was used ( operating at 35 kV, 40 mA, scanning 5 to 90 °, with a 2 0 step o f 0.05 °m in "\ counting for 3 seconds per point and with a Ni filter).
For series (b) and (c) (on a Siemens D5000), the samples were examined in transmission geometry, spread onto adhesive tape and placed in the middle o f a circular sample holder. Monochromated Cu-K^ radiation was used ( 10-90 scan step o f 0.02 °, sampling time 2s and sample spin at 60 rpm).
2.4 Electron probe microanalysis
Electron probe microanalysis (EPMA) linescans (Fe and Nb in series (a), Cr and Nb in series (b)) were carried out simultaneously on a JEOL Superprobe JXA-8600 equipped with twin wavelength-dispersive X-ray detectors (beam size o f 5/xm, scanning over approx. 4.5 mm). Sample pellets were set in resin and well polished prior to use.
2.5 Mossbauer spectroscopy
Mossbauer spectroscopy involves the recoil-less emission (by the source) and resonant reabsorption (by the sample) o f 7 r a d i a t i o n * ^ I t is used to probe the energy
states at the nucleus. via the interaction between the nucleus and the surrounding electron density. The source provides a monochromatic beam o f 7 -rays, the frequency
during emission, the momentum can be taken up by the whole crystal, leading to a small recoil velocity and small Doppler broadening. W hen the 7 rays from the source
have the exact energy to match the energy gap (ground state to excited (usually the first excited state)) o f the sample nuclei, the 7 ray is absorbed and immediately re-emitted
as resonance fluorescence.
The Mossbauer technique is sensitive to the s electron density, as only the s electrons have a finite probability o f occuring at the nucleus. The Mossbauer spectrum is obtained by plotting the percentage transmission (number o f counts) o f the 7 rays
transmitted by the sample at each instant as the Doppler velocity (mm s'^) varies. A line in the spectrum occurs when the energy of the source is equal to that of the absorber, so that resonant reabsorption may occur (fig. 2.1 ). If the source is identical to the sample, the maximum resonance will occur where velocity = 0 .
g I— CL
CC
O CO
0
— V ^
0
+v
V E L O C I T Y
F ig u re 2.1 Typical single line sp ectru m obtained w hen source a n d sam ple are identical from A.R.West*^
Upon excitation, the radius o f the nucleus changes, leading to a change in s- electron density. For most isotopes, that o f the excited state is largest. However, in some cases, for example ^^Fe, the ground state has the largest radius. The isomer shift, Ô, measures the difference between the valence s orbital populations of the Mossbauer atom in the sample and the source.
increase in electron density will lead to an increase in ô. However, where AR/R is negative, such as in ^^Fe, in increase in electron density will be seen as a decease in Ô.
^^Co undergoes spontaneous electron capture to give a metastable state o f ^^Fe which in turn decays to the ground state via gamma ray emission, which includes the
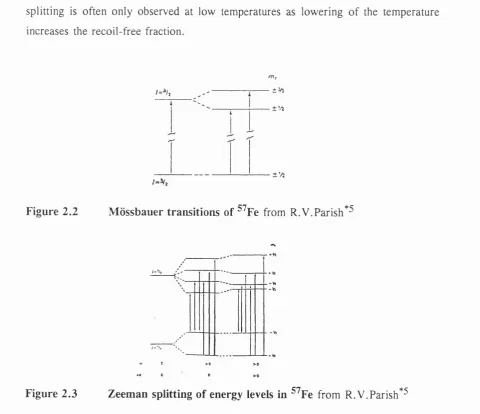
14.4 keV Mossbauer gamma ray*^. ^^Fe has an excited state o f I = 3/2 where I is the nuclear angular momentum quantum number. However, for I > 1/2, there is non- spherical charge distribution which is characterized by a nuclear quadrupole moment. W hen this experiences asymmetrical electronic charge distribution, an electric field gradient (EFG) is produced, which splits the nuclear substate into two substates, characterized by mj = ^ 1/2 and mj = - 3/2 (figure 2.2). This leads to a doublet, with a quadrupole splitting, A.
W hen there is a magnetic field at the nucleus, Zeeman splitting occurs*^. The field can originate either within the atom itself, within the crystal via exchange interactions, or as a result o f the interaction o f the compound being placed in an externally applied magnetic field. The magnetic field at the nucleus is dependent on a number o f factors, including Hg, the Fermi contact term, which arises as a result o f the interaction o f the nucleus with an imbalance in the s-electron spin density. In ^^Fe, Hg is the most significant term contributing to the magnetic hyperfine splitting. The origin o f Hg may be unpaired s-electrons, or indirectly as a result o f polarization effects on filled s orbitals. These can occur if the atom has unpaired electrons in the d- or f- orbitals, or if it is chemically bonded to such an atom. The interaction o f an unpaired d-electron with s-electrons o f parallel spins will be different to that with s-electrons of opposed spins, leading to a slight imbalance o f spin density at the nucleus and a magnetic field.
splitting. H owever, the magnetic splitting is also dependent upon the spin relaxation. Generally, in paramagnetic compounds, the spin relaxation is usually rapid and no magnetic splitting is seen. In cases of ferromagnetism and antiferrom agnetism , the relaxation rates are slower and a splitting will be observed. The internal fields found in iron compounds and alloys are generally strong enough to generate clear, six-line spectra.
For nuclear states with I > 0, 21 + 1 substates are produced, so that the ground state with 1 = 1/2 splits into 2 substates and the excited state o f I = 3/2 splits into four substates. Due to the selection rule Amj = 0 , - 1 , six transitions are possible (figure 2.3) and a sextet is observed. If the sample is composed o f randomly oriented crystallites, the intensities of the lines are 3:2:1:1:2:3. H owever, magnetic hyperfine splitting is often only observed at low temperatures as lowering o f the temperature increases the recoil-free fraction.
±%
Figure 2.2 M ossbauer transitions of ^^Fe from R.V.Parish*^
-h
possible to estimate the relative amounts o f these species by integrating the respective areas under the peaks.
The M ossbauer spectrum of BaFe0 2 72, a compound containing iron in both the + 3 and 4-4 oxidation states, has been reported in the literature*^. At 293 K, a broad asymm etric peak was produced (fig. 2.4). However, at 4.2 K, two different sextuplets were observed (fig. 2.5) as a result o f magnetic ordering and the relative quantities of the iron species were estimated.
In the present work, experiments were carried out on a Driver-Transducer- MS2000 (ES Technology) with data buffer, gas-filled proportional counter and single channel analyzer (SCA) Canberra 2030. ^^Co in a Rh matrix was used as the source.
0
-6 2 2 L
0
01
Figure 2.4 M ossbauer spectrum of BaFe0 2 7 2 at 293K, from Grenier et al*^
ihf (m m j-')
8 12
- 1 2
0
01
4.6 Instrumental: Electrical Measurements
For some o f the very first experiments, a manual 4-pellet rig was used. However, the majority o f the samples were tested in an automatic 4-pellet test rig. The test pellets were sandwiched between gold electrodes, which were separated by alumina spacers (fig. 2.6). Gold was chosen as an electrode material as it is not a known catalyst and there were no materials inside the furnace with known catalytic activity with respect to the gas mixtures. The sample was surrounded by a silica tube, with gas inlet and electrical connections at one end, and gas outlet at the other end. The electrode / pellet area (fig. 2.7) was surrounded by a tube furnace. Connections inside the furnace were with gold wires. A 2-point D C. resistance measurement method was used. Resistances were measured by a digital multimeter and transferred to a 386 microcomputer via an IEEE 488 interface. The resistance measurement channels were selected using a relay multiplexer. The potential difference applied across the specimen (details in appendix 2.2) and the maximum current flowing depended upon the measurement range. The temperature inside the centre o f the tube furnace was measured with a chromel / alumel thermocouple.
The gases were switched on and off by solenoid valves and their flow regulated using Tylan model FC-260 mass flow controllers (MFCs) (fig. 2.8). Each mass flow controller was connected to a gas-control box (RO-28-RS Tylan) which was run from the computer via a Digital-analogue converter (DAC). The M FCs had a maximum flowrate o f 500 cm^ (STP) min"^ and a minimum rate o f 6 cm^ (STP) m in "\
G a s Inlet
E l e c t r i c a l
C o n n e c t i o n s
Si l i c a
Pellet Area
R o d
_
)
" - h r — " '
HEAT
G a s
O u t l e t
Alumina Spacer
Pellet of Material Under Test
Gold Electrode
S ilica R o d
P r o v id e s
P r e s s u r e
F or
C o n ta c t s
HEAT
Flow Diagram for the Multiple Pellet Rig
D ire c t C o n ta c ts to th e P e lle ts
M u ltip le x e r
O u t p u t
M u l t i p l e x e r C o n t r o l L in e s
i---C h 1 C h 2
Mass Flow Control Lines
Mass Flow
Controllers
and Solenoid
Valves
Isolator
S olenoid C o n tro l Box
F u r n a c e
P ow er
S u p p ly G as C o n tro l Box
D A C P M IE E E
The concentration o f test gas was regulated by mixing the test gas with pure a ir^ The M FC ’s produce a given concentration by adjusting the relative flowrates, and this in turn is based on properties such as the thermal conductivity and density o f the gases. Since the M FC ’s were calibrated in nitrogen, correction factors for the flow rate must be applied to all other gases. As long as the same diluent is used in both channels, the concentration o f the test gas will be correct, subject to a small correction outlined below. However, the flowrates will deviate from those specified in the program. The correction to the concentration may be computed as follows: If channel 1 = 20 % O2
/ 80 % Ar and channel 2 = 1000 ppm propane (or CO) in 20 % O2 / 80 % A r, then
the test gas would have slighty different properties to the diluent and a small correction to the concentration will be required. The conversion factor betweeen control voltage and obtained flow rate for the oxygen / argon mixture has been given by the manufacturers as 1.305. The conversion factors for a) pure propane and b) pure CO have been given (same source) as 0.36 and 1.00 respectively. Thus assuming a linear relationship between the conversion factor for the propane/oxygen/argon mixture and the percentage propane in the mixture, a rough conversion factor for the mixture may be estimated (figure 2.9) and hence the relative flow rates for sample gas and diluent computed. It is evident from fig. 2.9 that the correction to the gas concentration caused by difference in calibration correction in the two channels may be neglected.
(co n v ersio n f a c to r (o r O j/X r mlicloft
- 1.305) 1 .4
(conversion
factor of C^H« r«l to
s- 0.36) 0.8
0.6
10 0 * 99 98 97 53
Xr/0,
r. Ar/Oj
Figure 2.9
Conversion factor for the test gas mixture
poorly formed contacts between the pellets and the electrodes. However, it was later found that the ‘spikes’ were a) due to interference from the furnace controller, b) because the relay contacts had not settled before the measurement was taken and c) due to scaling errors in the DVM. It was later found that the evaporated gold contacts were unnecessary.
lc-KX>9
le+008 - 700
Jc+007
U+006
» 1e+005
le+004
le-t003
ie+0(D2
20000 40000 60000
lime / 3
le + 001
Figure 2.10
FeNbO^ fired twice at 1200 °C, in Ar/02 mixture and 1000 ppm
Appendix 2.1
Exceptions to table 2.1.1
Milling:
series (a) - one preparation o f Ba^Fej ^Nbg 4O3 0 - milled for 17.5 hours, a second
preparation o f Ba^Fej ^Nbg 4O3 0 and one preparation o f Ba^FeNbg0 3 Q - milled for 7
hrs
series (b) - FeN b0 4 (9 hrs), CrQ^Feg 4Nb0 4 (12 hrs)
Pressing:
series (a) - one preparation o f Ba^FeNbg0 3 Q - 3 tons (2.3 ton cm"^)
series (b) - Crg ^FeQ gNb0 4 and CrQ 2peo gNbÛ4 (5 tons (3.8 ton cm"^)), FeNb0 4 (3
tons (2.3 ton cm"^))
Firing:
series (a) - one preparation o f Ba^Fej 4Nbg 5O3 0 (fired 4 times at 1200 °C and once
at 1100 °C when the compound fused to the crucible), one preparation of Ba^Feo gNbç 2O3 0, fired 4 times at 1200 °C (for the same reason) and one preparation
of Ba^Feo gNbg 4O3 0 fired once at 1200 °C for 12 hrs and once at 1200 °C for 44 hrs
Ohms
range resolution accuracy (ly r) 18-
28 °C, (%rdg + counts)
max voltage across unknown on range
200 Q 10 mfi 0.05 -f 2* 0.2 V
2 kfi 100 mO 0.05 -f 1 2.0 V
20 kO 1 U 0.05 -h 2 0.2 V
200 kO 10 U 0.05 + 1 2.0 V
2 UQ** 100 U 0.05 + 2 0.2 V
20 MU** 1 kU 0.2 + 1 2.0 V
200 MU** 100 kU 2.0 -H 1 2.0 V
* when correctly zeroed ** appropriate range selected automatically
The monitoring o f car-exhaust emissions is a major environmental concern of today. The chief combustion products o f car engines are unburnt hydrocarbons, oxides o f nitrogen and carbon monoxide. The emissions o f these compounds are controlled by the use o f a catalytic converter mounted in the exhaust pipe. Long chain hydrocarbons from the petrol should be broken down during the catalyzed combustion process. H owever, the efficiency o f the catalyst must be monitored, as failure o f the catalyst will result in their emission, which in the past, has lead to smog (the result of photochemically induced oxidation o f unburnt hydrocarbons from automobile exhausts and the production o f ozone, details o f which may be found in appendix 3.1). Thus, for the monitoring o f hydrocarbons, it is necessary to have a material that is selective to these over CO and oxides o f nitrogen. It is envisaged that for such application, the operating temperatures would be high ( 400 - 500 °C).
Materials o f the tetragonal tungsten bronze structure have not, to date (with the exception o f two brief reports*^'^), been explored for gas sensor application. Barium iron niobate was chosen as a starting material for this series o f compounds because previous work*^ has shown that it exhibits an anomalous property: in the presence o f two oxidizing gases, it gave different responses (fig. 3.1). When chlorine was applied, a resistance increase was observed as expected, yet in NO2, a resistance decrease was
produced. In the same work, it was postulated that oxidizing/reducing power o f the applied gas can determine the nature o f the charge carriers in the oxide and thus, if NO2
is a stronger oxidant than chlorine, for chlorine the response would be that normally observed for an n-type oxide, but NO2 would be strong enough to cause the majority
'CO
2000
Cl
w 1000
0 100 200
Figure 3.1
e l a p s e d tim e /m in
R esistance response o f a pellet o f Ba^FeNbjOgo to reducing a n d oxidizing gases in a ir a t 500 °C , from W illiams and
Moseley*^