Ground Water Analyzation Using Query Optimization
And Spatio-Temporal Data Mining Technology
I. Shahina Begam, K.Tajudin
Abstract: The perspective of this paper to determines the data mining technology in spatio-temporal concept. Data mining is one of the main research areas to analyse data from the known set of data. The concept of ground water and rain water is very important to make growth of agricultural sectors. The association rule integration algorithm to implement using these two datasets. The ground water data is covered by country of India in the state of Tamilnadu. The query is to describe ground water level in maximum and minimum level in the pre monsoon and post monsoon in each year. The dataset used from the year of 1991 to 2016. The rainwater level compare with ground water in the year of 2011 to 2016.Using constraint checking to make different analyzation and comparisons report. The Predictions are used to give knowledge about the ground water level, rain fall details and maximum ground water level area.
Keywords: Association Rule, Maximum and Minumum, Pre and Post Monsoon, Relational calculus equation and Spatial Temporal Concept
————————————————————
1.
INTRODUCTIONData mining techniques were used to extraction of hidden predictive information from large databases. Spatial Temporal data mining manages data whose geometry changes over time. Applications that generate various type of data include surveillance applications, transportation systems, mobile communication systems, geographical and environmental systems so on. To classify spatial data as being either point data, line data or region data. In this paper utilisation spatial Temporal Technique to perform different analysation methodology using ground water and rain water dataset. In this paper utilisation spatial Temporal Technique to perform different analysation methodology using ground water and rain water dataset.
2.
RELATED WORKGroundwater, which is in aquifers below the surface of the Earth, is one of the Nation's most important natural resources. Here to discuss level of ground water post and pre monsoon level from 1991 to 2016.The data collection in the place Tamil nadu state 29 district ground water level except Chennai, Nilgiri and Cuddalore. The rain water data is used in this research from 2011 to 2015. Totally 756 entries were used in the database for ground water storage and 145 entries of rainfall details.
The ground water levels from the number of observation wells of TWAD have been analyzed for post-monsoon and pre-monsoon since 1991, average ground water level in m below ground level for pre and post monsoon.
http://www.twadboard.gov.in/twad/. The fields are used id, year, post and pre monsoon details.
Equations:
Where selection attributes R11, R12, R21
and R22 are relational calculus results output of query
optimization technique to implement post and pre_monsoon maximum and minimum groundwater level.
Where G(id) defines grouping of id i.e the location and count number of years occur for the maximum pre or post monsoon ground water level.
Where Y = 1 to n defines start from year 1991 to 2016. The above eq(5) to grouping of id from the result set R11
output and also find percentage calculation using this result similarly to create all other grouping pattern using R12, R21 and
R22. _______________________________
Dr.I.Shahina Begam.,Assistant Professor,Head, Department of
Computer Science,Ratankanwar Bhawarlal Gothi Jain College for
Women,Redhill,Chennai-2, TamilNadu, India,
Dr.K.Tajudin.,Assistant Professor,Department of Computer
Science,The New College,Royapettah, Chennai-14,Tamil
1086
Association rule:
Using association techniques to intersect and union of above result set.
Where X1 – the intersection result of maximum ground water
level in pre and post monsoon. X2 - the intersection result of
minimum ground water level in pre and post monsoon. The final result F is used to union of all previous result set and rainfall details(RF).
To perform association rule Algorithm-1:
Step 1: Using Database to fetch ground water data.
Step 2: To find Maximum Ground water level for all the years. -To find post_monsoon Maximum Level
-To find pre_monsoon maximum level Using eq(1) and eq(2)
Step 3: To find Minimum Ground water level for all the years. -To find post_monsoon maximum level.
-To find pre_monsoon minimum level. Using eq(3) and eq(4)
Step 4: Calculate percentage of appearance of each location from the overall years in group by command i.e 26 years. Using eq(5),eq(6),eq(7) and eq(8).
Step 5: Using association rule intersect and union to find final result. The eq(9) to produce final result of the summary.
3.
RESEARCHANALYSISA. Maximum Ground_Water Level in Post_Monsoon
Here to consider maximum ground water level and its percentage calculation based on the number of years occur each location.
select YEAR(g.year) as YEAR,id as ID,post as POST_MONSOON from GWater_detail as g where post=(select max(post) from GWater_detail where YEAR(year)=YEAR(g.year) and post<>999) order by year. Table 1 describes the highest ground water level in post_monsoon. To display the location id, year and post_monsoon ground water level details.
Table 1. Maximum GW Post_Monsoon year id Post_Monsoon
1992 2 22 1993 2 14.6 1994 2 16.1 1995 2 12.4 1996 2 18.5 1997 8 12 1998 17 10.8 1999 12 12.4 2000 2 12.1 2001 2 14.4 2002 2 16.6 2003 17 32.4 2004 17 26.5 2005 25 22.2 2006 25 7.2 2007 2 12.7 2008 9 15.4 2009 2 13 2010 3 14 2011 9 16 2012 2 9.9 2013 2 14.3 2014 1 21.2 2015 1 23.6 2016 1 23.1
Based on above query the output comes from maximum ground water level in post_monsoon in the area and number of Years.
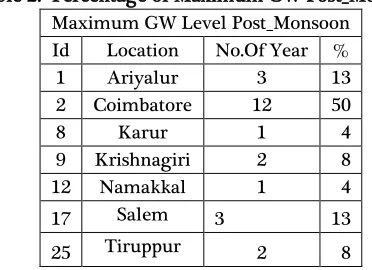
Table 2. Percentage of Maximum GW Post_Monsoon Maximum GW Level Post_Monsoon
Id Location No.Of Year % 1 Ariyalur 3 13 2 Coimbatore 12 50 8 Karur 1 4 9 Krishnagiri 2 8 12 Namakkal 1 4 17 Salem 3 13 25 Tiruppur 2 8
The Fig. 1 shows pie chart for table 2 data. The ground water highest level is Coimbatore district compare than other places. The next level is Ariyalur and Salem district.
Fig. 1 Percentage of Maximum GW Level in Post_Monsoon B. Maximum Ground_Water Level in Pre_Monsoon
Select YEAR(g.year) as YEAR,id as ID,pre as PRE_MONSOON from GWater_detail as g where pre=(select max(pre) from GWater_detail where YEAR(year) =YEAR(g.year) and pre<>999) order by year
Table 3 describes the highest ground water level in pre_monsoon. To display the location, year and pre_monsoon ground water level details.
Table 3. Maximum GW Pre_Monsoon Maximum GW Level Pre_Monsoon
year id Pre_Monsoon 1991 25 23.4 1992 2 26.6 1993 25 20.7 1994 2 16.2 1995 17 14.6 1996 12 36.6 1997 25 16 1998 25 16.2 1999 12 14 2000 2 13.5 2001 2 16.3 2002 17 30 2003 17 35.6 2004 2 32.2 2005 27 22.1 2006 2 12.7
2007 2 15 2007 9 15 2008 9 14.7 2009 2 16.1 2010 15 20.1 2011 1 19 2012 15 22.1 2013 15 25.4 2014 9 29.8 2015 1 26.6 2016 1 28.7
Table 4. Percentage of Maximum GW Pre_Monsoon Maximum GW Pre_Monsoon
Id Location No.Of Years % 1 Ariyalur 3 11 2 Coimbatore 8 30 9 Krishnagiri 3 11 12 Namakkal 2 7 15 Pudukottai 3 11 17 Salem 3 11 25 Tiruppur 4 15 27 Vellore 1 4
1088
The next level is Trippur and equal level of ground water level is Ariyalur, Krishnagiri, Pudukottai andSalem district. C. Minimum Ground_Water Level in Post_Monsoon
select YEAR(g.year) as YEAR,id as ID,post as POST_MONSOON from GWater_detail as g where post=(select min(post) from GWater_detail where YEAR(year)=YEAR(g.year) and post<>999) order by year Table 5 describes the minimum ground water level in post_monsoon. To display the location id, year and post_monsoon ground water level details.
Table 5. Minimum GW Post_Monsoon
Minimum GW Post_Monsoon year id Post_Monsoon
1992 11 2.2 1993 11 1.9 1994 11 1.2 1995 11 1.5 1996 11 2 1997 14 1.1 1998 11 1.1 1999 11 1.2 2000 11 1 2001 11 1.2 2002 11 0.9 2003 11 3.1 2004 11 2.3 2005 11 2.5 2006 26 1.1 2007 14 2 2007 11 2 2008 26 1.8 2008 28 1.8 2009 11 1.1 2010 28 1 2011 28 1.2
2012 28 1.1 2013 28 2.5 2014 11 4.2 2015 11 4 2016 23 2.7
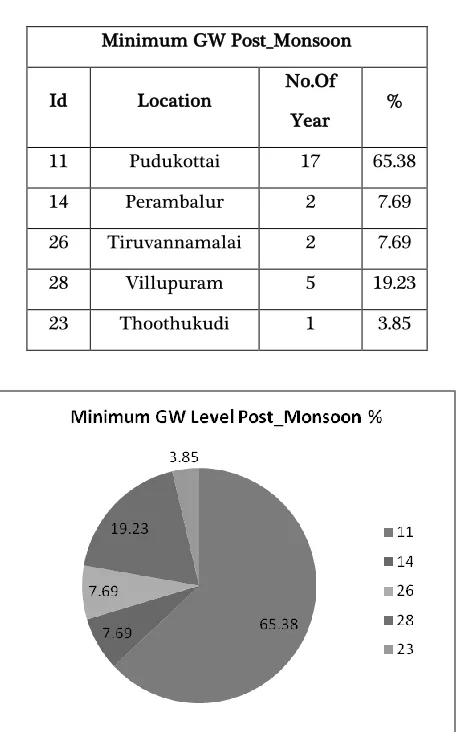
Table 6. Percentage of Minimum GW Post_Monsoon Minimum GW Post_Monsoon
Id Location No.Of Year % 11 Pudukottai 17 65.38 14 Perambalur 2 7.69 26 Tiruvannamalai 2 7.69 28 Villupuram 5 19.23 23 Thoothukudi 1 3.85
Fig. 3 Percentage of Minimum GW Level in Post_Monsoon The Fig.3 shows lower level ground water measurement area. The highest number of year is pudukottai district compare than other places. The next level is Villupuram and equal level of ground water level is Perambalur and Tiruvannamalai. Thoothukudi district is only once out of whole year comparison.
D. Minimum Ground_Water Level in Pre_Monsoon
Table 7. Minimum GW Pre_Monsoon Minimum GW Pre_Monsoon year id Pre_Monsoon
1991 11 5 1992 11 3.6 1993 11 4.3 1993 21 4.3 1994 11 3.3 1995 11 3.6 1996 11 4.1 1997 11 3.5 1998 11 2.1 1999 11 2.2 2000 11 2.1 2001 11 2.7 2002 11 2.4 2003 11 4.8 2004 11 3.3 2005 11 4.2 2006 11 4.1 2007 11 3.8 2008 29 3.8 2008 4 3.8 2009 11 2.1 2010 24 4.6 2011 14 4.8 2012 10 4 2013 11 6 2014 11 6.5 2015 7 5.1 2016 24 3.7 Table 8. Percentage of Minimum GW Pre_Monsoon
Minimum GW Pre_Monsoon Id Location No.Of Year % 11 Pudukkottai 20 76.92 21 Thiruvarur 1 3.85 29 Virudhunagar 1 3.85 4 Dindugal 1 3.85 24 Thirunelveli 2 7.69 14 Perambalur 1 3.85 10 Madurai 1 3.85 7 Kanniyakumari 1 3.85
Fig. 4 Percentage of Minimum GW Level in Post_Monsoon The Fig. 4 shows lower level ground water measurement area. The highest number of year is pudukottai district compare than other places. The next level is Thirunelveli and remaining all other places are only one year in that comparison summary.
E. Association Rule Integrity Mining Technique:
Using association rule intersect and union technique to implement the maximum and minimum ground water level. The eq(5) and eq(6) to intersect find the common value. The result to utilize eq(7) output.
Select distinct id from GWater_detail as g where pre=(select max(pre) from GWater_detail where
YEAR(year)=YEAR(g.year) and pre<>999) intersect select distinct id from GWater_detail as g where post=(select max(post) from GWater_detail where
YEAR(year)=YEAR(g.year) and post<>999);
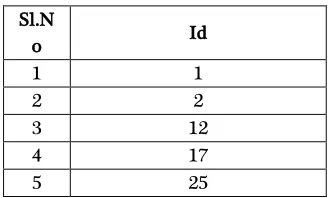
Table 9. Intersect output of Maximum GW Post_Monsoon and Pre_Monsoon
Sl.N
o Id
1 1
2 2
3 12 4 17 5 25
1090
Fig. 5 Ariyalur [id=1] District Pre and Post_Monsoon Ground Water Level [1991_2016]
Fig. 6 Coimbatore[id=2] District Pre and Post_Monsoon Ground Water Level [1991_2016]
Fig. 7 Namakkal [id=12] District Pre and Post_Monsoon Ground Water Level [1991_2016]
Fig. 8 Salem[id=17] District Pre and Post_Monsoon Ground Water Level [1991_2016]
Fig. 9 Tiruppur[id=25] District Pre and Post_Monsoon Ground Water Level [1991_2016]
Select distinct id from GWater_detail as g where pre=(select min(pre) from GWater_detail where
YEAR(year)=YEAR(g.year) and pre<>999) intersect select distinct id from GWater_detail as g where post=(select min(post) from GWater_detail where
YEAR(year)=YEAR(g.year) and post<>999);
Table 10. Intersect output of Minimum GW Post_Monsoon and Pre_Monsoon
Sl.No Id
1 11
Fig. 10 Pudukottai[id=11] District Pre and Post_Monsoon Ground Water Level [1991_2016]
Fig. 11 Perambalur[id=14] District Pre and Post_Monsoon Ground Water Level [1991_2016]
Table 11. Average Difference between Post and Pre Monsoon from 1991 to 2016 Location Selection of table 9 and table 10.
id Post Pre Difference 2 14.16 18.04 3.88 17 10.66 14.12 3.46 25 11.18 15.33 4.15 1 10.4 15.51 5.11 12 8.95 12.49 3.54 11 2.29 4.28 1.99 14 4.73 8.13 3.4
The Fig 13 shows details about average ground water level in the past 26 year summary report. The Coimbatore district GW depth level is higher than others but the GW level increases for pre monsoon level to post monsoon level. It also approximately 3.88m increases. The Ariyalur district GW level
increases 5.11m.The Pudukottai district GW depth level minimum compare than other places.
Fig. 12 Average Difference between GW Level Pre and Post_Monsoon [1991_2016]
Rainfall Detail Using Integrity Technique:
Using the integrate technique combine both ground water and rainfall details from 2011 to 2015 data. The integration apply only for the eq(9) that is intersect result of X1 and X2 with
rainfall data RF.
Table 12. Integration Result of Rain and GW Level [2011 to 2015]
id
rainfall (mm)
Rain fall (in m)
Post (m)
1092
Fig. 13 Integration Result of Rain and GW Level [2011 to 2015] chart
The above Fig.13 and Table 12 describe the details of integration of average rainfall and GW level from 2011 to 2015 for different location based on intersect and union result output. The highest rainfall is 1.269m the location of pudukottai but the GW level increases minimum compare than other areas. The location of ariyalur district GW increases more than other places 8.280m.
4.
CONCLUSION
Ground and rain water using spatio Temporal Datamining Technology covers Overall 754 data with 29 different location in 26 years to filter 7 location using different analysation pattern. The final conclusion of this research GW level is very depth in the area of Coimbatore district for 26 years comparison result but past five years result report Ariyalur district is highest. The pudukottai district GW level depth is very less compare than other area. Using integration technique of rainfall with GW level highest rainfall is pudukottai district but water level increase minimum only that is 2.3m. The Perambalur district GW increase 3.320m but the rainfall is 0.794m. In future result to analyse the difficulty of GW level with different prediction.
REFERENCES
[1]. Durga Karthik and K.Vijayarekha “multivariate data mining techniques for assessing water potability”, Vol. 7 | No.3 |256 – 259 | July – September | 2014 ISSN: 0974-1496 | e-ISSN: 0976-0083 | CODEN: RJCABP .
[2]. Faisal Aburub, Wael Hadi, “Predicting Groundwater Areas Using Data Mining Techniques: Groundwater in Jordan as Case Study”, World Academy of Science, Engineering and Technology, International Journal of
Computer, Electrical, Automation, Control and Information Engineering Vol:10, No:9, 2016.
[3]. Himanshu Trivedi, Dr. Amit Dutta, “Parametric Analysis of Water Resource Data (E-Governance Projects) Using Data Mining Techniques”, International Journal of Advanced Trends in Computer Science and Engineering, Vol. 3 , No.2, Pages : 04 - 07 (2014) Special Issue of ICACE 2014 - Held on March 10, 2014 in Hotel Sandesh The Prince, Mysore, India.
[4]. Jalna (Maharashtra-India)”, Int. Journal Of Engineering Research And Applications www.ijera.com Issn : 2248-9622, Vol. 5, Issue 2, ( Part -5) February 2015, Pp.20-29.
[5]. Kamakshaiah.Kolli and R. Seshadri, “ Ground Water Quality Assessment using Data Mining Techniques”, International Journal of Computer Applications (0975 – 8887) Volume 76– No.15, August 2013.
[6]. L.Yeshodha et al., “ Comparative Analysis for Estimation of Groundwater Potential A-Case Study for Hosur Block, Krishnagiri District , Tamil Nadu”, international journal of innovative research in technology&science | volume 1, number5.
[7]. Nallan, S. , & Armstrong, L. “ Assessment of Climate Change Effect on Water Harvesting Structures in Rainfed Regions: Geospatial Data Mining Approach” Proceedings of The Third National Conference on Agro-Informatics and Precision Agriculture 2012. (pp. 201-204). Hyderabad, India. Allied Publishers PVT LTD.
[8]. M Waseem Ashfaque et al., “ Robust Strategies of GIS and Geospatial Data mining techniques for drinking ground water quality management, challenges and issues of Drought Case study
[9]. Oliver López-Corona “Data Mining of Historic Hydrogeological and Socioeconomic Data Bases of the Toluca Valley, Mexico”, Journal of Water Resource and Protection, 2016, 8, 522-533 Published Online April 2016
in SciRes.
http://www.scirp.org/journal/jwarp,http://dx.doi.org/10.423 6/jwarp.2016.84044.
[10].Pratap Singh Solanki and R. S. Thakur , “ A Review of Literature on Water Resource Management Using Data Mining Techniques”, International Journal of Science and Research (IJSR) ISSN (Online): 2319-7064 Index Copernicus Value (2013): 6.14 | Impact Factor (2015): 6.391.
[11].Rosaida Rosly et al., “ The Study on the Accuracy of Classifiers for Water Quality Application”, International Journal of u- and e- Service, Science and Technology Vol.8, No.3 (2015), pp.145-154

![Fig. 6 Coimbatore[id=2] District Pre and Post_Monsoon Ground Water Level [1991_2016]](https://thumb-us.123doks.com/thumbv2/123dok_us/8630839.1420547/6.612.51.281.498.636/fig-coimbatore-district-post-monsoon-ground-water-level.webp)
![Fig. 10 Pudukottai[id=11] District Pre and Post_Monsoon Ground Water Level [1991_2016]](https://thumb-us.123doks.com/thumbv2/123dok_us/8630839.1420547/7.612.60.272.540.668/fig-pudukottai-district-post-monsoon-ground-water-level.webp)
![Fig. 13 Integration Result of Rain and GW Level [2011 to 2015] chart](https://thumb-us.123doks.com/thumbv2/123dok_us/8630839.1420547/8.612.48.283.60.244/fig-integration-result-rain-gw-level-chart.webp)
