United Kingdom ISSN 2348 0386 Vol. VII, Issue 5, May 2019
Licensed under Creative Common Page 640
http://ijecm.co.uk/
TECHNOLOGY CAPABILITY FOR ACHIEVEMENT
OF COMPETITIVENESS AMONG SMALL AND
MEDIUM MICRO ENTERPRISES
Irene Jemutai Biwot
Student, Jomo Kenyatta University of Agriculture and Technology, Kenya
Geoffrey Kiptum Kimutai
Lecturer, Jomo Kenyatta University of Agriculture and Technology, Kenya
Abstract
The study was focused on technology capability for achievement of competitiveness among
small and medium enterprises. Explanatory research design was adopted and cluster sampling
technique was used to obtain a sample size of 335 respondents. The research utilized primary
data obtained through the use of questionnaires and analysis conducted using both descriptive
and inferential statistical methods to draw conclusions from the data. Technology capability was
found to have a positive and significant effect on competitiveness. Therefore technology
adopters and users should focus on the capabilities of the technology in terms of upgrading and
updating, flexibility, usability and ready accessibility in the market before adoption.
Keywords: Technology Capability, Competitiveness, Technology Acquisition Capacity,
Technology Operating Capacity, Technology Upgrading Capacity, SMEs
INTRODUCTION
SMEs operate within a volatile business environment where competitiveness determines
business survival. Rapid technological advancement that attract high operational costs, barriers
Licensed under Creative Common Page 641 the modern business environment where SMEs thrive posing a greater challenge to the growth
of the enterprises. SMEs operate in competitive markets for business development to offer
services and to maximize shareholder wealth.
When an organization performs better compared to their competitors in the same
industry, they have an edge in competitiveness. An organization attains competitiveness when it
acquires and develops a means or a group of resources that permits them to perform better
(Willems, Werelds, & Streukens, 2012). It is much evident that firms that have a higher level of
competitiveness innovate continually, basing on new technologies and accentuate on skills and
knowledge of their workers compared to resources such as plants and machinery.
Organizational level of aggressiveness consider a firm as a question of examination and
think about internal components of a firm, both tangible and intangible assets of firm like
innovation, ICT, marketing capacities, human asset, innovation abilities among others, as basic
sources for enhancing the organization level competitiveness (Latruffe, 2010; Laurentiu, 2009). Competence approach emphasizes on the competencies, which are an outcome of firm’s
internal resources such as technology, ICT on raising competencies for building, maintaining
and sustaining firm level competitiveness.
Innovation Diffusion Theory argues that potential client settle on choices to embrace or
reject an innovation in view of convictions that they frame about the innovation and their
capability to embrace the same. This paper is organized as follows; in the next section is the
literature review, methodology, results and the paper conclusions. Technology capability was
found to have an effect on competitiveness of SMES.
LITERATURE REVIEW
Technological capability (TC) is generally known as a key source of development and riches at
the national and the firm levels (Monopoloulos et al., 2009). It is the definitive factor in creating
focused positions, competitive qualities, and managed developments (Ngoc Ca, 1999). The firm
level TC has been viewed as a vital asset, empowering firms to accomplish competitiveness
inside their industry. Those organizations with prevalent TC can secure more prominent
productivity by spearheading process innovations and can accomplish higher differentiation
(Tsai, 2004). Guifu and Hongfu (2009) have characterized firm-level TC into three particular
levels: TAC, technological acquiring capacity which attributes to abilities to secure new
information through formal, casual, internal and external channels, TOC technological operating
capacity that alludes to capacities to work, utilize and maintain generation types of equipment
and facilities. Going with the advancement, firms abbreviate the gaps with other driving
Licensed under Creative Common Page 642 advancement, and TUC technological upgrading capacity that concerns capacities which
enhance significantly on products and procedures relying upon firm's own quality and on
changing business sector needs. The upgrading results will enable the organizations to achieve
higher TC level. Technological capability is a particular group of equipment, aptitudes,
information, and states of mind that present the capacity of a firm to work, comprehend, change
and make production procedures and product (Marcelle, 2004).
The headway in the level of specialized know-how and broad utilization of mechanical
advancements bringing about high gainful ability and financial development isn't new in
developed countries. For developing nations, fortifying such technological capacity and
innovations are their interests (Adeoti & Adeoti, 2010). This is on the grounds that gaining
advanced information and technologies have no value if the acquiring country doesn't have the
important technological abilities that can enable them to seize such innovative opportunities
(Morrisson, Pietrobelli, & Rabellotti, 2008; Hong, 2009).
Adeoti (2002) noted that building local technological ability in this manner is a
fundamental condition for any country trying to grow technologically. (Monopoloulos, Dimitratos,
Young & Lioukas, 2009) stated that TC is broadly viewed as a source of development and
riches for the countries and the organizations. Two principle issues have been underlined in
investigations into the function of technology on economic advancement. They focused on the
developing business sector nations and adjusting the foreign made technologies that have
turned into a definitive factor in their capacity to get up to speed and the business and nation
phenomena, where the firm-level phenomena have very little emphasis (Caniels & Romijn,
2003; Archibugi & Coco, 2004).
Further, investigations on the link between TC of developing nations SMEs and their
performance are needed to produce a better understanding (Figueiredo, 2002; Guifu & Hongjia,
2009). In the research we decomposed Technology capability into TAC, TAC and TUC.
Ho: Technology capability has no significant effect on competitiveness
METHODOLOGY
The study adopted an explanatory research design and was carried out in Uasi Gishu County in
Kenya, which is a good representation of an emerging market in a developing nation where
businesses survive within a highly competitive environment. Cluster sampling technique was
used to obtain a sample of 335 SME owners or managers. Primary data was collected through
the use of structured questionnaires. Reliability was test using Cronbach alpha coefficient while
correlation and regression analysis was also conducted to establish the association and to test
Licensed under Creative Common Page 643 The overall regression equation is outlined as below:
𝒚 = 𝜶+ β1𝒙𝟏 + ε`
Where: 𝒚 Represents Competitiveness among Small and Medium Enterprises
𝜶 Represents the value of y when other factors are held constant or when x1 =0
β1 Represents the level to which SME competitiveness is influenced as Technology capability
varies by a unit.
𝒙𝟏 Represents Technology capability
ε Refers to the error of prediction that represents all other factors which influence the dependent
variable other than the independent variable in the study
RESULTS
Descriptive statistics sought to establish the views of the respondents regarding the technology
capability. This enabled the rating of the views on a five-point likert scale so as to determine the
level of SME competitiveness given their level of technology capability.
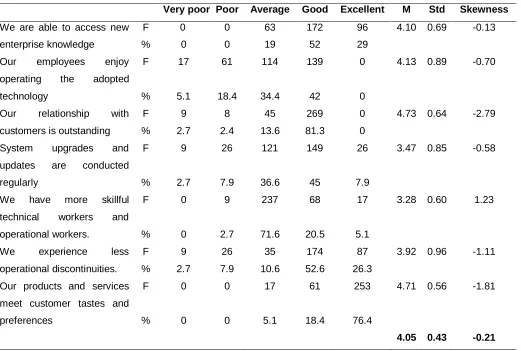
Table 1. Technology Capability
Very poor Poor Average Good Excellent M Std Skewness
We are able to access new enterprise knowledge
F 0 0 63 172 96 4.10 0.69 -0.13
% 0 0 19 52 29
Our employees enjoy operating the adopted technology
F 17 61 114 139 0 4.13 0.89 -0.70
% 5.1 18.4 34.4 42 0
Our relationship with customers is outstanding
F 9 8 45 269 0 4.73 0.64 -2.79
% 2.7 2.4 13.6 81.3 0
System upgrades and updates are conducted regularly
F 9 26 121 149 26 3.47 0.85 -0.58
% 2.7 7.9 36.6 45 7.9
We have more skillful technical workers and operational workers.
F 0 9 237 68 17 3.28 0.60 1.23
% 0 2.7 71.6 20.5 5.1
We experience less operational discontinuities.
F 9 26 35 174 87 3.92 0.96 -1.11
% 2.7 7.9 10.6 52.6 26.3 Our products and services
meet customer tastes and preferences
F 0 0 17 61 253 4.71 0.56 -1.81
% 0 0 5.1 18.4 76.4
Licensed under Creative Common Page 644 The findings in Table 1 show that 52% and 29% of the owners/managers of SMEs agreed and
strongly agreed respectively that they are able to access new enterprise knowledge while 19%
held a neutral view thus giving a mean response of (mean =4.10, sd = 0.69) that showed
agreement by majority of the respondents. Furthermore, while 42% of the owners/ managers
agreed that their employees enjoy operating the adopted technology, 34.4% held a neutral view
while 5.1% and 18.4% strongly disagreed and disagreed respectively thus giving a mean
response of (m= 4.13, sd = 0.89) that showed agreement by the majority. In addition, the
findings show that 81.3% of the owners/ managers of SMEs agreed that their relationship with
customers is outstanding while 13.6%, 2.4% and 2.7% held a neutral view, disagreed and
strongly disagreed respectively thus giving a mean response of (m=4.73 , sd = 0.64) that
showed strongly agreement by majority.
The findings also show that while 45% and 7.9% of the owners/ managers of SMEs
agreed and strongly agreed respectively that system upgrades and updates are conducted
regularly, 36.6%, 7.9% and 2.7% held a neutral view, disagreed and strongly disagreed
respectively resulting in a mean response of (m=3.47, sd = -0.85) that showed neutrality by
majority. In addition, while 20.5% and 5.1% of the owners/ managers agreed and strongly
agreed respectively that they have more skillful technical workers and operational workers,
71.6% and 2.7% held a neutral view and disagreed respectively thus giving a mean response
of (m=3.28, sd = 0.60) showing neutrality by majority of the respondents. Findings further
revealed that 52.6% and 26.3% agreed and strongly agreed respectively that they experience
less operational discontinuities while 10.6%, 7.9% and 2.7% held a neutral view, disagreed and
strongly disagreed respectively. This resulted in a mean response of (m=3.9, sd = 0.96)
showing agreement by majority of the respondents.
Finally, 18.4% and 76.4% of the owners/ managers agreed and strongly agreed
respectively that their products and services meet customer tastes and preferences while 5.1%
held a neutral view thus giving a mean response of (m=4.71, sd = 0.56) showing strongly
agreement by majority of the respondents. The overall mean response for the level of
technology capability by majority of the owners/ managers was (m=4.05, sd = 0.43) that showed
overall agreement.
The results are consistent with those of Korir, Bonuke and Chepkwony (2017) whose
output also shows that technology capability is positively related with firm performance, with a
coefficient of r = 0.596 which is also significant at p< 0.01. similarly Archibugi, and Coco (2004)
who concluded that technological capabilities are a fundamental component for achieving
Licensed under Creative Common Page 645
Correlation Results
A correlation analysis of Technology Capability and Competitiveness was carried out and the
findings shows that there is a positive and significant relationship between technology capability
and competitiveness, R = .611. This is an indication that there is a 61.1% chance that the level
of competitiveness in the SMEs will increase with increase technology capability.
Table 2 Correlation Results
Competitiveness Technology capability
Competitiveness
Technology Capability
1 .611
1
Regression Results
We also sought to test the hypothesis stating that technology capability has no significant effect
on competitiveness among SMEs by conducting a regression analysis. The findings were
presented in Table 3, 4 and 5 below.
Table 3 Model Summary
R R Square Adjusted R Square Std. Error of the Estimate
.611a .373 .372 .36839
The coefficient of determination (R2) and correlation coefficient (R) shows the degree of association between technology capability and competitiveness in SMEs. The results of the
linear regression In Table 3 indicate that R2 =0. 373 and R = 0. 611. R value indicates that there is a strong linear relationship between technology capability and competitiveness in SMEs. The
R2 indicates that the explanatory power of the independent variables is 0.373 meaning 37.3% of the variation in competitiveness is explained by the regression model while 62.7 % is
unexplained by the model.
Adjusted R2 is a modified version of R2 that has been adjusted for the number of predictors in the model by less than chance, the adjusted R2 of 0.372 which is slightly lower than the R2 value is an exact indicator of the relationship between the independent and the dependent variable because it is sensitive to the addition of irrelevant variables. The adjusted
Licensed under Creative Common Page 646 Table 4 Goodness of Fit
Model Sum of
Squares
Df Mean Square F Sig.
1 Regression 26.609 1 26.609 196.07 .000b
Residual 44.649 329 .136
Total 71.257 330
a. Dependent Variable: competitiveness b. Predictors: (Constant), technology capability
From Table 4 above The F test provides an overall test of significance of the fitted regression
model. The F value indicates that the overall regression model is significant. The F-statistics (F
= 196.070) was significant at 0.05 significance level thus confirming the fitness of the model.
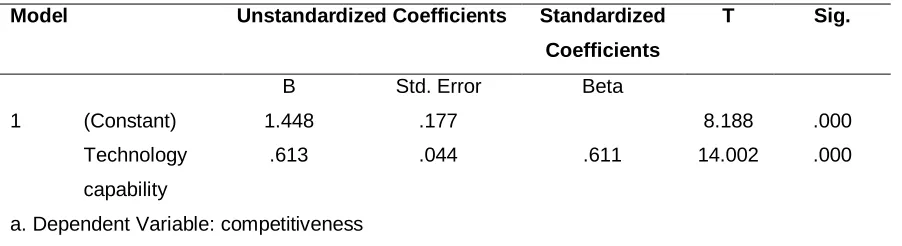
Table 5 Coefficients
The Table 5 indicates there is a positive linear relationship between Technology capability and
competitiveness which reveals that an increase in Technology capability increases
competitiveness. Capability proved significant with p=0.000 thus the null hypothesis is rejected
implying that Technology capability has an influence on competitiveness.
CONCLUSION
The study findings indicate that technology capability significantly affects SME competitiveness.
These findings imply that technology capability i.e. Technology Acquiring capability, Technology
Operating capability and Technology Upgrading Capabilities should be put into consideration
before adopting any technology in a business enterprise so as to thrive in a polarized market.
However, despite these findings, while majority of the SMEs were performing well in all other
aspects relating to technology capability, there were gaps in terms of having system upgrades
Model Unstandardized Coefficients Standardized
Coefficients
T Sig.
B Std. Error Beta
1 (Constant) 1.448 .177 8.188 .000
Technology capability
.613 .044 .611 14.002 .000
Licensed under Creative Common Page 647 and updates being carried out regularly and lack of skillful technical workers and operational
workers so that SMEs outsourced the skills.
While our study focused on the internal environment, there are other factors that are
external such as customer preference, economic-based factors such as inflation and
government policies on business that are critical for many SMEs to stay afloat. So, getting a
deeper understanding of how dynamic such factors are in a different context is important in
establishing ways on how to develop sound policies and structures that can effectively cushion
the SMEs thus preventing closing down of some of them.
REFERENCES
Adeoti & John 2002. Technology and the Environment in Sub-Saharan Africa: Emerging Trends in the Nigerian Manufacturing Industry. Aldershot, United Kingdom: Ashgate Publishing Limited
Adeoti, A. I., & Adeoti, J. O. (2010). Technological capability, innovation capacity and agro-industry development in Nigeria: research paper I-special issue theme. African Journal of Science, Technology, Innovation and Development, 3(2), 80-100.
Archibugi, & Coco (2004) ‘A new indicator of technological capabilities for developed and developing countries (ArCo)’, World Development, 32, (4), 629-654.
Caniels & Romijn (2003). ‘SME cluster, acquisition of technological capability and development: Concept, practice and policy lessons’, Journal of Industry, Competition and trade, 3 (3), 187-210
Figueiredo, P. N. (2002). Learning processes features and technological capability-accumulation: explaining inter-firm differences. Technovation, 22(11), 685-698.
Guifu, G., & Hongjia, M. (2009, December). Technological capabilities and firm upgrading: An empirical study of high-tech firms. In 2009 International Conference on Information
Hong, (2009). Synergetic Mechanism between Firm's Technological Learning Mode and Technological Capability Evolution: A Case Study Proceedings of the 2009 IEEE IEEM, 1219-1223.
Korir, Bonuke &Chepkwony;(2017). Effect of supply chain operational capabilities and Firm performance in state corporations in Kenya
Latruffe, (2010). Competitiveness, Productivity and Efficiency in the Agriculture and Agri-Food Sectors, OECD Food, Agriculture and Fisheries paper, No 30. OECD. Rennes, France: OECD Publishing.DOI: 10.1787/5km91nkdt6d6-en Laurentiu, (2009). Evolutions in the World Competitiveness Classification - The Case of Romania. Young Economists Journal /Revista Tinerilor Economisti, 7(13), 75-80.
Marcelle, G. M. (2004). Technological learning: A strategic imperative for firms in the developing world. Edward Elgar Publishing.
Monopoloulos, Dimitratos, Young & Lioukas (2009). ‘Technology sourcing and performance of foreign subsidiaries in Greece: The impact of MNE and local environmental contexts’, Management International Review, 49(1) ,43-60 Morrison, A., Pietrobelli, C., & Rabellotti, R. (2008). Global value chains and technological capabilities: a framework to study learning and innovation in developing countries. Oxford development studies, 36(1), 39-58.
Ngoc, T. & Tran (1999) Technological Capability and Learning in Firms: Vietnamese Industries in Transition, Ashgate Publishing, Aldershot.
Tsai, (2004). ‘The impact of technological capability on firm performance in Taiwan’s electronics industry’, Journal of High Technology Management Research, 15, (2), 183-195