Characterization of particle deposition in a lung model using an individual
path
A. F. Tena1, P. Casan1, J. Fernández2a, C. Ferrera2, A. Marcos2
1Instituto Nacional de Silicosis. Dr Bellmunt s/n. 33006 Oviedo, Spain. 2Universidad de Extremadura. Avda de Elvas s/n, 06006 Badajoz, Spain.
Abstract. Suspended particles can cause a wide range of chronic respiratory illnesses such as asthma and chronic obstructive pulmonary diseases, as well as worsening heart conditions and other conditions. To know the particle depositions in realistic models of the human respiratory system is fundamental to prevent these diseases. The main objective of this work is to study the lung deposition of inhaled particles through a numerical model using UDF (User Defined Function) to impose the boundary conditions in the truncated airways. For each generation, this UDF puts the values of velocity profile of the flow path to symmetrical truncated outlet. The flow rates tested were 10, 30 and 60 ℓ/min, with a range of particles between 0.1 m and 20 m.
1 Introduction
One of main health problems to the urban population is the exposure to air pollution. Suspended particles (made up of soot, smoke, dust and liquid droplets) can cause a wide range of chronic respiratory illnesses such as asthma and chronic obstructive pulmonary diseases, as well as worsening heart conditions and other conditions. To know the particle depositions in realistic models of the human respiratory system is fundamental to prevent these diseases, and this is the objective of this work.
Following the model developed by Weibel [1], a 3D numerical model of the bronchial tree has been developed from the trachea to the sixteenth level bronchioles. It has been discretized with a mesh of about one million cells. The Navier-Stokes equations have been solved with a commercial CFD finite volume code (Ansys Fluent). Other authors [2 and 3] have developed similar models, also using an individual path. In order to obtain reasonable results from a truncated model, it is necessary to apply physiologically realistic boundary conditions at these truncated outlets.
This work is part of a broader, which tries to model the airflow in the lung with all their characteristics: unsteady flow, inhalation and exhalation of particles, common diseases (asthma, bronchitis, etc.). A first step was [4] the construction and simulation of a particular 7-level model, using a single way to study the unsteady flow that occurs during the execution of a spirometry test. A second step [5] was to study the lung deposition of inhaled particles through a numerical model. A third step,
the main objective of this work, is to study the lung deposition of inhaled particles through a numerical model by means of UDF (User Defined Function) to impose the boundary conditions in the truncated airways. For each generation, this UDF puts the values of the velocity profile of the flow path to symmetrical truncated outlet. The flow rates tested were 10, 30 and 60 ℓ/min, which are equivalent to the different respiratory rhythms. The particle size used ranged between 0.1 m and 20 m, being introduced by means of an injection type called surface, specifying particle properties and velocity.
2 Methodology
The numerical model of the nasal cavity and nasopharynx was obtained from a 30-year-old woman by means of CT images [6]. The throat reproduces the model written in [7]. The geometry follows the models developed by Weibel [1] and Kitoaka et al [8]. The 3D numerical model has been made with the commercial code Ansys Gambit© [9].
0.018 exp 0.388 if n 3 0.013 exp 0.2929 0.00624 if 3
d n
d n n n
(2)
0.12 exp 0.92 if 3 0.025 exp 0.17 if 3
l n n
l n n
(3)
Half lung is presented in Figure 1. The numerical simulation of this complete morphology is simply unavoidable because the lung until level 16 has 65536 branches (Table 1).
Fig 1. Complete morphology of the lung
Table 1. Main parameters of the branches
n branche diameter (mm) length (mm) branche (mm2) (mmtotal 2)
0 1 18.00 120.00 254.47 254 1 2 12.21 47.82 117.12 234
2 4 8.28 24.85 53.90 216
3 8 5.62 16.86 24.81 198
4 16 4.45 12.67 15.56 249 5 32 3.51 10.69 9.69 310
6 64 2.81 9.01 6.19 396
7 128 2.27 7.61 4.05 519
8 256 1.86 6.42 2.72 696
9 512 1.54 5.41 1.87 958
10 1024 1.30 4.57 1.32 1353
11 2048 1.10 3.85 0.96 1957
12 4096 0.95 3.25 0.71 2903
13 8192 0.83 2.74 0.54 4416
14 16384 0.73 2.31 0.42 6886 15 32768 0.65 1.95 0.34 11010 16 65536 0.59 1.65 0.28 18048
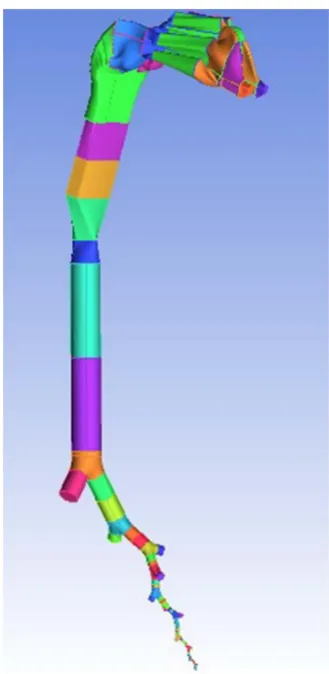
Figure 2 shows a global image of the model. The complete morphology of the lung can be generated from
this model by imposing symmetry at each of the branches.
Fig 2. Numerical model geometry
3
Numerical model
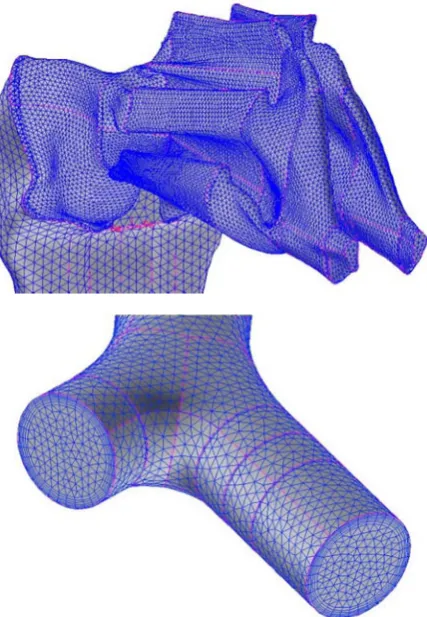
A boundary layer mesh was built before meshing the volumes in order to obtain a better description of the boundary layer in the numerical calculations. The lung was meshed with tetrahedral cells due to their better adaptation to complex geometries, reducing its size while descending from the high-order to the low-order generations. The size of the tetrahedrons was consistent with the size of the boundary layer cells. The volume of the cells ranges between 2.96x10⁻¹² and 2.01x10⁻¹⁰ m3.
The maximum equiangle skew was restricted to 0.6 for 97.60% of the cells in the mesh. Figure 3 shows a detail of the mesh generated.
The total number of cells used to begin the simulations was about 106, though other meshes of
different size (2x10⁶ and 4x10⁶) were generated in order
Fig 3. Detail of the mesh (nose and level 16th of the lung)
Fig 4. Results of the independence tests
The numerical simulations were performed with the code Ansys Fluent© [10]. This code was used to solve the full steady 3D Reynolds-averaged Navier-Stokes equations by the finite volume method. The fluid used in the calculations was air. The velocities will vary between 0.65 and 3.93 m/s at the trachea, so the Reynolds number is between 840 and 5050. The flow was considered as incompressible and turbulent. To effectively address both laminar and turbulent flow conditions, the model used for turbulent closure was the SST k-omega together with the transitional flows option to enable a low-Reynolds-number correction to the turbulent viscosity. This model provides a good approximation to transitional flows because the value of ω does not reach the zero value as
the laminar flow limit is approached. Furthermore, the turbulence is simulated all the way to the viscous sublayer, avoiding the use of standard wall functions, which are inaccurate for transitional flows. The pressure-velocity coupling was established by means of the SIMPLE algorithm. Second-order upwind discretizations were used for the convection terms and central difference discretizations were established for the diffusion terms. The y+ values at all wall boundaries were maintained on the order of approximately 2 or less. This model has already been tested in the first step of this broad work [4].
A specific volume flow rate at the nose and a constant gauge pressure at the lowest generation were imposed as the boundary conditions. An additional user-defined function was used to impose a symmetric operation of the two branches at each bronchus. A detailed description of this UDF (which is about 400 lines long) is beyond the scope of this article. This UDF obtains the velocity profile at each open branch from the calculations and prescribes the same profile in the corresponding truncated branch. This methodology is repeated iteratively until achieving convergence in the flow field. Convergence was accepted with criteria of 0.00001 residuals for continuity and each velocity component in the momentum equation. Convergence required about 1,100 iterations and approximately 15 min CPU time in a cluster with 8 cores.
model velocity Flow-rate m/s
Fig 5. Outlet boundary conditions (velocity and flowrate) Figure 5 shows a sample of this UDF. On the left there is a bifurcation in normal conditions, with uncut branches, showing the normal profile of the velocity field. On the middle is shown a bifurcation with the left branch truncated, using as boundary condition the velocity profile of the open branch and, on the right, the same but with the uniform flow-rate.
The particle trajectory equation can either be solved with the momentum and energy equations for the continuum flow (coupled) or after the momentum and energy equations have converged (uncoupled). The coupled option allows particles to interact with the flow fluid and affect the flow solution. In this case, the uncoupled option was chosen.
Once the static simulation finished, the Discrete Phase Model (DPM) was switched on to predict the trajectory 0.00%
0.50% 1.00% 1.50% 2.00% 2.50% 3.00% 3.50%
2 2.5 3 3.5 4 4.5 5
Outlet Flow rate
Average 1.11% 1E06 cells
of discrete phase particles. To study particle deposition, the Lagrangian approach was used; particle trajectories were calculated within the steady flow fields of interest as a post processing step. Forces on the particles of interest include drag, pressure gradient, gravity, lift, and Brownian motion. To model the effects of turbulent fluctuations on particle motion, a random walk method was employed. The tracking parameters used were 50,000 for the “maximum number steps” and 5 for the “step length factor”.
Particles were introduced by means of an injection type called surface, specifying particle properties and velocity. Robinson [11] founded that 50,000 particles are necessary to minimize random variation in the deposition efficiency predictions due to the randomness of the particle position profile.
Deposition was determined by summing up the “trapped” fate particles, which occurs when their centre of mass touches the wall. Fluent reported the number of incomplete, aborted, or unable to be tracked particles. These numbers could be minimized by adjusting various input parameters
4 Results
The flow rates tested were 10, 30, and 60 ℓ/min, which are equivalent to different respiratory rhythms. The seeding conditions of the particles were:
-Inert material density: 1,000 kg/m3.
-Particle size: 0.1 m, 0.5 m, 1 m, 2 m, 5 m, 10 m
and 20 m.
-Velocity: the same that air. -Density 0.5%.
-Number of injected particles: 50,058.
Fig 6. Relationship between particle size and lung deposition. Numerical results.
The regional deposition of particles can be quantified in terms of the deposition fraction (DF), defined as the mass ratio of deposited particles in a specific region to the particles entering the lung. Here (figure 6) is the ratio of the particles trapped in the first seven levels and entering the lung. These results agree with Dolovich [12] except in the range of particles between 0.1 and 2
microns, where numerical values are greater than those obtained experimentally.
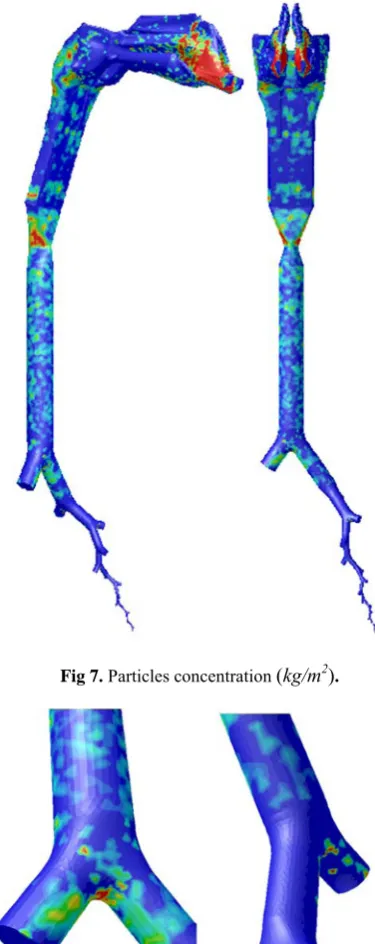
Figures 7 and 8 show the concentration of the particles (kg/m2) settled on the duct walls for a flow rate of 60 ℓ/min and for a size of 5 m. Red colour means high concentration of settled particles on the wall, and blue colour means absence of settled particles.
Fig 7. Particles concentration (kg/m2).
Fig 8. Particles concentration (kg/m2).
As can be seen, most of the particles is retained in the nose and in the junction of the larynx and trachea, where the epiglottis.
The rest of particles travel through the lung. It can be seen how the UDF placed on truncated branches allows the exit of the particles, working the lung as if he had all the branches. According to the designed UDF, it can be said that the particle satisfies the task assigned, allowing to simulate the lung by means of an individual path. 0%
20% 40% 60% 80% 100%
0 5 10 15 20
Deposition fraction
m 10 l/min
30l/min
5 Conclusions
This paper has explored a general methodology to simulate a model of a human lung. It has developed a complete and realistic model of the lower conductive zone of the lung (generations 0 to 16). Thais can be simulated within reasonable computational times. The operation of the ‘truncated’ airway is included in the simulations by means of a user-defined function. This function was used to: 1) obtain the velocity profile at each ‘active’ (open) branch, and 2) prescribe this profile in the truncated branch. This was useful to simulate the operation of the truncated branches at each bronchiole.
The distribution of particles in the lung airways depends of its size. Small particles are distributed more uniformly than bigger particles, which follow the mean flow. The main objective of this work, to study the particle deposition from the mouth to the level 16 using a mixture of particles of different sizes has been achieved. Due to the high number of branches (131,072), it is necessary to work with a single pathway, so the boundary conditions applied in the truncated branches are very important. It can be concluded that the numerical model presented in this paper and the user-defined function routine included to account for the operation of the truncated branches can be satisfactory used to simulate the real operation of a human lung over the entire breathing cycle. This model provided a realistic description of the operation of the lung while avoiding too large computational costs.
Our future efforts will focus in the simulation of several pulmonary diseases (bronchitis, emphysema, etc.).
Acknowledgements
The authors gratefully acknowledge the financial support provided by Gobierno de Extremadura and FEDER under project GR10047 and also by Ministerio de Economía y Competitividad under project DPI 2010-21103-C04-04
References
1. E R Weibel, Morphometry of the human lung, Springer-Verlag (1963)
2. G Tian, P W Longest, G Su and M Hindle. Characterization of Respiratory Drug Delivery with Enhanced Condensational Growth using an Individual Path Model of the Entire Tracheobronchial Airways, Annals of Biomedical Engineering, 2011, Volume 39, Number 3, Pages 1136-1153.
3. D K Walters and W H. Luke. A Method for Three-Dimensional Navier--Stokes Simulations of Large-Scale Regions of the Human Lung Airway, J. Fluids Eng. 132, 051101 (2010).
4. A F Tena, P Casan, A Marcos, R Barrio, E Blanco. Analisys of the fluid dynamic characteristics of the obstructive pulmonary diseases using a three-dimensional CFD model of the upper conductive
zone of the lung airways. Proceedings of the SIMBIO 2011, Brussels, (Belgique), 2011.
5. A F Tena, P Casan, J Fernáz, A Marcos, R Barrio. Numerical simulation of the nano particle deposition using a three-dimensional model of lung airways. Conference on Modelling Fluid Flow (CMFF’12), Budapest, Hungary, 2012.
6. P Castro-Ruiz F. Castro-Ruiz, A. Costas-López, C. Cenjor-Español. Computational fluid dynamics simulations of the airflow in the human nasal cavity. Acta Otorrinolaringol Esp 2005; 56: 403-410. 7. M Brouns, S T. Jayaraju1, C Lacor, J De Mey, M
Noppen, W Vincken, and S Verbanck. Tracheal stenosis: a flow dynamics study. Journal of Applied Physiology March 2007 vol. 102 no. 3 1178-1184. 8. H Kitaoka H, R Takaki, B Suki. A three-dimensional
model of the human tree. J. Applied Physiology. 1999; 87: 2207-2217.
9. Gambit version 2.4.6, 2006. ©ANSYS Inc. 10. Fluent version 6.3.26, 2006. ©ANSYS Inc.
11. Robinson, R. J., Oldham, M. J., Clinkenbeard, R. E., and Rai, P. 2006. Experimental and nu-merical analysis of a 7 generation human rep-lica tracheobronchial model. Ann. Biomed. Eng. 34(3):373–383.