Licensed under Creative Common Page 202 http://ijecm.co.uk/
THE EFFECT OF BANK SIZE ON PROFITABILITY OF
COMMERCIAL BANKS IN KENYA
Teimet, Rotich
Department of finance and accounting,
University of Nairobi, Kenya
pteimet@yahoo.com
Lishenga, Josephat
Department of finance and accounting,
University of Nairobi, Kenya
Iraya, Mwangi
Department of finance and accounting,
University of Nairobi, Kenya
Duncan, Elly
Department of finance and accounting,
University of Nairobi, Kenya
Abstract
This paper examines the effect of banks size on the profitability of commercial banks and in
addition, evaluates the existence of equilibrium\disequilibrium relationship between the two
variables. The study analyzed a time series data sourced from across 42 commercial banks in
Kenya covering 2009 to 2018 period. The regulator’s weighted composite model for assessing
bank size was used, whilst the profitability attribute, return on assets was captured using
earnings before interest and tax over assets. Regressions analysis assessed the direction and
magnitude of the relationships while the autoregressive distributed lag model was used to
establish the equilibrium steadiness as well as the speed of adjustment to equilibrium. The
Licensed under Creative Common Page 203
the study established the existence of both long-run and short-run relation with adjustment
speed of 95 percent to equilibrium in a year. The study concluded that the size of a bank
plausibly relates with profitability and as such, banks consolidation and other expansion
strategies enhance bank profitability as evidenced by bidirectional causality between the
variables.
Keywords: Profitability, Return on Assets, Bank Size, Autoregressive distributed lag
INTRODUCTION
World over, the frequencies of the financial crisis over recent times has generated unsatisfied curiosity in the banking systems. This equally has heightened the policymakers’ tension as to
whether the size of a bank actually matters in relation to the profitability of banks. According to Almazari (2014), the capacity to sustain profits over time remain the first bank’s line of defense
as it absorbs unexpected losses, strengthens banks capital base and in addition, used to
improve future performance through re-investment of the retained earnings. In contrast, a
loss-making bank depletes its capital base and weakens financial performance, which in turn, puts
equity and debt holders at risk. The profitability indicator, return on assets (ROA) often show how profitable a firm compared with the peers. As such, the bank’s returns on assets remains a
focal point of interest, and has emerged as the best indicator that depicts the strength of an
entity to produce adequate results. It remains a key business concern of every leader, investor,
customer or owner (Terziovski & Samson, 2000).
Bank size, on the other hand, plays an important role in the prediction of profitability
when economies of scale are considered. For instance, a forward-looking commercial bank attempts to increase its size through consolidation —mergers and acquisitions— in order to gain
a competitive edge over the competition. A bank may leverage on average cost reduction per
unit while enhancing efficiency, capital base and market share. Babalola and Abiola (2013)
opined that a larger bank is more influential in the strategic decision and have more influence
upon its stakeholders, competitors, efficiency and in addition, more profitable relative to a small
bank. Bank size uniqueness in terms of assets, capital, deposits and loans influence the quality
of decisions on the activities undertaken by a bank, which in effect, affects the strength of
financial performance (Olowokure, Tanko & Nyor, 2015).
Banks play a critical role in any financial system, in fact, most countries, and as such are
highly supervised and regulated. The size becomes an analysis component bearing in mind that
Licensed under Creative Common Page 204 prefers financial supermarket models hubs, which moves together with trust indoctrination. The
trust whim for larger sized banks resonates well with the business stability risk, which potentially
has some ramification effect on the economy and societal welfare. Thus, microanalysis of
banks size in relation to the profitability of a bank becomes an attractive narrative that needs a
clear dichotomy and understanding. Bank size is the real monster that brings complexities and
threats to economies, especially when considered along with the interconnectedness and
international linkages. Together indeed, exacerbates the instability problem if such entities are
so big to fail (Buiter, 2009).
The largeness of a bank can be decomposed into; vertical on activities and products; or
horizontal on the supply of a product or service across several entities. Thus, a puzzled endless
debate on the optimal bank size, management complexity and exposures associated with
activities ranges. Larger banks engage more in market activities outside their traditional lending,
which of late, has escalated and grown significantly. This paradigm shift of activities in the
developed world has warranted restriction to reduce bank size exposure (Vinals et al., 2013).
Financial liberalization and deregulations, product innovations and technology have led to the
proliferation of financial supermarkets equivalent. Accordingly, larger banks tend to have lower
capital base, less-stable funding, engaging in more-market based activities as well as more
complex than the small banks. However, the failures associated with the larger banks tend to be
more disruptive to the financial system than failures of small banks (Laeven et al., 2014).
The recent regulatory framework in Kenya inevitably prompted commercial banks to shift
banking business model from revenue and profit growth to key ratios, size scale and
stakeholders returns. Perhaps this has ignited a wave of banking consolidation in the form of
merger and acquisition, which has gathered pace for the last five years. In this new
metamorphosis, the stable banks target smaller and weaker with a clear potential aim of
enhancing key financial ratios and perhaps penetrate new markets while expanding the range of
activities and muscle market power from the competition. This potentially has an effect of
reducing the numbers of banks, but stable, stronger as well as well-capitalized banks and by
extension, stable sector.
The consolidation model builds trust perceptions associated with larger banks of being stable and risk-free. Managers earn trust, which reduces depositors and other investors’ worst
fears over risk. Because of trust, stakeholders overlook setting of high fees, which ultimately not
seen as costs. In the end, higher fees charged on assets with high-expected returns, which
translate to higher profits. Therefore, it is of interest to know how such a paradigm shift in banks
expansive activities would affect the witnessed profitability challenges associated with the
Licensed under Creative Common Page 205 Kenya’s context is still a puzzle and intellectually appealing. Thus, the need to undertake this
study in order to demystify the mystery.
Research Objective
The objective of this study was to assess the relationships between bank size and profitability of
commercial banks in Kenya. Specifically, to:
a) Estimate the effect of bank size on returns on assets of commercial banks in Kenya.
b) Evaluate the existence of a long-run equilibrium relationship between bank size and returns
on assets of commercial banks in Kenya.
LITERATURE REVIEW
The theory underpinning this study is resource-based theory, which assumes that commercial
banks have one objective; maximizing wealth and by extension, profit maximizers. More than
often, banks use owned, controlled, available resources to offer and gain competitive advantage
through expansion into related business activities, which use similar resources. The theory puts more emphasis on the bank’s effectiveness in utilizing resources in order to yield higher
financial performance (Barney & Peteraf, 2003). The resource-based theory links merger and acquisition as a strategy of applying bank’s unemployed resources such as capital, skills,
technology, innovative products and services in profitable, but related activities, which use
similar resources.
These related banking activities include engagement in bancassurance, foreign
exchange trading, investments and other off-balance sheet activities. These expands the scale
and scope of commercial banks, both vertically and horizontally, with the ultimate goal of
improving financial performance (Wernerfelt, 1984). Due to the economies of scale, commercial
banks could be able to provide quality products/services at lower input cost using its
unemployed, owned and controlled resources, while charging higher prices (Barney& Peteraf,
2003). This exploitation of potential synergies expected from banks related activities, resources
and competencies can lead to a sustainable competitive advantage and therefore, a superior
profit. This theory seems more promising and intuitively appealing, yet undeveloped in the
context of bank and financial performance.
There are number of thoughts that support the theoretical fairytale about large banks
undertaking high-risk activities that generate higher returns such as in banks trading books,
bancassurance and somewhat short-term debts, which rather provide quick kill( (Mester, 2010;
Kristen & Sengupta 2016; Shleifer & Vishny, 2010; Gennaioli, Shleifer, & Vishny, 2013; Boot &
Licensed under Creative Common Page 206 suggesting that larger banks attract regulators bailout to avoid systemic catastrophe associated
with the size, complexity, and interconnectedness to other sectors of the economy (Farhi&
Tirole, 2012). Agency cost perspective become handy also as larger and complex banks
engage in multiple activities such as bundled lending and services, investment, trading and
off-balance sheet items which increase agency problems and weak governance structure, these
may outwit larger scale benefits (Bolton et al. 2007; Laeven &Levine, 2007).
Goddard et al. (2008) used panel data from US credit union covering 993 to 2004 to
evaluate the influence of bank size on performance. The research found that a positive
indirect exposure effect for large banks outweighed the negative direct exposure effects and
found evidence that the relationship between performance and bank size positively
correlates with performance through economies of scale and scope. Compared to small
banks, large banks tend to have a larger market share because of better bargaining power,
superior financing position, and more efficient cost control, thus, larger banks report higher
returns.
In an effort to investigate the size effect on financial performance in the EU banking
industry, Lepetit, Rous and Tarazi (2008) used a data set from 734 banks for the period
between 1996 and 2002. In consideration of banks size effect, they found a positive link with the
financial performance for smaller banks. However, they suggested that a larger share of trading
activities might not be associated with higher performance for smaller banks, but in some cases.
Muhindi and Ngaba (2018) used a panel data from 2012 to 2016 to assess the influence of bank
size on the financial performance of Kenyan banks using; the number of branches, capital base,
number of customer deposit, loans and advances as the key variables. The study found a
positive relationship between bank size and financial performance and revealed that larger
banks exhibit higher ROA relative to medium and small. However, an earlier study by Mulwa
and Kosgei (2016) found a negative relationship between bank size and financial performance,
which conflict.
In an endeavor to examine the influence of size on efficiency and performance, Bonin,
Hassan and Watchtel (2004) used a panel data from 225 banks, across eleven transitioning
countries from 1996 to 2000. The study also observes that efficiency declines with bank size.
Abel and Roux (2016) evaluated the relationships among efficiency, banksize and
performance of banks in Zimbabwe between 2009 and 2014. The study found that efficiency
relates positively to financial performance and economic stability. The study suggested that an
increase in economic activities increases the demand for financial services, which increases
Licensed under Creative Common Page 207
Conceptual Framework and Hypotheses
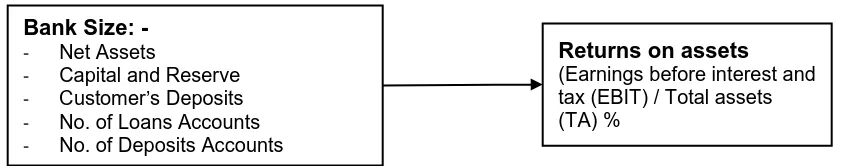
Based on the theoretical and literature review, the following conceptual model guided the study
as presented in Figure 1. The figure shows that the relationship could be influenced by the bank
size as shown by the arrow representation.
Figure 1: Conceptual model and hypotheses
Based on the research objectives the study developed following null-hypothesis
H01; bank size does not significantly affect returns on assets
H02; no long-run equilibrium relationship between bank size and returns on assets
METHODOLOGY
This study used secondary data extracted from annual published financial records for
commercial banks. It was a census study of all commercial banks in Kenya, covering
2009-2018-study period, and across forty-two banks, forming adequate four-hundred-twenty (420)
data points. The panel data study period was selected because of the stringent banking laws
and guidelines enacted including interest gapping, and the technologies adapt, which has changed the transitional channels significantly. The regulator’s weighted composite index was
used to capture bank size (BS), while returns on assets (ROA) was used as a financial performance attribute. The regulator’s size assessment model assigns equal weights of thirty
percent (33%) to each of the bank's net assets, capital and reserves, and market shares making
99 percent (99%), while the remaining one percent (1%) is distributed equally over the number
of deposit and loans accounts.
In banking, profitability can be measured through financial performance traditional
indicators; returns on assets (ROA), returns on equity (ROE), returns on capital employed
(ROCE) and interest margin (NIM). This study used ROA, an indicator that satisfies all
stakeholders of funds such as shareholders, debtors, creditors, debenture, bondholders etc.
This indicator is broader and useful compared to ROE, which measures returns only from the shareholders’ perspective. ROA was measured using earnings before interest and tax (EBIT)
over the average total assets. Banks have many assets by nature, making them highly
Bank Size: - - Net Assets
- Capital and Reserve
- Customer’s Deposits
- No. of Loans Accounts
- No. of Deposits Accounts
Returns on assets
Licensed under Creative Common Page 208 leveraged, which imply that their ROA generally are low. This ratio usually is affected directly by the sector’s endogenous and exogenous factors. The ratio shows how best a bank uses its
investment funds in generating returns (Almazari, 2014).
For model suitability assessment, the Hausman test was used with the null-hypothesis
that the random-effects model (REM) was appropriate while the alternative was the fixed-effects
model (FEM) was appropriate. The non-significance of the output is normally desired. The
results are as shown in table 1.
Table 1: Correlated Random Effects - Hausman Test
Test Summary Chi-Sq. Statistic Chi-Sq. d.f. Prob.
Cross-section random 5.89621 2 0.0657
Table 1 results provide evidence of insignificant chi-square (χ2
= 5.89621, DF = two, P =
0.0657). Based on the insignificance (P > .05) that the study fails to reject the null- hypothesis.
This implies that the study adopted REM in the prediction as in equation 1.
Yit= β0+ β1Xit + β2X2it+ β3X3it+ Ɛi+ Uit ……… (1)
Where : Yit = dependent variable of bank i at time t, i = observation, t = period, Xit = vector of
independent variables, β0 = constant term, β1, β2, β3, = coefficients of independent variables,
Ɛit = composite error term, Uit=idiosyncratic disturbances. Equation (1) assumes that the slope
(β1) is a random mean and the intercept for each bank is β1i.
Diagnostic tests
The Augmented Dickey Fuller (ADF) unit root tested for the data stationarity and the
cointegration order was adopted. The ADF decision criteria; reject the null hypothesis if the
computed ADF value were greater than critical values with significance. Results are as shown in
Table 2.
Table 2: Augmented Dickey-Fuller test statistic
Level t-statistic BS Prob.* t-statistic ROA Prob.*
ADF statistic -22.865 0.000 -20.90133 0.000 Test critical values: 1% -3.980112 -3.980112
5% -3.420584 -3.420584
10% -3.132989 -3.132989
Licensed under Creative Common Page 209 Table 2 computed absolute ADF of ROA and BS were 20.9 and 22.87 respectively. The score
was highly significant (P = .000) which means that all data variables had no unit root (ADF>CT)
at a level. This implies that the data was stationary at a 5 percent level with integration order
1(0). Therefore, based on these results, the panel data variables co-integrated well and as such,
it was safe to adopt other time series models such as ARDL.
The autocorrelation/serial correlation assessment was done using the Breusch-Godfrey
Serial Correlation Lagrange Multiplier (LM) test with the null-hypothesis that data variables had
serial correlation and alternative of no serial correlation. Insignificant LM outcome is desirable
as shown in table 3.
Table 3: Breusch-Godfrey Serial Correlation LM Test
F-statistic 112.6918 Prob. F(2,413) 0.17662 Obs*R-squared 147.5745 Prob. Chi-Square(2) 0.07945
Table 3 shows insignificant LM test results (F (2,413) = 112.7, P = .17, and χ2 = 147.6, P =
.079), which implies no serial correlation between the explanatory variables.
In error terms homogeneity assessment, the Breusch and Pagan) test was used with the
null-hypothesis that error terms were homoscedastic and alternative of heteroscedasticity. The
insignificance outcome is desired as shown in Table 4.
Table 4: Heteroscedasticity Test: Breusch-Pagan-Godfrey Results
F-statistic 0.410320 Prob. F(3,414) 0.5457 Obs*R-squared 1.239167 Prob. Chi-Square(3) 0.6436
Table 4 results reveal insignificant results (F (3,414) = .41, P = .5457 χ2 = 1.24, P = .6436),
which imply that error terms were homogeneous as such no evidence of heteroscedasticity.
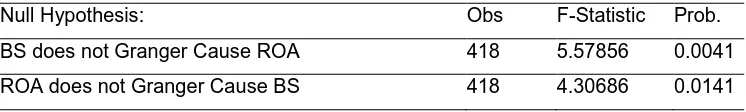
Correlation and regression analysis does not guide on causation. In other words, the
presence of correlation does not means causation. The pairwise Granger causality analysis was
carried out in order to determine as to whether the cross-section-time series data was useful in
forecasting each other. The Granger causality results are as shown in Table 5.
Table 5: Pairwise Granger causality test; Sample: 1 420 Lags: 2
Licensed under Creative Common Page 210 The results show that N=418, F=5.57856, P=.004, meaning bank size does granger cause
returns on assets and N=418, F=4.30686, P=.0141, meaning ROA does granger cause BS.
Therefore, the study failed to reject the null-hypothesis and demonstrate that at lag 2, there is
bidirectional causality between returns on assets and bank size.
For stability tests, the cumulative sum (CUSUM) test of the recursive residuals with the
5% critical lines was carried. CUSUM results are shown in figure 2.
Figure 2: CUSUM for ROA
-60 -40 -20 0 20 40 60
50 100 150 200 250 300 350 400
CUS UM 5% Signific anc e
From figure 2, the results show that the cumulative sum of squares was generally within the
significance red lines, suggesting that the residual variances were stable which imply that ROA
was stable and could be predicted successfully.
ANALYSIS AND FINDINGS
Descriptive statistics
In order to visualize the dataset, descriptive statistics were generated as shown in table 6.
Table 6: Descriptive Statistics Results
Statistic / Variable Return on Assets (ROA) Bank Size (BS)
Mean 2.032952 2.383667
Maximum 10.40000 14.52000
Minimum -32.15000 0.070000
Std. Dev. 3.760873 3.134857
Skewness -3.035954 1.902377
Kurtosis 3.22443 3.152713
Jarque-Bera 7890.979 427.2757
Probability 0.076400 0.068000
Licensed under Creative Common Page 211 Results reveal that ROA and BS had a mean of 2.03 and 2.38 respectively with the lowest and
highest returns earned being negative 32.2 percent and positive 10.4 percent respectively. The
largest bank had a mean score of 14.5 percent while the smallest had a score of 7 percent. The
results show a negative skewness for ROA, providing evidence that data distribution was more
to left tail than that of a normal distribution. It had a positive Kurtosis, which shows that the data
leans to the left of mean and heavily tailed distribution than normal. The Jarque-Bera
insignificance (P > .05) reveals that the variables data in all cases were normally distributed.
Positive kurtosis (ROA = 3.22443 & BS = 3.152713) coefficients indicate a relatively peaked
distribution. The skewness and kurtosis felt within the accepted range of chance fluctuation and
indicated that the distribution had no significant skewness and kurtosis problem.
Regression of bank size and returns on assets
The first null hypothesis (H01) stated that bank size does not significantly affect returns on
assets. Simple regression results are as presented in Table 7.
Table 7: Regression results for BS and ROA.
Model Summaryb
Model R R Square Adjusted R Square Std. Error Durbin-Watson
1 .422a .1783 .1722 .03792 1.796
ANOVAb
Model Sum of Squares df Mean Square F Sig.
1 Regression .001 1 .001 .513 .044a
Residual .598 416 .001
Total .599 417
Coefficientsb
Model Unstandardized β Std. Error Standardized β t Sig.
1 (Constant) .021 .002 9.177 .000
Bank Size .980 .001 .4223 3.717 .044
a. Predictors: (Constant), Bank Size: b. Dependent Variable: Return on Assets
Table 7 shows that BS explains 17 percent (Ṝ2 = .1722) of the variations in ROA. The model
finding shows that the independent variable, BS predicts precisely the dependent variable, ROA
with significance (F (1,416) = .513, P = .044). The Durbin-Watson (d = 1.798) close to two
implies that the independent error term assumption is tenable. The model further reveals that both unstandardized beta coefficient (β = .980, t = 3.717, P=.044) is positive and statistically
Licensed under Creative Common Page 212 as such, the null-hypothesis (H01) that the population value for the regression coefficient was
zero (0) was rejected. The prediction equation can be presented as:
ROAit = β0 + β1 (BS) + Ԑit.
ROA` = .021 + .980(BS)
Where: ROA`= the predicted return on assets, .021 = constant (β0),
.980 = the expected change on ROA` due to a 1-unit change in BS.
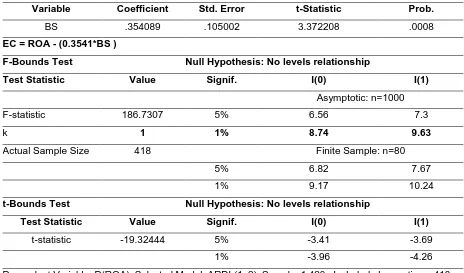
ARDL Long Run Form and Bounds Test Results
The second null-hypothesis (H02) evaluated the absence/presence of a long-run equilibrium
relationship between the dependent and independent variables, using the Autoregressive
Distributed Lag (ARDL) approach (Table 8). The ARDL long-run form and bounds test the
presence of a steady-state equilibrium between variables. The rule of thumb; long-run
equilibrium existed if F-statistic becomes greater than the upper bound critical values and does
not exist if less than the lower bound. The results would be inconclusive if F-statistics falls in
between the upper and the lower bounds critical values (Nayaran, 2005).
Table 8: ARDL Long Run Form and Bounds Test Results
Levels Equation
Case 5: Unrestricted Constant and Unrestricted Trend
Variable Coefficient Std. Error t-Statistic Prob.
BS .354089 .105002 3.372208 .0008
EC = ROA - (0.3541*BS )
F-Bounds Test Null Hypothesis: No levels relationship
Test Statistic Value Signif. I(0) I(1)
Asymptotic: n=1000
F-statistic 186.7307 5% 6.56 7.3
k 1 1% 8.74 9.63
Actual Sample Size 418 Finite Sample: n=80
5% 6.82 7.67
1% 9.17 10.24
t-Bounds Test Null Hypothesis: No levels relationship
Test Statistic Value Signif. I(0) I(1)
t-statistic -19.32444 5% -3.41 -3.69
1% -3.96 -4.26
Licensed under Creative Common Page 213 From Table 8, the absolute values of lower bound and upper were 6.56 and 7.3 respectively,
while the F-statistic was 186.7307 both at 5 percent significance level. Based on these results,
the F-statistic was above the upper-bound critical value and thus, the test result provides
enough evidence to reject the second null-hypothesis (H02). The study found a non-spurious
long-run level relationship between the bank size and returns on assets, with an error correction
equation, EC = ROA - (0.3541*BS).
Error Correction Model (ECM) Estimator Tests Results
Given the existence of a long-run equilibrium relationship, a short-run relationship was explored
using Error Correction (ECM). ECM explains the speed of adjustment in restoring disequilibrium
in the dynamic model, with a negative sign desired. The ECM results estimates are as
presented in Table 9.
Table 9: ARDL Error Correction Regression
ECM Regression.Selected Model
Variable Coefficient Std. Error t-Statistic Prob.
C 0.284796 0.330422 0.861916 0.3892
@TREND 0.004024 0.001376 2.924341 0.0036
D(BS) 0.515401 0.042221 12.20723 0.0000
D(BS(-1)) 0.145876 0.041683 3.499665 0.0005
CointEq(-1)* -0.949159 0.049056 -19.34859 0.0000
R-squared 0.610721 Mean dependent var 0.005909 Adjusted R-squared 0.606950 S.D. dependent var 5.353464 S.E. of regression 3.356283 Akaike info criterion 5.271435 Sum squared resid 4652.295 Schwarz criterion 5.319706 Log likelihood -1096.730 Hannan-Quinn criter. 5.290518 F-statistic 161.9836 Durbin-Watson stat 2.016849 Prob(F-statistic) 0.000000
Selected Model: ARDL(1, 2), Case 5: Unrestricted Constant and Unrestricted Trend, Sample: 1 420 Included observations: 418
Table 9 shows a high negative (-.9491159) ECM cointEq (-1)* with significant (P = .0000) at 5
percent level. The independent variables bank size had positive coefficients with significant (β
=.515401,t= 12.20723, P = .0000. The results indicate a goodness-of-fit short-run model with
satisfactory (R2 = .610721) and adjusted R-squared of 60 percent (Ṝ2= .606950), with the
Licensed under Creative Common Page 214 the short-run effects of the bank size explain about 61 percent of the change in returns on
assets. The estimated value of the coefficient of ECM implies that about 95 percent (cointEq
(-1)* = -.9491159) of the disequilibrium in returns on assets would offset by the short-run
adjustment within the same period (year).
SUMMARY OF FINDINGS
The main objective of the study was to establish the relationships between bank size and
profitability of commercial banks in Kenya. The independent variable bank size was modelled as a composite index based net assets, core capital, customers’ deposits, and numbers of loans and
deposits, in a weighted ratio of 33:33:33:.05:.05 consecutively. The profitability attribute, the
returns on assets (ROA) was computed as the ratio of earnings before interest and tax (EBIT)
over total assets. This paper anchors on resource-based theory, which assumes that banks are
profit maximizer and often own and control some underemployed resources. It puts more emphasis on the bank’s effectiveness in utilizing resources to yield higher financial performance.
Based on the testing of the first null-hypothesis (H01), the study found that bank size
relates positively (β= 0.354089, P = .0008) with returns on assets and explains 17 percent (Ṝ2=.1722) of the variation in ROA. This implies that on average the higher the bank size the
higher the returns on assets earned and vice-versa. This implies that larger banks report higher
returns on assets than small commercial banks.
Based on the analysis of the second null-hypothesis (H02), the study found a
non-spurious long-run and short-term level relationship between the bank size and return on assets,
with the error correction equation, EC = ROA - (0.3541*BS). The estimated value of the
coefficient of ECM implies that about 95 percent of the disequilibrium in returns on assets would
be corrected by the short-run adjustment within the same period, normally a year. This shows
that there existed a statistically significant relationship between the size of a bank and return on
assets in the short-run. This means that in the short-run a 1 percent increase in bank size leads
to a respective increase in returns on assets. Thus implies that bank size in the short-run does
not improve the profitability of commercial banks in Kenya instantly, after some time. In
summary, the findings of this study demonstrate that bank size influences significantly the
returns of commercial banks in Kenya.
CONCLUSIONS
Although consolidation is an emerging concern in Kenya as an expansion strategy, hitherto,
banks had embraced multiple banking and non-banking activities. The study concludes that the
Licensed under Creative Common Page 215 concludes that bank composite index relationship with returns on assets becomes plausible.
The study concludes that there exists both long-run and short-run equilibrium between the bank
size and returns of assets. The model prediction shows that commercial bank embraces
consolidation as an expansion strategy though it brings along with the cost aspects,
management complexity and perhaps increased exposure. The study found that as bank size
increases, the relationship with return on assets increases also. This demonstrates that as
commercial banks engage in expansion strategies like merger and acquisition, the profitability
opportunities increases as well to the extent that the exposure increases the benefits and as
such, the effects on returns on assets becomes strengthens.
RECOMMENDATIONS
In terms of policy and practice recommendations, the study has recommendations to bank
management, regulators and potential investors. Policymakers would appreciate the
contribution of the study in providing a scale of opportunities in order to understand the issues and constraints that affect the banking sector’s performance and would assist in prioritizing on
the sound expansive related activities mix, using new policies as a guide. The regulators, on the
other hand, can develop guidelines to be implemented by commercial banks bearing in mind the
size of bank to avoid unnecessary bank-runs or bursts in financial indicators and unwarranted
receivership or management of banks. Bank managers would find the findings useful in
identifying better business models, which improves financial records. It would be useful in
designing remedial schemes or programs to support the operations of banks as well as
entrepreneurs to diversify more and adapt effective economies of scale stream, which maintains banks’ financial stability over time as a going concern.
For further research, the study recommends research on profitability across institutions,
considering the dynamism of technology and the influx of micro-financial institution and agency
banking. The study suggests a study on their impact on the profitability of commercial banks in
Kenya. The current paper focused only on the registered commercial banks in Kenya and
replication of the study could be undertaken on financial institution not falling under this
jurisdiction such as insurance, housing finance, microfinance institutions and foreign exchange
bureaus.
REFERENCES
Abel, S. & Roux, P. (2016). Application of panzer-ross approach in assessing banking sector competition. Journal of economic and financial sciences, 6(9), 455-470.
Licensed under Creative Common Page 216 Babalola, A. & Abiola, R. (2013). Financial ratios analysis of firms. Journal of management sciences, 1(4), 132-137. Barney, J. & Peteraf, M. (2003). Unravelling the resource-based tangle. Managerial and decision economics, 2(4), 309-323.
Bolton, P., Freixas, X. & Shapiro, J. (2007). Conflicts of interest, information provision and competition in the financial service industry. Journal of financial economics 85(2), 297-330.
Bonin, P., Hasan, I. & Watchtel, P. (2004). Bank performance, efficiency and ownership in transition countries. Bank of Findland Discussion paper series no. 07/2004.
Boot, A. &Ratnovski, L. (2012). Banking and trading. IMF Working Paper No. 12/238, Washington, DC: International Monetary Fund.
Breusch, S., & Pagan, R. (1979). A simple test for heteroscedasticity and random coefficient variation. Econometrica, 48, 1287–1294.
Brown, R. Durbin J. & Evans M. (1975). Techniques for testing the constancy of regression relationships overtime. Journal of the royal statistical society, 37, 149–192.
Buiter, Willem H. (2009). Central banks and financial crises. Paper presented at the Federal Reserve Bank of Kansas City’s symposium maintaining stability in a changing financial system, at Jackson Hole, Wyoming, on August 21-23, 2008, 495-633.
Farhi, E. & Tirole, J. (2012). Collective moral hazard, maturity mismatch and systemic bailouts. American economic review 12(1), 60-93.
Gennaioli, N., Shleifer, A., & Vishny, R. (2013). A model of shadow banking. Journal of finance 68(4), 1331-1363. Goddard, J., McKillop, D. & Wilson S. (2008). The diversification and financial Performance of US credit unions. Journal of banking &finance, 3(2), 1836–1849.
Kristen, R. & Sengupta, R. (2016). Has the relationship between bank size and profitability changed? Federal Reserve Bank of Kansas City, economic review 1(2) 49-72: www.KansasCityFed.org.
Laeven, L. & Levine, R. (2007). Is there a diversification discount on financial conglomerates? Journal of Financial Economics 8(5), 331-367.
Laeven, L., Ratnovski L., & Tong H. (2014). Bank size and systemic risk: some international evidence. International Monetary Fund. Mimeo.
Lepetit, L., Rous, P. & Tarazi, A. (2008). Bank income size and risk: An empirical analysis of European banks. Journal of Banking and Finance, 32(8): 1452-1467.
Mester, J. (2010). Scale economies in banking and financial regulatory reform. The region, Federal Reserve Bank of Minneapolis, 10–13
Muhindi, A. & Ngaba, D. (2018). Effects of firm size on the financial performance of Commercial banks. Journal of Economics and Finance, 3(1), 175-190.
Mulwa, J. & Kosgei, D. (2016). Commercial bank diversification and performance: the moderating role of risk. Journal of finance and investment, 5(2), 31-50.
Olowokure, O. Tanko, M. & Nyor, T. (2015). Firm structural characteristics and financial reporting quality. International Business Research, 9(1), 106-122.
Shleifer, A. & Vishny, R. (2010). Unstable banking. Journal of financial economics 97(3), 306-318.
Terziovski, M. & Samson, D. (2000). The effect of firm size on organizational performance. The TQM magazine, 12(2), 144–148.
Vinals, J., Pazarbasioglu, C. Surti, J., Narain A., Erbenova M., & Chow J., (2013). Creating a safer financial system: Will the Volcker, Vickers, and Liikanen structural measures help. IMF Staff Discussion Note 13/04.