r
atP " ,
MOBILIZATION AND RECYCLING OF NITROGEN CONTEJ'I.'TS
IN SHOREAROBUSTAFOtLAOE
T.e. POKHRlYAL
Plant'Physiology BranCh
Forest Research Institute & Colleges, Debra Dun-248
006 "
SUMMARY.
Mobilizat'ion and recycling of nitrogen from the Shorea robusta follage' were
studied. The maximum quantity ofN mobilized (3S-4 kgth) and tecycled (15.18' k.Ii}h)
throUgh litter fall from the canopy was observed in the month of April. Maximum and minimum canopy N was noticed in the month of January (90 kg/h) and April (35.95 kgfh); respectiVely. ' On the seasonal average basis. maximum N mobilited and recycled from canopy was 59 and 92 per cent in summer season followed by 34 and 5 per cent in rainy'and minimum 1 and 3 peT cent in winter respecth.ely. However, a 'reverse trend was observed in case of canopY N i.e., maximum in winter and mhiimum in summer
seasons.
INTRODUCTION
Nitrogen is one of the most important essential element for the growth and development of trees. Forests may contain large quantities of N, with mote than 90% of it organically bound, while plants must obtain most of their N requirement as inorganic forms, which comprise less than 1
%
of the total. Forest growth depends upon the maintenance of this available N pool and its efficient use, which are achieved by the input and mineralization of plant litter and N cycling within 'forest biomass (Carlyle, 1986). Nitrogen recycling through litter faIl and translocation from foliage to &torage parts or vice-versa is an important aspect of its economy within the forest stand and manipulation to the adverse prevailng envirenmental conditions. Kaul et 01. (1979) reported highest percentage ofN in the sal leaves as compared to other plant parts and a negative relationship between leaf N and litter N by Pokhriyal et 01. (1987). In the percent communication. an attempt was made to study the changes in the behaviour of N content during difi'erent physiological processes and seasonal variations in the foliage of sal forest.MATERIALS AND METHODS
NITROGEN RECYCLING IN Shorea robusta 159
mentioned elsewhere (Pokhriyal et al., 1981). Nitrogen recycled through litter fall (kg/h) was calculated by mUltiplying nitrogen percentage of litter with the total quantity of monthly litter fall. Monthly foliage weight (kg/h) was calculated by subtracting the current litter fall from the total quantity of annual litter production, assuming that the maximum leaf age in sal tree is not more than a year.
Nitrogen present in the canopy and recycled in the form of litter was also calculated on the basis of data reported by Pokhriyal et al. (1981) and N translocation on the basis of the maximum values of N percentage observed in the canopy during the year i.e., in the month of January. Pande (1986) has also observed maximum foliage N during the months of Jan./Feb. in the sal plantation. Therefore, it was assumed that the maximum N was retained in the foliage during this month. The nitrogen from canopy was calculated by substracting the individual month's nitrogen content from the maximum observed values. Analysis of variance was carried out to see whether there exist any significant variation in nitrogen contents for the litter, foliage and due to mobilization.
RESULTS AND DISCUSSION
Maximum N loss through litter fall was observed in the month of April (15.98 kg/h) followed by March, May and lowest in the month of September (0.15 kg/h). The litter nitrogen contents for the months of March and April were significantly higher than the remaining months (Table I). Maximhm canopy nitrogen was observed in the month of January (90 kg/h) and minimum (35.95 kg/h) in the
,
month of April. In this case, two clearcut groups were observed; March, April,May, June and July were fairly lean months and without any significant differences among them. Similarly, the remaining months fall under same group with better canopy nitrogen. The amount of N translocated from canopy to the storage parts have also followed two distinct groups. The values observed during the months i.e., March to September have shown significantly higher mobilized N contents
L
as compared to remaining months i.e., October to February, (Table-I).....
~ Table I: The mean monthly values for litter, canopy nitrogen and mobilized N (kg/h) under natural sal (Shorea robusta) forest Soorce ofN Months Signi. contents ficanceI
I
I
Litter-N April March May June July Aug. Oct. Feb. Jan. Nov. Dec. Sept."'.'"
..
(Kgfh) 15.979 13.592 3.198 0.951 0.597 0.589 0.556 0.430 0.323 0.226 0.167 0.147S'l
(!I
I
I
I
Canopy-N Jan. Peb. Nov. Dec. Oct. Sept. Aug. July June May March April"'.'"
i
<Kgfh) 90.003 86.886 84.650 84.630 78.68 70.168 70.024 68.878 67.089 56.837 44.295 35.95:<
i=
---1ifITllOOIlN RECY~LING IN Shorea robusta
161
that the soluble from of N in sal foliage has a tendency of mobility. David and David (1966) and Tromp and Ova, (1971) have reported a considerable conversion of protein to amino acids in twigs prior to bud burst which is an important N storage site over the leafless period in deciduous trees.
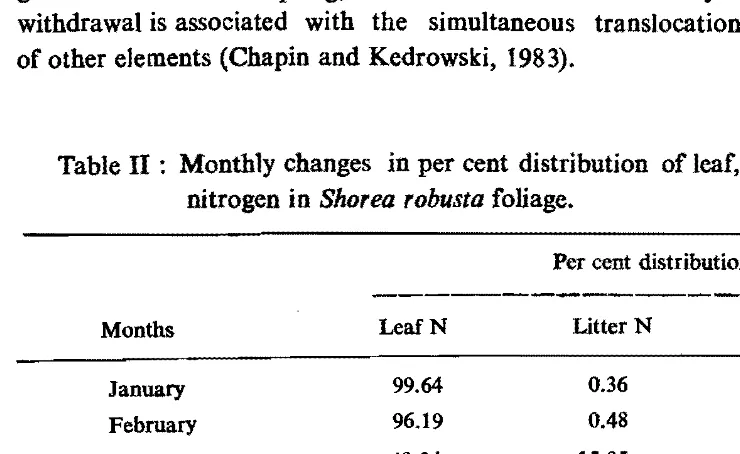
Maximum N lost (17.7%) through litter fall, mobilization from foliage (42.5%) and minimum foliage N (39.8%) was noticed in the month of April when maximum litter fall and soil moisture depletion occurred in the sal forest (Pokhriyal et 01., 1987)
(Table II). With the increased rate of litter fal], new flushes started emerging and N uptake and mobilization diverted towards the young foliage. Thus, a straight increase in N accumulation in the sal foliage can be visualized from April to the month of January (Table 1). Translocation of N from aging or abscissing gives the tree an energy advantage if the N withdrawn is stored in the organic form and reduces the potential of loss through leaching or immobilization. Additionally, it conveys a degree of nutritional independence from the soil when new growth commences in spring. at a time when N availability may be low. Nitrogen withdrawal is associated with the simultaneous translocation of carbohydrates and of other elements (Chapin and Kedrowski, 1983).
Table II : Monthly changes in per cent distribution of leaf, litter and mobilized nitrogen in Shorea robusta foliage.
Per cent distribution
Months LeafN Litter N Mobilized N
January 99.64 0.36 0.00
February 96.19 0.48 3.33
March 49.04 15.05 35.91
April 39.80 17.69 42.51
May 62.92 3.52 33.54
June 74.27 1.05 \ 24.68
July 76.26 0.66 23.08
August 77.52 0.65 21.82
September 77.68 0.16 22.15
October 87.11 0.61 12.28
November 93.72 0.25 6.03
162
T.e. POKHRIYAtOn the seasonal average basis, maximum N lost through litter fall was 92% in summer (March to June).
5%
in rainy (July to October) and3%
in winter (November to February) seasons and N content mobilized from foliage to storage parts in sal stand, was 59% in summer, 34% in rainy and 7% in winter months. Earlier, deciduous species were shown to translocate significant quantities of N prior to foliage abscission e.g. 78% for Chestnut Oak (Ostman and Weaver, 1982),90% for tamarak (Cole, 1981), 33-36% for northern hardwoods (Ryan and Bormann, 1981) and 70% for eastern deciduous forest (Luxmoore, et al 1981), Whereas, maximum foliage N was available during winter season followed by rainy and minimum in summers. In winter, due to the low temperature most of physiological activities in the foilage temporaily ceased, which enables to inhibit the N losses and mobilization starts with the changes in the temperature and emergence of new leaves. However, Culyle (1986) reported that deciduous species exhibit a marked increase in input before the onset of cold and dry seasonal conditions.REFERENCES
Carlyle, J.C. (1986). Nitrogen Cycling in Forested Ecosystems. Forestry Abstract 47 : 307-328. Chapin, F.S. and Kedrowski, R.A. (1983). Seasonal changes in Nand P fractions and autumn
retranslocation in evergreen deciduous taiga trees Ecology 64 : 376-391.
Cole, D.W. (1981). Nitrogen uptake and tranlocation by f:rest ecosystems. In "Terrestrial N Cycles" Eds. .E. Clark and T. Rosswall. Ecological Bull 33 : 219-231.
David, R. and David, H. (1966). Contents of protein N and soluble N in buds and the migration of N compounds produced in the branches of Pinus pinoster. C.R. Acad. Sci. Paris
18 : 1945-1948.
Kaul, O.N., Sharma, D.C. and P.B.L. Srivastava (1979). Distribution of organic matter and plant nutrients in a sal (Shoera robusta) coppice plantation. Ind. Forester liS : 171-!79.
Luxmoore. R.J.. Grizzard. T., Strand, R.H. (1981). Nutrrient translocation in the canopy and understory of an eastern deciduous forest. For Sci. 27 : 505-518.
Ostman, N.L. aud Weaver, G.T. (1982). Autumnal nutrient transfers by retranslocation, leaching and litter fall in a Chestnut Oak forest in Southern Illinois. Can. J. For. Res.
12: 40-52.
Pande, P.K. (1986). Litter production and decomposition mineral release and biochemical diversity of four forest stands, Shorea robusta. Tectona grandis. Eucalyptus spp. Pinus roxburghit at GRI demonstration area. Ph.D thesis submitted to Garhwal University.
Srinagar, Garhwalt.
Po1iliriyal, T.C.• Ramola. B.C. and Rathi. A.S. (1087). Soil moi&ture regime and nitrogen content in natural sal forest (Shorea robusta). Ind. Fore. 113 : 300-306.
Rayan. D.F., and Bormann, F.H. (1982). Nutrient resorption in northern landwood forest.
Bio. Science 32 : 29-32.