Neonatal Hospital Lengths of Stay, Readmissions, and Charges
Anne M. Marbella, MS; Veerappa K. Chetty, PhD; and Peter M. Layde, MD, MSc
ABSTRACT. Objective. To evaluate trends in length of hospital stay, hospital charges, and readmission rates of Wisconsin newborns from 1989 through 1994 in light of recent policies requiring earlier discharges after deliv-ery of newborns.
Methodology. Two data sources were used: 1) 1989 – 1994 Hospital Inpatient Discharge Data from the Wiscon-sin Office of Health Care Information, and 2) 1994 birth certificate and matched infant mortality data from the Wisconsin Center for Health Statistics. Average lengths of stay and average hospital (delivery and readmission) charges were calculated, and readmission rates were es-timated for full-term, premature, and sick newborns.
Results. There were 368 955 full-term and 26 668 pre-mature newborns in Wisconsin from 1989 through 1994. The average length of stay decreased by 24% in full-term newborns from 1989 through 1994, while average hospi-tal (delivery and readmission) charges rose over 40% during the same period. Average length of stay for pre-mature infants increased by 24% while their hospital delivery charges increased 214% during the study period. Readmission rates halved, yet charges per readmission doubled for full-term infants. More than twice as many full-term newborns were classified as sick in 1994 (43%) compared with 1989 (19%).
Conclusions. Managed care efforts to control costs of neonatal care through earlier newborn discharge policies may have limited impact. Physicians or hospitals may be compensating for these policies by classifying more new-borns as sick, thereby allowing for longer hospital stays to be reimbursed by the insurance carriers. Premature infants,<7% of the total births, account for half of all hospital delivery charges. Efforts to reduce premature births may have a greater impact on neonatal health care costs than efforts to discharge full-term newborns earlier.
Pediatrics 1998;101:32–36;newborn early discharge, new-born readmission rate, delivery hospital charges.
ABBREVIATIONS. OHCI, Office of Health Care Information; CI, confidence interval.
T
he length of hospital stay after delivery for healthy full-term infants has dropped steadily in the last decade in the United States.1As part of their effort to contain the cost of medical care, many managed care organizations are attempting to accelerate this trend by implementing policies re-quiring earlier discharge for full-term infants with noobvious health problems.2–5 These policies typically suggest routine newborn discharge within 24 hours after vaginal delivery and 72 hours after caesarean delivery,6based on the belief that there are substan-tial savings and no major adverse health effects as-sociated with the earlier discharge times.4
Public reaction to these early discharge require-ments has been widespread and intense. Editorials decrying the policies have appeared in both medical and lay publications.2,3,7,8 Discharge recommenda-tions were published by professional organizarecommenda-tions warning of the risk that infants discharged earlier may have an increased rate of readmission to hospi-tal in the first few weeks of life.5,9Several state leg-islatures have passed laws prohibiting managed care organizations from implementing early discharge policies.7 Similar legislation was first introduced in the United States Senate in 1995 by a bipartisan group of legislators. The bill requires insurance com-panies to cover at least 48 hours of newborn and mother inpatient care after vaginal delivery and 96 hours of care after cesarean delivery.7 This bill, the Newborns’ and Mothers’ Health Protection Act of 1996, was signed by President Clinton on September 26, 1996.10
At present, objective data on the health effects of early discharge of newborns and mothers are limit-ed.5,6,11Much of the current literature is based on case series or descriptions of individual hospital dis-charge and follow-up programs, which so far have not included an adequate control group.12–19Because five of the six randomized trials in the literature are based on fewer than 50 infants on average in the early discharge groups, important differences in re-admissions and other adverse health outcomes may not have been detected.20 –24 The only large random-ized trial, published in 1962, defined early discharge as a length of stay of ,72 hours.25 Under current discharge policies, however, this would be consid-ered a prolonged length of stay.
To examine recent trends in newborn length of stay, readmissions, and hospital charges, we studied hospital discharge data on Wisconsin births from 1989 through 1994.
METHODS
Public use data files of Hospital Inpatient Discharge Data from Wisconsin’s Office of Health Care Information (OHCI) were used for most of these analyses. All of Wisconsin’s acute care nonfed-eral hospitals are required to report the following information on admissions and discharges to the OHCI: patient demographic data, charge and payer data, and diagnostic and procedure data. A majority of the data elements in the OHCI data file, including admission source code, discharge status, and diagnostic related
From the Department of Family and Community Medicine, Medical College of Wisconsin, Milwaukee, Wisconsin.
Received for publication Nov 4, 1996; accepted May 28, 1997.
Reprint requests to (P.M.L.) Medical College of Wisconsin, Department of Family and Community Medicine, 8701 Watertown Plank Rd, Milwaukee, WI 53226.
group code, are items taken directly from the Uniform Billing form (UB-82).26The database did not contain any individual
pa-tient identifiers. OHCI files from 1989 through 1994 were used. Records of newborns and infants in the age category,28 days old were selected from the data files; birth date and admission date were unavailable so that exact age (in days) of the infants could not be determined. We excluded the records of those infants whose state of residence was not Wisconsin and whose admission was listed as an “extramural birth,” indicating a delivery outside of the hospital.
Birth weight was not available in this data set, so linked birth certificate and matched infant mortality data used to compile the
Wisconsin Maternal and Child Health Statistics 199427were used to
study the relationship of birth weight and hospital delivery charges. Average hospital delivery charges per infant discharged to home were calculated. “Discharged to home” excluded those infants who had died at the birth hospital as well as those who had been transferred to a chronic care institution.
Because gestational age was not reported, we defined prema-ture infants as those with a newborn admission source code of “premature infant” or those with a diagnostic-related group code of “extreme immaturity or respiratory distress syndrome,” “pre-maturity with major problems,” or “pre“pre-maturity without major problems.” We defined sick newborns as those full-term new-borns with a newborn admission source code of “sick baby” or those with a diagnostic-related group code indicating “full-term neonate with major problems” or “neonate with other significant problems.” All other full-term newborns were defined as healthy for the purposes of the study.
The annual readmission rates for full-term infants were esti-mated by dividing the number of readmissions of infants 28 days old or less each year by the number of births each year. Annual readmission rates were not calculated for premature infants be-cause the initial length of stay after delivery of premature infants extended far into the 28-day measurement period for readmis-sions. Average lengths of stay and average hospital delivery charges were calculated for full-term newborns, premature new-borns, and sick newborns. The average lengths of stay were cal-culated by dividing the total number of delivery days of stay by the number of births per subgroup and the average hospital delivery charges per subgroup were calculated by dividing the total hospital charges for the delivery admission in each subgroup by the number of births in that subgroup. The total hospital charges, which include both readmission and delivery hospital charges per subgroup, were calculated for full-term infants by adding the delivery charges and the readmission charges within the first month of life, and dividing that total by the number of full-term newborns. Total hospital charges (delivery and sion) were not calculated for premature infants because readmis-sions within 28 days for premature infants is not a comparable measurement to readmissions of full-term infants due to the ex-tended length of stay after a premature delivery. The SAS statis-tical package (SAS Institute, Cary, NC) was used for all analyses.28 x2tests were performed to compare percentages and analyses of
variance were used to compare means.29 Confidence intervals
(CIs) on differences between proportions were calculated by stan-dard methods.30
RESULTS Delivery Length of Stay
There were 368 955 full-term newborns and 26 668 premature newborns in the admissions records for Wisconsin from 1989 through 1994. The number of total births and proportion of premature newborns fluctuated somewhat from year to year but remained relatively constant over the study period (Table).
Among full-term newborns, however, the propor-tion classified as sick appeared to change markedly beginning in 1993 (Fig 1). In 1989, 19.5% of full-term infants were classified as sick; by 1994, the rate more than doubled to 43.0% (Fig 1). This absolute differ-ence in the 1989 and 1994 rates was 23.5% (95% CI: 23.0%, 24.0%).
Average postdelivery lengths of stay for full-term newborns, both healthy and sick, have decreased during the study period. The average delivery length of stay for healthy full-term newborns decreased 29%, from 2.4 days in 1989 to 1.7 days in 1994 and the average length of stay for sick full-term newborns decreased 36% from 3.3 days in 1989 to 2.1 days in 1994. Sick full-term newborns had a hospital stay almost a day longer than healthy full-term infants in 1989 but less than half a day longer in 1994. Average length of stay for premature newborns increased 24% over the same period, from 11.4 days in 1989 to 14.1 days in 1994. Most of this increase occurred between 1989 and 1991; the length of stay remained relatively constant between 1991 and 1994.
For full-term newborns, the proportions staying 0 days (,24 hours) or 1 day after delivery have in-creased and the proportions staying 2 days or 3 or more days have decreased significantly during the study period (Fig 2). The percentage of full-term newborns discharged after ,24 hours has doubled from 0.6% in 1989 to 1.2% in 1994, and the percentage discharged after a single day stay has increased 362% from 9.4% to 43.4%. The difference in the number of full-term newborns staying two days or longer in the hospital after delivery is 31.9% (95% CI: 31.4%, 32.3%) less in 1994 compared with 1989.
Readmissions
The rate of readmission to hospital (after initial discharge) in the first month of life for full-term newborns decreased sharply during the early years of the study period, leveling off to 3.4 –3.5 per 100 newborns during 1992 through 1994 (Fig 3). Most of
TABLE. Number of Newborns, Percent Premature, and Hospital Charges for Wisconsin Newborns, 1989 –1994
1989 1990 1991 1992 1993 1994
Total number of newborns 64 874 67 597 67 579 65 409 65 370 63 794
Percent premature 7.5% 6.7% 6.4% 6.9% 6.8% 6.3%
Average delivery charges*
Full-term 691 770 861 923 990 977
Premature 7903 9614 13 086 13 767 14 821 16 973
Average total charges†
Full-term 834 910 1012 1042 1152 1128
* Calculated by totalling the charges for initial delivery stay and dividing by the number of births.
the decrease in neonatal readmissions was due to an 83% reduction in readmissions for jaundice between 1989 and 1994; readmissions for all other causes de-creased by 22% during the same period.
Hospital Charges
Average total hospital charges per full-term new-born, which were calculated by adding delivery and readmission charges within the first month of life and dividing by the number of births, are shown in the Table. Average total hospital charges per full-term infant rose from $834 in 1989 to $1128 in 1994. This 35% increase was roughly equivalent to what would be expected based on the consumer price index for medical care for the same time period.31
Although the proportion of premature births ranged from 6.3% to 7.5% per year during the 6-year study period, these births accounted for 48% to 54% of the total annual hospital delivery charges. Aver-age hospital delivery charges for premature infants rose 115%, from $7903 in 1989 to $16 973 in 1994, while average hospital delivery charges for full-term infants rose 41% during the same time period (Table).
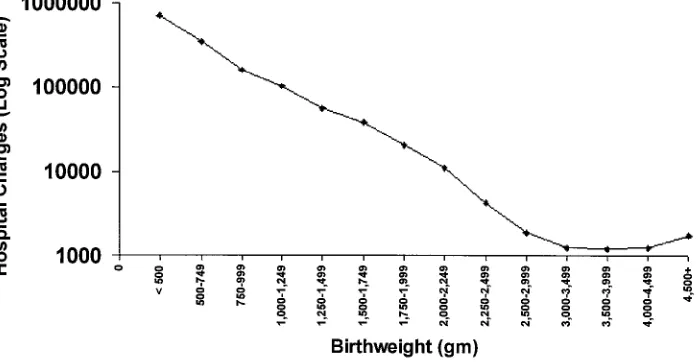
In 1994, newborns who weighed ,2500 g ac-counted for only 6.3% of the total births, but were responsible for 48.8% of the total neonatal hospital delivery charges in Wisconsin. With the 1994 Wis-consin birth certificate data, a more detailed analysis of the association of birth weights to hospital deliv-ery charges was possible. The 1994 average hospital delivery charge per infant of a particular birth
weight discharged to home was calculated by divid-ing the sum of the hospital delivery charges for neo-natal care for infants of a given birth weight by the number of infants of that birth weight who were discharged to home (as opposed to dying or being discharged to a long-term care facility). The hospital delivery charges per infant discharged to home in-creased exponentially with decreasing birth weight, varying from ,$1300 per infant weighing between 3000 and 4500 g at birth to over $700 000 per infant
,500 g at birth (Fig 4).
COMMENTS
This study was conducted to evaluate recent trends in newborn length of stay, readmissions, and hospital charges in light of managed care policies to promote earlier discharge after delivery. Our analy-ses, limited by the ecological nature of the data, were descriptive in nature. The hospital discharge data-base contained only limited clinical detail on the infants; costs and readmission rates were the main outcomes that could be measured. Future studies should be conducted to evaluate the effects of early discharge policies on other relevant outcomes, such as infant health and maternal satisfaction. Despite these limitations, the study provides important in-sights into the real world impact of early discharge policies, including possible physician response to the policies, and their influence on length of postdelivery hospital stay, neonatal readmission to hospital, and hospital charges.
The doubling of the proportion of full-term new-borns being classified as sick in 1993 and 1994, the same years that early discharge policies were being implemented, has several possible explanations. Be-cause it is unlikely that suddenly twice as many newborns were sick in 1993 and 1994 compared with earlier years, the doubling of this classification at birth may be artifactual in nature. Administrative changes in coding procedures or protocols in Wis-consin hospitals beginning in 1993 would be an ex-ample of a possible artifact, but there have been no reports of such changes. The fact that the sharp rise in newborns classified as sick occurred the same year that early discharge policies were implemented sug-gests that either physicians are responding to these policies by classifying more newborns as sick in or-der to justify having the newborn stay in the hospital for extra time beyond what is allowed by the new
Fig 3. Rates of hospital readmission for total causes, jaundice, and other causes in first month of life for full-term newborns in Wisconsin, 1989 –1994.
Fig 1. Proportion of healthy full-term, sick full-term, and prema-ture births in Wisconsin, 1989 –1994.
discharge policies, or that hospitals are classifying these newborns as sick to get the reimbursement from the insurance carriers. The absolute difference in the rates of classifying infants as sick between 1989 and 1994 was 23.5%, suggesting that the practice may be widespread, affecting almost one in four full-term newborns.
Our findings show that implementation of early discharge policies was not associated with an in-crease in readmission rates among full-term new-borns. In a review of all US publications between 1960 and 1985 with early discharge data, Norr32 concluded that discharge under 48 hours after de-livery was generally safe for mothers and infants. In contrast, a chart review by Conrad33 in 1989 found higher readmission rates among those charged within 48 hours compared with those dis-charged after 48 hours, and a recent study in On-tario also found higher rates of readmissions following decreases in average lengths of stay for newborns.34
Although infant readmission rates remained low in Wisconsin since introduction of early discharge policies, the increase in charges per readmission is larger than in earlier years. This may indicate that infant readmissions are now for more serious, and therefore more costly, conditions.
The charges per delivery hospitalization of prema-ture infants from 1989 through 1994 increased 215%, a rate that far exceeds the expected rise in medical care charges during this time. One explanation for this increase could be the development of surfactant therapy for respiratory distress syndrome. The threshold of viability has been lowered from 28 to 31 weeks to 23 to 24 weeks since widespread use of surfactant therapy in the early 1990s. These smaller infants require more intensive and prolonged care, causing hospital costs to rise steeply.35
CONCLUSIONS
These analyses suggest that current managed care efforts to control the costs of neonatal care by short-ening the length of hospital stay after delivery may be misdirected, or at least may have little impact. Physicians and hospitals appear to have adjusted
their diagnosis or classification of sick newborns, perhaps to justify longer lengths of stay. In 1994, the hospital charges associated with delivery of about 4000 premature newborns nearly equaled the charges for about 60 000 full-term newborns. Efforts to reduce premature births in managed care popula-tions may have a greater impact on controlling med-ical costs than efforts to discharge full-term deliver-ies earlier.
REFERENCES
1. Centers for Disease Control. Trends in length of stay for hospital deliv-eries—United States, 1970 –1992.MMWR.1995;333:1647–1651 2. Annas GJ. Women and children first.N Engl J Med.1995;333:1647–1651 3. Parisi VM, Meyer BA. To stay or not to stay? That is the question.N Engl
J Med.1995;333:1635–1637
4. Roberts J. US warns against early discharge of babies.Br Med J.1995; 311:1041–1042
5. Kessel W, Kiely M, Nora AH, Sumaya CV. Early discharge: in the end, it is judgment.Pediatrics.1995;96:739 –742
6. Braverman P, Egerter S, Pearl M, Marchi K, Miller C. Problems associ-ated with early discharge of newborn infants. Pediatrics. 1995;96: 716 –726
7. Downs SM, Loda F. Duration of hospital stay for apparently healthy newborn infants.J Pediatr.1995;127:736 –737
8. Lawrence RA. Early discharge alert.Pediatrics.1995;96:966 –967 9. Committee on Fetus and Newborn, 1994 to 1995. Hospital stay for
healthy term newborns.Pediatrics.1995;96:788 –790
10. Newborns’ and Mothers’ Health Protection Act of 1996, Public Law 104 –204, Title VI, 1996
11. Britton JR, Britton HL, Beebe SA. Early discharge of the term newborn: a continued dilemma.Pediatrics.1994;94:291–295
12. Cottrell DG, Pittala LJ, Hey DJ. One-day maternity care: a pediatric viewpoint.J Am Osteopath Assoc.1983;83:216 –221
13. Avery MD, Fournier LC, Jones PL, Sipovic CP. An early postpartum hospital discharge program: implementation and evaluation.J Obstet Gynecol Neonatal Nurs.1982;11:233–235
14. Nabors GC, Herndon ET. Home puerperal care following hospital delivery.Obstet Gynecol.1956;7:211–213
15. Rhodes MK. Early discharge of mothers and infants following vaginal childbirth at the United States Air Force Academy: a three year study. Mil Med.1994;159:227
16. Jansson P. Early postpartum discharge.Am J Nurs.1985;85:547–550 17. Welt SI, Cole JS, Myers MS, Sholes DM, Jelovsek FR. Feasibility of
postpartum rapid hospital discharge: a study from a community hos-pital population.Am J Perinatol.1993;10:384 –387
18. Williams LR, Cooper MK. Nurse-managed postpartum home care.J Obstet Gynecol Neonatal Nurs.1993;22:25–31
19. Guerriero WF. A maternal welfare program for New Orleans.Am J Obstet Gynecol.1943;46:312
20. Carty EM, Bradley CF. A randomized, controlled evaluation of early
postpartum hospital discharge.Birth.1990;17:199 –204
21. Waldenstrom U, Sundelin C, Lindmark G. Early and late discharge after hospital birth: breastfeeding.Acta Paediatr Scand.1987;76:727–732 22. Brooten D, Kumar S, Brown LP et al. A randomized clinical trial of early
hospital discharge and home follow-up of very-low-birth-weight in-fants.N Engl J Med.1986;315:934 –939
23. Brooten D, Roncoli M, Finkler S, Arnold L, Cohen A, Mennuti M. A randomized trial of early hospital discharge and home follow-up of women having Cesarean birth.Obstet Gynecol.1994;84:832– 838 24. Yanover MJ, Jones D, Miller MD. Perinatal care of low-risk mothers and
infants.N Engl J Med.1976;294:702–705
25. Hellman LM, Kohl SG, Palmer J. Early hospital discharge in obstetrics. Lancet.1962;1:227–232
26. US Department of Health and Human Services, Health Care Financing Administration.Medicare Statistical Files Manual.Baltimore, MD: US De-partment of Health and Human Services, Health Care Financing Admin-istration, Bureau of Data Management and Strategy; HCFA Publishing No. 03272. 1990
27. Soref M, Silbaugh J.Wisconsin Maternal and Child Health Statistics 1994. Madison, WI: Center for Health Statistics, Division of Health, Wisconsin
Department of Health and Social Services; 1995
28. SAS Institute Inc.SAS Procedures Guide, Version 6.3rd ed. Cary, NC: SAS Institute; 1990
29. Steel RGD, Torrie JH.Principles and Procedures of Statistics.2nd ed. New York, NY: McGraw-Hill Book Company; 1980
30. Fleiss JL.Statistical Methods for Rates and Proportions. New York, NY: John Wiley & Sons; 1981
31. US Bureau of the Census.Statistical Abstract of the United States: 1994. 114th ed. Washington, DC: US Bureau of the Census; 1994
32. Norr KF, Nacion K. Outcomes of postpartum early discharge, 1960 –1986: a comparative review.Birth.1987;14:135–141
33. Conrad PD, Wilkening RB, Rosenberg AA. Safety of newborn discharge in less than 36 hours in an indigent population.Am J Dis Child.1989; 143:98 –101
34. Lee K-S, Perlman M, Ballantyne M, Elliott I, To T. Association between duration of neonatal hospital stay and readmission rate.J Pediatr.1995; 127:758 –766
35. Kliegman RM. Neonatal technology, perinatal survival, social con-sequences, and the perinatal paradox.Am J Public Health.1995;85: 909 –913
THE TRANSCENDENT ROLE OF FITNESS
We have redefined virtue as healer. And considering the probable state of our souls, this was not a bad move . . . We may not have become the most virtuous people on earth, but we surely became the most desperate for grace. We spend $5 billion a year on our health club memberships, $2 billion on vitamins, nearly $1 billion on home exercise equipment, and $8 billion on sneakers to wear out on our treadmills and Stairmasters. We rejoice in activities that leave a hangover of muscle pain and in food that might, in more temperate times, have been classified as fodder. To say we want to be healthy is to gravely understate the case. We want to be good.
Ehrenreich B.The Naked Truth About Fitness in the Snarling Citizen.New York, NY: Farrar and Straus; 1995.
DOI: 10.1542/peds.101.1.32
1998;101;32
Pediatrics
Anne M. Marbella, Veerappa K. Chetty and Peter M. Layde
Neonatal Hospital Lengths of Stay, Readmissions, and Charges
Services
Updated Information &
http://pediatrics.aappublications.org/content/101/1/32 including high resolution figures, can be found at:
References
http://pediatrics.aappublications.org/content/101/1/32#BIBL This article cites 28 articles, 5 of which you can access for free at:
Subspecialty Collections
nsition_-_discharge_planning_sub
http://www.aappublications.org/cgi/collection/continuity_of_care_tra Continuity of Care Transition & Discharge Planning
http://www.aappublications.org/cgi/collection/hospital_medicine_sub Hospital Medicine
http://www.aappublications.org/cgi/collection/neonatology_sub Neonatology
sub
http://www.aappublications.org/cgi/collection/fetus:newborn_infant_ Fetus/Newborn Infant
following collection(s):
This article, along with others on similar topics, appears in the
Permissions & Licensing
http://www.aappublications.org/site/misc/Permissions.xhtml in its entirety can be found online at:
Information about reproducing this article in parts (figures, tables) or
Reprints
DOI: 10.1542/peds.101.1.32
1998;101;32
Pediatrics
Anne M. Marbella, Veerappa K. Chetty and Peter M. Layde
Neonatal Hospital Lengths of Stay, Readmissions, and Charges
http://pediatrics.aappublications.org/content/101/1/32
located on the World Wide Web at:
The online version of this article, along with updated information and services, is
by the American Academy of Pediatrics. All rights reserved. Print ISSN: 1073-0397.