Modified Neural Network Architecture based
Expert System for Automated Disease
Classification and Detection using PCA
Algorithm
SM Ushaa
1, M. Madhavilatha
2, G. Madhusudhan Rao
3[email protected], Department of ECE,
Siddharth Institute of Engineering & Technology, Puttur,
Affiliated to JNTU, Anantapur, Tele: 919346670707
[email protected], Department of ECE,
JNTU, Hyderabad, Tele: 919848506611
[email protected], Principal,
Al Aman College of Engineering, Vishakapatnam, Affiliated to JNTU-Kakinada
Tele: 919963597212
Abstract
The need of mankind today is ever increasing and it is necessary to support human life with reliable, affordable and sophisticated medical products. One of the areas in which the growth in technology can be fully utilized is the automated disease detection and drug delivery unit that can automatically monitor, diagnose and also provide medication to human being without human intervention. Oral and injection are the predominant methods of drug delivery. Automated disease detection and drug delivery unit that can be used for detection and monitoring of cancer is proposed, designed, modeled and implemented in this work. For the first time, a software reference model for the complete unit as a system is developed and analyzed for its functionality. It is found that the proposed PCA based technique classifies accurately up to 97.67% compared to the earlier technique which was classifying the same data pattern correctly up to 94%, thereby achieving an improvement of more than 4%.
Key Words:
Expert System, Neural Networks, Automated Drug Delivery, Biosensors, PCA technique.
Introduction
has the potential to enhance drug bioavailability, improve the timed release of drug molecules, and enable precision drug targeting. Nanoscale drug delivery systems can be implemented within pulmonary therapies, as gene delivery vectors, and in stabilization of drug molecules that would otherwise degrade too rapidly [7-8]. Additional benefits of using targeted nanoscale drug carriers are reduced drug toxicity and more efficient drug distribution. The advantages of nanostructure-mediated drug delivery are their ability to deliver drug molecules directly into cells and the capacity to target tumors within healthy tissue. Nanostructured delivery architectures are promising candidates that will enable efficient and targeted delivery of novel drug compounds [9-11]. A biosensor is an analytical device incorporating a biological material that can detect biological or chemical analytes in solution or in the atmosphere with a physiochemical transducer that produces discrete or continuous electrical signals proportional to the analytes. A biosensor consists of Bioreceptor and Transducer [12-16]. Automated disease detection and drug diffusion unit [17-19] shown in Figure 1 consists of a biosensor implanted on a human being. The sensors detect the presence of virus or micro-organism in a human body. The electrical signal generated by the sensor output is used to control a drug diffusion pump that automatically diffuses required quantity of drug to the patient.
Figure 1 Automated Drug Diffusion Unit
Diseases in a human body are detected by the presence of sensors located at specific parts of the body. Sensors used within a human body interact with blood, tissues, DNAs and cells to detect the presence of specific antigen. Electrical signal generated by the sensor due to change in sensor property is measured and is used in detection of diseases. The detected disease is classified and is used in selection of a drug from the drug storage cell. Appropriate drug selected based on disease detected and other human body conditions are diffused through an actuator or pump. The drug diffused is monitored and is diffused in a controlled manner to cure the disease. Figure 2 shows the block diagram of automated drug delivery system
Exhaustive studies and developments in the field of nanotechnology have been carried out and different nanomaterials have been utilized to detect cancer at early stages. Nanomaterials have unique physical, optical and electrical properties that have proven to be useful in sensing. Quantum dots, gold nanoparticles, magnetic nanoparticles, carbon nanotubes, gold nanowires and many other materials have been developed over the years. Nanotechnology has been developing rapidly during the past few years and with this, properties of nanomaterials are being extensively studied and many attempts are made to fabricate appropriate nanomaterials [20, 21]. Due to their unique optical, magnetic, mechanical, chemical and physical properties that are not shown at the bulk scale, nanomaterials have been used for more sensitive and precise disease detection. For developing a system to detect disease, software modeling is one of the major requirements. Matlab environment is predominantly used for developing software reference models. Various sensor models (electrical and mechanical) are already inbuilt in Matlab and are readily available for development of automotive and mechanical system [22]. There are a large number of nanobio sensors that are being used for medical applications in disease detection. There is a need for a mathematical model of nanobio sensor for developing a software reference model in disease detection using Matlab. Thus in this work, it is proposed to develop a mathematical model for nanowire, that is used for cancer detection.
Background Theory on Biosensor
Human genomes have billions of DNA base spheres to sense the DNA sequence. Arrays of sensors are used for genome sensing. Nanobio sensor consists of X-Y array of elements. These elements further consist of pixels called as electronic components [23]. Each component is a sensor that can be a nanowire transistor, carbon nanotube, planar transistor etc. Each element has a unique and known DNA sequence (genome) bound to the sensor. As in figure 3, Q1 is one such sequence consisting of ACGAT [24, 25] molecule arranged in an order. Each location in the X-Y array has a known sequence attached to it. Figure 3 shows the array of sensors, and the corresponding DNA sequence attached to the sensor.
Figure 3. Nanosensor Array and DNA sensor [23]
When an unknown DNA sequence is introduced into the XY array, the unknown sequence finds its conjugate in the XY array and binds with the DNA sequence present on the array as shown in Figure 3. Since the DNA sequence at every location along the XY array is known, the binding of unknown sequence with known DNA sequence modulates the current in the corresponding element in the XY array.
Figure 4 DNA Strand and Sensor Response Time [23]
The response time is defined as the time taken to change the conductance of the sensor from the time the sensor is immersed in the analyte solution. Response time depends upon sensor type and other sensor parameters. There are different kinds of nanobio sensors such as Chem FET, IsFET, Nanowire, Nanosphere, Nanodots and Carbon Nano Tube (CNT). Sensitivity is one of the major parameter that needs to be considered to select an appropriate sensor for drug delivery. Sensors consist of source and drain regions placed above a gate. Gate consists of receptors that capture the unknown molecules that diffuse across the target molecules. Current flows between source and drain, and the molecules that are bound to the sensor determine the source-drain current. The sensitivity of such sensor is found to be between molar and few micros molar (10-6M) [26]. This is a very small value. It is therefore essential that sensors should have higher sensitivity for diseases detection. Based on the modified equation ,
mathematical models for nanowire sensor is developed. The value of for a transient behaviour is given in equation (1).
(1)
Choosing appropriate values for , the geometries of the sensor, three different sensors can be modelled. For
different sensors , the factor changes with the geometry.
The expert system processes the data and detects the presence of cancer, and classifies diseases. Based on the classification process, the expert system also generates control signals to the control unit to diffuse corresponding drug stored, and the feedback system in the control unit constantly monitors the diffusion process. The control unit required to control the drug diffusion pump is modeled and implemented. The expert system and control unit have been integrated and implemented on FPGA to understand the hardware implementation performances of the system. Integrating the diffusion pump with the control logic is not within the scope of this project.
The automated disease detection unit consists of the following blocks:
– Biosensors (hardware model developed using software)
• Disease sensing units with current/voltage output
– Disease analyzer (software/hardware)
• Data base consisting of details of diseases and remedies
– Expert system (hardware/software)
• Disease analyzer and control unit to diffuse the drug as per the disease
– Pump controller (software/hardware)
Cancer Detection and Classification based on DNAFETs
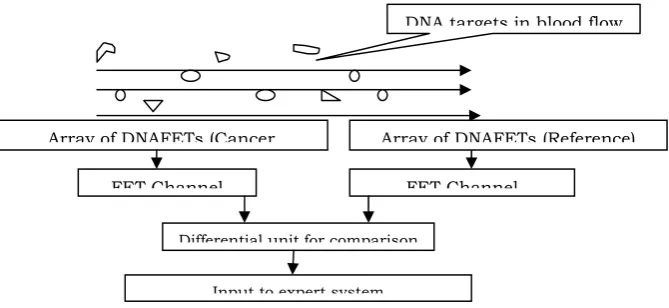
DNAFETs that have been designed, modeled and characterized in the previous chapter have been used in sensing the diseases (cancer detection). Microarrays of DNAFET based sensors are used in detecting cancer cells. DNAFETs that detect are used as sensors which produce voltage levels and are used by the expert system (neural network) in disease detection and classification. DNA molecules (cancer cells or targets) that are present in the blood cells are captured by the DNAFET sensor (probes). Based on the volume of targets captured, the channel in the FET is modulated and current flows in the channel. This current is measured and represents the intensity or ionic concentration of cancer cells. In order to detect the cancer cells (infected DNA cells) present in the blood cells, Comparative Genomic hybridization (CGH) is adopted [27]. CGH is a technique that allows simultaneous monitoring of copy number of thousands of genes throughout the genome. In this technique, DNA fragments from a test sample and a reference sample are hybridized to mapped DNA microarrays. Copy number alterations are related to the intensity ratio of the targets hybridized to each probe on a microarray. Genes with normalized test intensities significantly greater than reference intensities indicate gains in the test sample at those positions. Similarly, significantly lower intensities in the test sample are signs of copy number loss. Figure 5 shows the experimental setup proposed for cancer cell detection. The experimental setup proposed in this work is used in detecting the changes in voltage intensities of sensor outputs using a differential setup.
To measure the performance char of sensor models, matlab based simulink model is developed and the sensors have been characterized for disease detection. This work is published in the Imanager journal[32]
Figure 5 Cancer Cell Detection using DNAFETs (Biosensor)
The reference DNAFET sensor has a fixed reference voltage, the cancer cell detector (DNAFET) detects the presence of infected DNA cells and produces a voltage equivalent to the concentration of impurities. The voltage change is compared and a differential voltage is developed representing the ionic concentration of infected DNA cells. The output of differential unit is captured based on simulation results and are equivalently represented in terms of ion intensity numbers.
With limitations in developing an experimental setup to validate the performances of expert system and integration of expert system with sensor array, in this work a known set of data is taken from FDA-NCI Clinical Proteomics Program Databank (http://home.ccr.cancer. gov/ncifdaproteomics/ppatterns.asp)[28]. High-resolution ovarian cancer data set that was generated using the WCX2 protein array is used as an input to the expert system. Serum proteomic pattern diagnostics can be used to differentiate samples from patients with and without disease. Profile patterns are generated using Surface-Enhanced Laser Desorption and Ionization (SELDI) protein mass spectrometry. This technology has the potential to improve clinical diagnostics tests for cancer pathologies. The goal is to build a classifier that can distinguish between cancer and control patients from the mass spectrometry data. Figure 6 plots the database representing the ion intensity levels for ovarian cancer cells. The models developed in this work are modified versions of Matlab models available in the the Matlab tool box [29].
Array of DNAFETs (Cancer Array of DNAFETs (Reference)
DNA targets in blood flow
FET Channel FET Channel
Differential unit for comparison
Figure 6 Ion Intensity levels of Cancer Cells and Reference Cells Detected
For simplicity it is assumed that the Mass/Charge (Voltage) levels of the DNA cells captured based on the DNAFET biosensors are similar to the data plotted against the ion intensity levels for both the reference and infected cells.
Zooming in on the region from 8500 to 8700 M/Z shows some peaks that might be useful for classifying the data. The numerical numbers representing the ionic concentration of cancer cells are used in detection and classification of disease (cancer) using an expert system discussed in the next section.
Classification, Detection and Analysis of Cancer Cells using Neural Networks
Classification and detection can be performed using various techniques and among them the most prominent are [25]:
– Support Vector Machines – K-Nearest Neighbor Algorithm – Neural Networks
– Classification Trees – Genetic Algorithms
In this research work, Neural Networks and K-Nearest Neighbor Algorithm is selected for intelligent drug diffusion system as they achieve better results in data classification
– Neural Networks – To extract features for training and accuracy – K-Nearest Neighbor – In the feature based classification
The experimentation in this work is carried out using two different methods, in order to estimate the performances of the expert system. The methodology adopted and the results obtained are discussed in this section.
• Experiment Method 1:
– Design and analysis of cancer detection from mass spectrometry protein profiles using neural networks
• Experiment Method 2:
– Design and analysis of cancer detection using principal component analysis and neural networks
Neural Networks for Classification
Artificial neurons were first proposed in 1943 by Warren McCulloch [25], a neurophysiologist, and Walter Pitts. Neural networks are composed of simple elements operating in parallel. These elements are inspired by biological nervous systems. As in nature, the network function is determined largely by the connections between elements. One can train a neural network to perform a particular function by adjusting the values of the connections (weights) between elements. Commonly neural networks are adjusted, or trained, so that a particular input leads to a specific target output. Then the network is adjusted, based on a comparison of the output and the target, until the network output matches the target. Typically many such input/target pairs are used. A network can have several layers. Each
layer has a weight matrix , a bias vector , and an output vector . The use of this layer notation in the three-layer network is shown in Figure 7, along with the equations.
Figure 7 Multiple Layer of Neurons [26]
The network has inputs, neurons in the first layer, neurons in the second layer, etc. It is
common for different layers to have different numbers of neurons. A constant input 1 is fed to the biases for each neuron. As shown, the outputs of each intermediate layer are the inputs to the following layer. Thus layer 2 can be analyzed as a one-layer network with inputs, neurons, and an weight matrix The input to layer
2 is ; the output is . Now that all the vectors and matrices of layer 2, have been identified, it can be treated as a
single-layer network on its own. This approach can be taken with any layer of the network. The layers of a multilayer network play different roles. A layer that produces the network output is called an output layer. All other layers are called hidden layers. The three-layer network shown earlier has one output layer (layer 3) and two hidden layers (layer 1 and layer 2). Multiple-layer networks are quite powerful. A network of two layers, where the first layer is sigmoid and the second layer is linear, can be trained to approximate any function (with a finite number of discontinuities) arbitrarily well. This kind of two-layer network is used extensively in Back propagation. Artificial neural networks (ANN) differ by the type of neurons they are made of and by the manner of their interconnection. There are two major classes of neural networks 1> Feed forward ANNs and 2> The Recurrent ANNs.
Design of Expert System Based on FFANN Architecture
Ovarian cancer data that is used to validate the expert system is obtained from standard data sets and is stored in a directory. The directory consists of two classes of cancer data called as the cancer data and control data. Control data is considered as reference data that is used to train the network to classify the cancer cells accurately. During the training phase the FFANN learns the functionality required and the network weights are identified. Based on the network weights obtained during the training phase, the cancer data is used to validate the functionality of the network. The design of the FFANN architecture is as follows:
The input sets consist of 100 vectors for 216 patients. Input data set is subdivided into 100 samples/frame. As there are more than 10,000 samples captured for each patient, using 10,000 samples and classifying would increase the complexity of the network consuming more time. In order to increase the classification accuracy and to reduce the computation time, the data is subdivided into 100 samples per frame. The training data set is arranged at 100 X 216 matrix representing 100 samples for 216 patients. For every input frame, there is one target output representing whether the patient is normal or abnormal. Every vector consisting of 100 samples is applied to the network that
produces one output. The network consists of inputs, hidden layer and the output layer. The hidden layer weight is 5 X 100. And the number of neurons in the hidden layer is 5. The output layer consists of only one neuron. Thus the weight matrix size is 1 X 5. Once the network is trained to reproduce the target, data samples of 43 patients are randomly chosen from 216 data sets and are used to detect cancer. This helps to test the network performance
Training parameters:
• Input data sets – 100 x 216 • Target set – 1 x 216
• Hidden layer weight – 5 x 100 • Output layer weight – 1 x 5
Test parameters:
• Input data – 100 x 43 • Target data – 1 x 43
Figure 8 shows the FFNN architecture, the network consist of inputs (ion intensities from biosensors), hidden layer and output layer. Cancer cell inputs are applied to the network that classifies the inputs into cancer or non-cancer cells. This classification is achieved based on the network training.
A work on sensor array design for disease detection and classification is carried out and published in inderscience[33]
Bias
Cancer Bias Inputs 1X100
1X1 Classified
W=1X5 output
W=100X256
Figure 8 Feed Forward Network for Classification
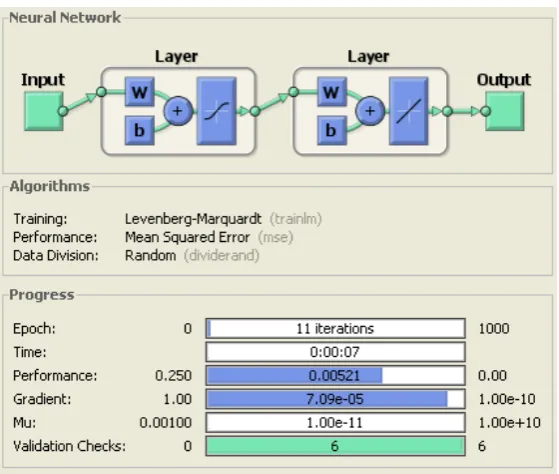
The input data or pattern is fed into the hidden layer, consisting of 5 neurons is multiplied by the weight matrix of size 100 x 216; the output layer consisting of one neuron is multiplied by a weight matrix of 1 x 5. The input applied is classified into cancer or non cancer cells. The output is ‘1’ if the input is cancer and is ‘0’ if the input is non cancer. The training algorithm adopted is Levenberg-Marquardt Back propagation algorithm in which, the network weight is initialized to a random number. The number of iterations is set to 1000 epochs, each epoch consisting of 1000 input patterns. Iteration with higher epoch, the network optimizes the weight matrix for accurate target detection. The performance goal is set to 0.25. This number indicates the total amount of time, number of iterations, and the error number required to reach the target. Figure 9 shows the expert system performances after training. The network converges within 11 iterations and the performance is 0.00521, which is less than the set target, thus proving the speed of FFANN. The hidden layer consists of 5 biases and one transfer function, the output layer consist of 1 bias and one transfer function. Sigmoid transfer function is used in the hidden layer and purely linear function is used in the output layer. It is assumed that the input samples are obtained from sensor array network, and the inputs are fed into the expert system for classification. The output of the expert system is either ‘1’ or ‘0’, which is used to drive the control unit to control the actuation of drug diffusion pump to release the drugs and monitor the flow of drug. The test parameters are used to validate the network performances.
Figure 9 Matlab Model for FFANN
Results and Analysis
The network is trained to correctly classify the data into cancer cells and normal cells. Based on optimum weight and bias values obtained after successful training the network is tested for its performance with new sets on input data. Every classification algorithm using the neural network is characterized for the classification of cells into:
• Cancers cells as cancer -> detections • Normal as normal –> false positives • Cancer cells as normal ->false alarm • Normal cells as cancer -> true positives
After training the network by considering 216 input patterns, 43 input patters that are not part of the training data set are used in validating the performances of the network. Figure 10 shows the training procedure for the network. In this, the network weight matrix and bias elements are updated until the network converges to the required output. Weights and biases that accurately classify the input samples are obtained at the end of convergence and are shown in figure 10.
Figure 10 Network Training and Weight Matrix
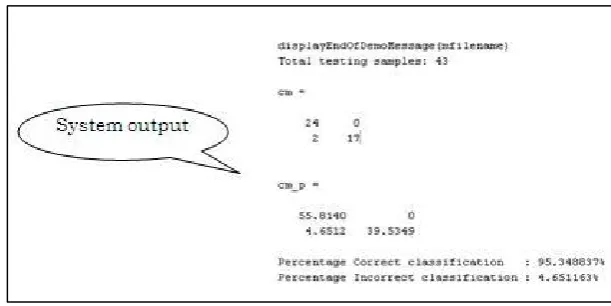
optimum weight matrix obtained during training is used to classify the input patterns. Figure 11 shows the results of the network obtained during validation phase.
Figure 11 Network Test Result
From the test results as shown in Figure 11 the network is capable of accurately classifying the input samples and achieves 95.34% accuracy. Out of 43 input test samples, the network detects all 24 cancer samples correctly. Network performance: 95.34%, Network error: 4.65%. In these analysis 216 patients mass spectrometry data is collected, each patient’s data consists of 15000 ion intensity mass charge values. The summary of the results obtained are as follows:
• Features are extracted using neural network architecture and classified
• Feed forward neural network architecture is trained on all the input samples to classify the data sets • 43 test samples are used to test the network
– 24 sets of cancer data – 19 normal data • Network performance:
– Correct classification : 95.34% – Incorrect classification : 4.65%
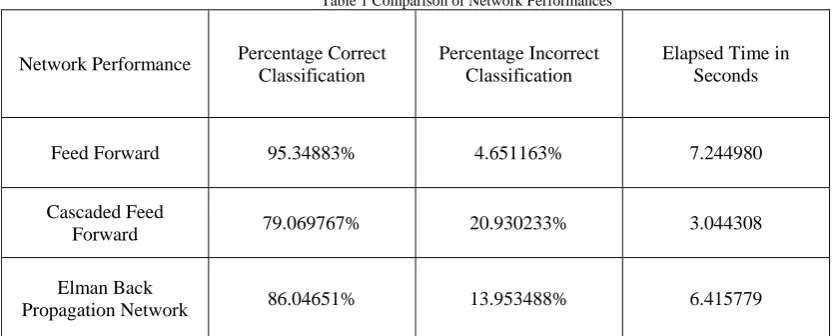
Table 1 Comparison of Network Performances
Network Performance Percentage Correct Classification
Percentage Incorrect Classification
Elapsed Time in Seconds
Feed Forward 95.34883% 4.651163% 7.244980
Cascaded Feed
Forward 79.069767% 20.930233% 3.044308
Elman Back
Propagation Network 86.04651% 13.953488% 6.415779
From the analysis carried out and presented, it is found that the FFANN performance is better than the other two network performances. The total time taken is more than the other two networks, as reliability and accuracy are given the higher priorities, FANN is selected. However, the FFANN incorrectly classifies the input 4.5% times, thus for automated drug delivery unit, this has to be minimized. Hence in order to increase the network performance network architecture should be enhanced. A modified method is proposed and is discussed in next section based on Principal Component Analysis.
Performance Improvement of Classification Algorithm
From the previous analysis carried out the following are the observations made: – Each patient has 15000 ion intensity mass-charge values – Limitations:
• Training the network to recognize all these intensities would consume time and would be a slow process
• Accuracy due to network behaviour
– Network is prone to error due to large sets of redundant data
In order to overcome the limitations, it is required to reduce the feature set size, as this would improve the size of the network architecture and also would enhance the classification efficiency. Thus the modified method is to first extract features from the input data pattern and use them for classification. Thus with reduced data set and use of very important feature set, the network efficiency is increased. From the feature set, use only the region of interest for classification can be used.
Efficient Algorithm for Cancer Cell Classification and Detection
Figure 12 Classification Algorithm Flow Chart Based on LDA and PCA Technique
Input data is first visually represented and observations are made on the graphical representation. From the data set, the mean value of the data set and the envelope of the data are computed. Feature extraction is carried out using LDA technique and PCA components are extracted. Using the PCA components classification is performed.
Performance of Modified Expert System
From the results obtained, it is found that the PCA based technique classifies accurately up to 97.67% compared to the earlier technique which was classifying the same data pattern correctly up to 94%, thereby achieving an improvement of more than 4%.
Summary of results obtained
Best average correctness rate is 98% (95% previous technique only neural network) • 10 best features are extracted
From the results obtained, the following are the conclusions drawn: • Cancer data sets were preprocessed and used for classification • Automated techniques are developed for detection of diseases (cancer)
– NN approaches were used for detection and classification – NN approaches achieved 95% correctness
– PCA with LDA approach adopted for detection and classification – PCA with LDA approach achieved 98% correctness
Based on the disease detected and classified, the expert system drives the drug diffusion unit for drug delivery. Output of detection unit is interfaced with drug delivery unit. It is assumed that the actuator that controls the drug storage unit to deliver the drug is available, only the control unit that is required to trigger the actuator is to be designed. The control unit plays a vital role, as the cancer cells gets detected, the control units need to respond immediately to trigger the actuator. Transient and steady state response for the control unit are very critical parameters. A PID controller is designed to drive the motors that diffuse the drug. The control logic developed is used in drug selection. The actuators are triggered based on the control logic that not only selects the drug but also drives the motors to diffuse appropriate drug.
Conclusion
Automated disease detection and drug delivery unit that can be used for detection and monitoring of cancer is proposed, designed, modeled and implemented in this work. For the first time, a software reference model for the complete unit as a system is developed and analyzed for its functionality. An exhaustive literature review on various diseases and remedies to cure the diseases is carried out. The procedures and methods adopted by doctors to detect
Start
Data initialization
Data plotting and observation Mean and envelope Computation
Data plotting and observation Identification of significant Features using LDA (blind classification) Performance analysis of Blind classification Technique Performance Improvement using Regional information
and diagnose patients with diseases are explored. Challenges in disease diagnosis is identified and reported in this work. It is found that with the growth in population and with changes in environmental conditions human race is prone to various diseases. With shortage of medical practioners and doctors there is an immediate need for alternate solutions to cater to the needs of the common man. Thus with the technological advances in the areas of medical electronics, nanotechnology and VLSI technology, there is a need for a sophisticated, reliable and accurate system that automatically monitors the human behaviour and detects diseases in human beings. In this research work, an effort is taken up to develop an automated disease detection and drug delivery unit that can be used to detect diseases and monitor the diseases. Based on the mathematical models developed for the nanowire and nanowire based sensor array for cancer detection, an expert system based on neural network is proposed to detect and classify cancer. In order to validate the performances of the expert system, ovarian cancer is selected. Known set of data for ovarian cancer analysis is used for validation. The expert system is trained using known set of data samples and optimum weights for the classification problem are identified. Unknown data sets are used to identify the network performances. The network model developed using feed forward architecture classifies the test data correctly by 95%, and has an error of 4%. In order to further enhance the performances of the system, a modified technique based on Linear Discriminant Analysis (LDA) and Principal Component analysis (PCA) is modelled. In this method, from the data sets, features are extracted, and significant features are identified by performing PCA. Based on the PCA components identified, the network is trained. Optimum weights are identified during the training phase using the significant factors. The performances of the network are identified to increase from 95% to 98% times correctly classifying the input data sets. A PID control logic interfaced at the output of the expert system controls the drug diffusion unit based on the decision made at the expert system. The control logic considers the weight, height and age factor of the patient, identifies appropriate quantity of drug required to be diffused and monitor the process.
References
[1] Top 10 Incurable Diseases, 4 October 2007, http://listverse.com/2007/10/04/top-10-incurable-disea ses/ [2] Treatable diseases, http://www.cryobanksindia.com/ treatable-diseases.html
[3] Professor Nicholas White, OBE, University of Oxford, Plagues and Parasites, http:// royalsociety. org/ Event. aspx?id=2084&
gclid=CO3shLSm7KgCFQd66wodgk3hCw
[4] Milder IE, Klungel OH, Mantel-Teeuwisse AK, Verschuren WM,Bemelmans WJ., Relation between body mass index, physical inactivity and use of prescription drugs: the Doetinchem Cohort Study, Int J Obes (Lond). 2010 Jun;34(6):1060-9. Epub 2010 Feb 2
[5] Stress From Prostate Cancer Diagnosis May Be Fatal, Dec 2009, http://www.drugs.com/news/stress-prostate-cancer-diagnosis-m ay-fatal-21509.html
[6] Buyukozturk F, Benneyan JC, Carrier RL, Impact of emulsion-based drug delivery systems on intestinal permeability and drug release kinetics, J Control Release. 2010 Feb 25;142(1):22-30. Epub 2009 Oct 20.
[7] Side effects of cancer drugs, http://www. cancerhelp.Org .uk/about-cancer/treatment/cancer-drugs/ side-effects/ [8] Treatments and Side effects,http://www.cancer.org/Treat ment/ Treatments and Side Effects/index
[9] Cancer side effects, http://www.drugs.com/cancer.html
[10] Cancer Chemotherapy, http://www.nlm.nih. gov/medline plus /cancerchemotherapy.html
[11] M. Staples, K. Daniel, M. J. Cima, and R. Langer, "Application of micro- and nano-electromechanical devices to drugdelivery” Pharmaceutical Research, vol. 23, pp. 847- 863, 2006.
[12] Henderson, C.; Patek, A. The relationship between prognostic and predictive factors in the management of breast cancer. Breast Cancer Res. Treat. 1998, 52, 261-288
[13] Molina, R.; Auge, J.; Escudero, J.; Marrades, R.; Vinolas, N.; Carcereny, E.; Ramirez, J.; Filella, X. Mucins CA 125, CA 19.9, CA 15.3 and TAG-72.3 as tumor markers in patients with lung cancer: comparison with CYFRA 21-1, CEA, SCC and NSE. Tumor Biol. 2008, 29, 371-380.
[14] Ramgir, N.S.; Zajac, A.; Sekhar, P.K.; Lee, L.; Zhukov, T.A.; Bhansali, S. Voltammetric detection of cancer biomarkers exemplified by interleukin-10 and osteopontin with silica nanowires. J. Phys. Chem. C. 2007, 111, 13981-13987; DOI 10.1021/jp073371b.
[15] Wang, J.; Liu, G.; Wu, H.; Lin, Y. Quantum-dot-based electrochemical immunoassay for high-throughput screening of the prostate-specific antigen. Small 2007, 4, 82-86.
[16] Pietryga, J.; Schaller, R.; Werder, D.; Stewart, M.; Klimov, V.; Hollingsworth, J. Pushing the band gap envelope: mid-infrared emitting colloidal PbSe quantum dots. J. Am. Chem. Soc. 2004, 126, 11752-11753.
[17] Huang, X.; El-Sayed, I.; Qian, W.; El-Sayed, M. Cancer cell imaging and photothermal therapy in the near-infrared region by using gold nanorods. J. Am. Chem. Soc. 2006, 128, 2115-2120.
[18] K.J. Astrom and T.Hagglund. PID Controllers, 2nd ed., Instrument Society of America, 1995. [19] Arbib, Michael A. (Ed.) (1995). The Handbook of Brain Theory and Neural Networks. [20] Alspector, U.S. Patent 4,874,963 "Neuromorphic learning networks". October 17, 1989.
[21] L. Chua and L. Yang, "Cellular Neural Networks: Theory," IEEE Trans. on Circuits and Systems, 35(10):1257-1272, 1988.
[22] Pearson, K. (1901). "On Lines and Planes of Closest Fit to Systems of Points in Space" (PDF). Philosophical Magazine 2(6):559– 572.http://stat.smmu.edu.cn/history/pearson 1 01.pdf.
[23] Jolliffe I.T. Principal Component Analysis, Series: Springer Series in Statistics, 2nd ed., Springer, NY, 2002, XXIX, 487 p. 28 illus. ISBN 978-0-387-95442-4
[24] Ang, K.H., Chong, G.C.Y., and Li, Y. (2005). PID control system analysis, design, and technology, IEEE Trans Control Systems Tech, 13(4), pp.559-576. http://eprints. gla.ac.uk/3817/
[28] L. Chua and L. Yang, "Cellular Neural Networks: Theory," IEEE Trans. on Circuits and Systems, 35(10):1257-1272, 1988.
[29] Pearson, K. (1901). "On Lines and Planes of Closest Fit to Systems of Points in Space" (PDF). Philosophical Magazine 2(6):559– 572.http://stat.smmu.edu.cn/history/pearson 1 01.pdf.
[30] Thakur ML, Devadhas D, Zhang K et al.: Imaging spontaneous MMTVneu transgenic murine mammary tumors: targeting metabolic activity versus genetic products. J. Nucl. Med. 51(1), 106–111 (2009).
[31] Newman JD, Warner PJ, Turner APF, Tigwell LJ. Biosensors: A Clearer View. UK: Cranfield University; 2004;p216.
[32] S.M.Ushaa, Dr.Madhavilatha, Prof. Madhusudhana Rao Ganji. - “Development and validation of Matlab models for nanowire sensors for disease detection” i-manager’s Journal on Future Engineering & Technology, Vol. 6 l No. 2 l November 2010 - January 2011

![Figure 3. Nanosensor Array and DNA sensor [23]](https://thumb-us.123doks.com/thumbv2/123dok_us/9663292.1494172/3.595.162.436.382.499/figure-nanosensor-array-and-dna-sensor.webp)
![Figure 4 DNA Strand and Sensor Response Time [23]](https://thumb-us.123doks.com/thumbv2/123dok_us/9663292.1494172/4.595.141.457.106.358/figure-dna-strand-and-sensor-response-time.webp)

![Figure 7 Multiple Layer of Neurons [26]](https://thumb-us.123doks.com/thumbv2/123dok_us/9663292.1494172/7.595.110.488.133.382/figure-multiple-layer-of-neurons.webp)