University of New Hampshire Scholars' Repository
Geography Scholarship
Geography
5-2014
Validation of Satellite Rainfall Products for Western
Uganda.
Jeremy E. Diem
Georgia State UniversityJoel N. Hartter
University of New Hampshire, joel.hartter@unh.edu
Sadie J. Ryan
State University of New York Syracuse
Michael W. Palace
University of New Hampshire - Main Campus
Follow this and additional works at:
https://scholars.unh.edu/geog_facpub
Part of the
Physical and Environmental Geography Commons
This Article is brought to you for free and open access by the Geography at University of New Hampshire Scholars' Repository. It has been accepted for inclusion in Geography Scholarship by an authorized administrator of University of New Hampshire Scholars' Repository. For more information, please contactnicole.hentz@unh.edu.
Recommended Citation
Validation of Satellite Rainfall Products for Western Uganda
JEREMYE. DIEM
Department of Geosciences, Georgia State University, Atlanta, Georgia
JOELHARTTER
Environmental Studies Program, University of Colorado Boulder, Boulder, Colorado
SADIEJ. RYAN
Department of Environmental and Forest Biology, State University of New York College of Environmental Science and Forestry, Syracuse, New York
MICHAELW. PALACE
Earth Systems Research Center, Institute for the Study of Earth, Oceans, and Space, University of New Hampshire, Durham, New Hampshire
(Manuscript received 25 November 2013, in final form 29 May 2014)
ABSTRACT
Central equatorial Africa is deficient in long-term, ground-based measurements of rainfall; therefore, the aim of this study is to assess the accuracy of three high-resolution, satellite-based rainfall products in western Uganda for the 2001–10 period. The three products are African Rainfall Climatology, version 2 (ARC2); African Rainfall Estimation Algorithm, version 2 (RFE2); and 3B42 from the Tropical Rainfall Measuring Mission, version 7 (i.e., 3B42v7). Daily rainfall totals from six gauges were used to assess the accuracy of satellite-based rainfall estimates of rainfall days, daily rainfall totals, 10-day rainfall totals, monthly rainfall totals, and seasonal rainfall totals. The northern stations had a mean annual rainfall total of 1390 mm, while the southern stations had a mean annual rainfall total of 900 mm. 3B42v7 was the only product that did not underestimate boreal-summer rainfall at the northern stations, which had;3 times as much rainfall during boreal summer than did the southern stations. The three products tended to overestimate rainfall days at all stations and were borderline satisfactory at identifying rainfall days at the northern stations; the products did not perform satisfactorily at the southern stations. At the northern stations, 3B42v7 performed satisfactorily at estimating monthly and seasonal rainfall totals, ARC2 was only satisfactory at estimating seasonal rainfall totals, and RFE2 did not perform satisfactorily at any time step. The satellite products performed worst at the two stations located in rain shadows, and 3B42v7 had sub-stantial overestimates at those stations.
1. Introduction
Central equatorial Africa is in need of rainfall data. It is a region with no definitive ground-based information on long-term trends in rainfall (Todd and Washington 2004;Trenberth et al. 2007), and modeling studies have
shown that rainfall in the region should decrease not only from an increase in carbonaceous aerosols from biomass burning in tropical Africa (Tosca et al. 2013) but also from a warming of the equatorial Indian Ocean (Hoerling et al. 2006). On the eastern edge of this region is the Albertine Rift, whichPlumptre at al. (2007)define as a region extending from 30 km north of Lake Albert to the southern tip of Lake Tanganyika, including the valley, the flanks of the escarpment and associated protected areas, and the range of endemic species (Fig. 1). The Albertine Rift is a biodiversity
Corresponding author address:Jeremy E. Diem, Department of Geosciences, Georgia State University, P.O. Box 4105, Atlanta, GA 30302.
E-mail: jdiem@gsu.edu
DOI: 10.1175/JHM-D-13-0193.1
hotspot (Cordeiro et al. 2007; Plumptre et al. 2007) with some of Africa’s fastest growing human pop-ulations (Fisher and Christopher 2007). Particularly in Uganda, where 80% of the land is used for rain-fed farming and the population growth rate is the second fastest in the world (Uganda Bureau of Statistics 2009; Population Reference Bureau 2012), the juxtaposi-tion between biodiversity conservajuxtaposi-tion and land-use intensification challenges local livelihoods. A lack of consistent, long-term rainfall data from ground-based gauges in the region makes rainfall studies very difficult (e.g.,Kizza et al. 2009;Stampone et al. 2011;Hartter et al. 2012).
Therefore, the aim of this study is to assess the accuracy of three high-resolution satellite-based rainfall products for the Uganda portion of the Albertine Rift from 2001 to 2010. The products are the recently completed African Rainfall Climatology, version 2 (ARC2); African Rain-fall Estimation Algorithm, version 2 (RFE2); and the 3B42 product of the Tropical Rainfall Measuring Mis-sion (TRMM), verMis-sion 7 (3B42v7). ARC2 extends back to 1983 and is expected to be homogeneous over time; consequently, it might be useful for assessing rainfall trends (Novella and Thiaw 2013). RFE2 and 3B42 are included in the analysis because these products have been found to be the most accurate satellite-based rainfall
products for various river basins in tropical Africa (Thiemig et al. 2012).
2. Data and methods
a. Ground-measured rainfall data
Daily rainfall data from 2001 to 2010 were obtained for six rainfall stations (Gulu, Masindi, Ngogo, Kasese, Mweya, and Bwindi) within and proximate to the Uganda portion of the Albertine Rift (Fig. 1). As rain gauges are rare in western Uganda and records from gauges in the region are typically old and discontinued or new with only several years of quality data, it is remarkable that daily rainfall data were available from multiple stations in the region over the most recent decade. The 10-yr length of the dataset enables it to capture a robust amount of the vari-ability of daily rainfall in the region. All rainfall measure-ments were made at 0500 or 0600 UTC. Data for Gulu, Masindi, and Kasese were acquired directly from the Uganda Department of Meteorology, Kampala. Data for Ngogo, located inside Kibale National Park, were collected by Drs. Jeremiah Lwanga, David Watts, and John Mitani of the Ngogo Chimpanzee Project. Data for Mweya, loc-ated in Queen Elizabeth National Park, were collected by the Uganda Wildlife Authority. Data for Bwindi, located in Bwindi Impenetrable National Park, were collected by the Institute of Tropical Forest Conservation.
Only one of the stations, Ngogo, was not missing any daily rainfall totals. Gulu, Masindi, Kasese, Mweya, and Bwindi were missing 3.4%, 5.8%, 1.7%, 18.3%, and 23.8% of the daily rainfall totals, respectively. With the exception of Bwindi, the missing data were restricted to only several months per station. Gulu was missing all daily totals for March 2002, September 2004, December 2007, and August 2008. Masindi was missing all daily totals for February 2004, May 2004, November 2005, September 2007, and September–November 2009. Kasese was missing all daily totals for October 2005 and November 2008. Mweya was missing daily totals for all of 2001 and January–October 2002. Bwindi was missing one or more days of data during a majority of the months in the dataset, and months with no rainfall totals in-cluded August–December 2005, August–December 2006, January–February 2007, May–October 2007, and January–February 2009.
b. Satellite rainfall products
Gridded rainfall estimates for 2001–10 from ARC2, RFE2, and 3B42v7 were obtained from the International Research Institute for Climate and Society at Columbia University and were compared with the gauge-measured totals using the point-to-pixel approach. The ARC2 and
RFE2 data, which are daily and pertain to 0600–0600 UTC, only apply to the African continent and have a spa-tial resolution of 0.108. ARC2 and RFE2 are developed by the Climate Prediction Center of the National Oceanic and Atmospheric Administration (NOAA) for the Fam-ine Early Warning Systems Network (FEWS NET). RFE2 data are produced from Global Telecommunication Sys-tem (GTS) rain gauge reports, geostationary satellite thermal infrared data, and data from the Special Sensor Microwave Imager and Advanced Microwave Sounding Unit onboard polar-orbiting satellites, while ARC2 data are produced only from GTS gauge data and thermal in-frared data (Love et al. 2004;Novella and Thiaw 2013). The 3B42v7 data have a spatial resolution of 0.258, and the 3-hourly resolution of the data enabled the production of daily estimates pertaining to 0600–0600 UTC, thereby matching the ARC2 and RFE2 data. The 3B42v7 data, which are developed by the National Aeronautics and Space Administration, are produced from geostationary satellite thermal infrared data, precipitation-related pas-sive microwave data collected by sensors on board a vari-ety of satellites, and the TRMM Combined Instrument estimate, which employs data from both the microwave imager and precipitation radar instruments on board the TRMM satellite; the merged microwave and infrared es-timates are adjusted based on analyses of monthly rainfall totals from the Global Precipitation Climatology Centre rain gauge database (Huffman et al. 2007).
c. Accuracy assessment
1) ASSESSMENT OF RAINFALL DAYS
False alarm ratio (FAR), probability of detection (POD), frequency bias (FB), and Heidke skill score (HSS) were used to assess the accuracy of the satellite products in identifying rainfall days (i.e., days with$1 mm). FAR, POD, FB, and HSS were calculated as follows:
FAR5 B
A1B, (1)
POD5 A
A1C, (2)
FB5A1B
A1C, and (3)
HSS5 2(AD2BC)
(A1C)(C1D)1(A1B)(B1D). (4)
by the satellite product. FB, which ranges from 0 to‘, compares the rainfall-day detection frequency of the satellite estimates with that of the rain gauge: an FB less than (greater than) one indicates an underestimation (overestimation) of rainfall days. HSS, which ranges from 2‘to 1, is a measure of the overall skill of the rainfall-day estimates accounting for matches due to random chance: an HSS less than zero indicates that random chance is better than the satellite product, an HSS of zero means the product has no skill, and an HSS of one indicates a perfect estimation of rainfall days by the product.
2) ASSESSMENT OF RAINFALL TOTALS
Error statistics were calculated for daily, 10-day, monthly, and seasonal rainfall totals. Rainfall totals for periods with at least 90% of days with nonmissing rainfall totals were upwardly adjusted to represent 100% of the days. This adjustment was done to increase the sample sizes at Bwindi, which was the only station with missing days that did not always constitute entire months. Percent biasPBIASand the Nash–Sutcliffe coefficient of efficiency
Ewere calculated at the three time steps as follows:
PBIAS5100 1
N
å
(S2G)G (5)
and
E512
å
(G2S)2
å
(G2G)2. (6)VariableGis a rainfall total at a gauge,Gis the mean observed rainfall total at a gauge,Sis a rainfall total for a satellite product, andNis the number of data pairs. The average tendency of estimated totals to be larger or smaller than the observed totals is given byPBIAS. In this
paper, a positive (negative)PBIASindicates overestimation
(underestimation), andEranges from2‘to 1, with higher values indicating better agreement between observations and estimates (Nash and Sutcliffe 1970; Legates and McCabe 1999). In the case of the satellite-based rainfall products, negative E values indicate that the mean ob-served value (i.e., the null model) is a better estimate for all cases than are the estimated values from a product, while a value of zero indicates that the product is only as accurate as the null model (Legates and McCabe 1999;Moriasi et al.
2007). Correlation coefficients were not used in the rainfall totals assessment, because coefficients can be large even if the observations and predictions differ considerably in magnitude and variability (Legates and McCabe 1999).
3) CALCULATION OF ALTERNATIVE ERROR VALUES ATGTSSTATIONS
Alternative values of FAR, POD, FB, HSS,PBIAS, and
Ewere calculated for ARC2 and RFE2 at the GTS sta-tions only using days where data at those stasta-tions were not used in the creation of the daily ARC2 and RFE2 data. Gulu, Masindi, and Kasese are listed as GTS sta-tions by NOAA and thus may have had ARC2 and RFE2 rainfall estimates that were less independent of observed rainfall totals than were rainfall totals at Ngogo, Mweya, and Bwindi. Nonreporting days (i.e., days where a 24-h rainfall total was not reported at 0600 UTC) were iden-tified using NOAA’s Global Surface Hourly dataset, and the percentage of nonreporting days at Gulu, Masindi, and Kasese were 83%, 85%, and 81%, respectively. Re-porting days at those stations were biased toward rainfall days: 65%, 70%, and 58% of the reporting days were rainfall days at Gulu, Masindi, and Kasese, respectively, despite just 35%, 33%, and 29% of all days being rainfall days at those respective stations. Therefore, to eliminate the associated bias toward nonrainfall days among the nonreporting days, 489, 591, and 715 nonrainfall days at Gulu, Masindi, and Kasese, respectively, were selected randomly and removed from the sample of nonrainfall days used to calculate the alternative values of FAR, POD, FB, HSS,PBIAS, andE.
3. Results and discussion
a. Mean annual, seasonal, and monthly rainfall totals
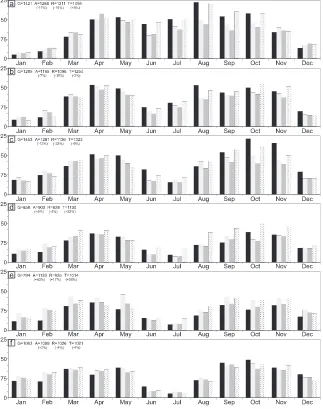
Annual rainfall totals and intra-annual behavior of rainfall differed markedly between the northern and southern stations (Fig. 2). The northern stations (i.e., Gulu, Masindi, and Ngogo) had a mean annual rainfall total of 1390 mm, while the southern stations (i.e., Kasese, Mweya, and Bwindi) had a mean annual rainfall total of 900 mm. Kasese and Mweya had rainfall totals less than 900 mm, and these relatively low rainfall totals are most likely due to rain shadows (Bahati et al. 2005;Orlove et al. 2010): the stations are at relatively low elevations (i.e., ,1000 m MSL) in the rift valley and are thus thousands of meters lower than the peaks of the nearby Rwenzori Mountains and the western escarpment of the Albertine Rift on the western side of Lake Edward (Figs. 1and2). All stations had rainfall controlled strongly by the intertropical convergence zone (Nicholson 1996), with rainy seasons typically occurring during boreal
TABLE1. Contingency table for comparing rain gauge measurements and satellite-based rainfall estimates.
Gauge$1 mm Gauge,1 mm
Satellite$1 mm A B
spring and autumn (Basalirwa 1995;Hartter et al. 2012). The main difference in intra-annual rainfall between the northern and southern stations was that the northern stations had nearly 3 times more rainfall during boreal summer than did the southern stations. Therefore, rain-fall at the northern stations was more similar to rainrain-fall in central Africa (i.e., Democratic Republic of the Congo) than in East Africa (e.g.,Nicholson 2000;Herrmann and Mohr 2011;Liebmann et al. 2012).
All products estimated mean monthly and annual rainfall totals reasonably well (Fig. 2). The products ten-ded to underestimate rainfall at the wetter stations and overestimate rainfall at the drier stations. In addition,
3B42v7 did not underestimate boreal-summer rainfall at the northern stations like ARC2 and RFE2 did.
b. Rainfall-day errors
All three products had at least 30% of the identified rainfall days as false alarms, and the products rarely cor-rectly identified more than 80% of the observed rainfall days (Table 2). As should be expected when up to 19% of the days at the GTS stations were reporting days, alter-native FAR values at Gulu, Masindi, and Kasese were slightly higher than the original values, and alternative POD values were slightly lower than the original values. All three products had the smallest FAR values at Gulu
and Ngogo. RFE2 had the highest FAR values, and that was associated with the highest POD values. FAR values were extremely high (e.g., $0.60) at Mweya for all products.
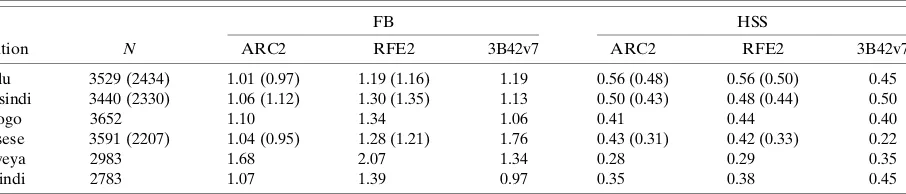
All three products tended to overestimate rainfall days at all stations (Table 3). ARC2 and RFE2 had the lowest and highest bias, respectively, among the three products. The largest overestimates occurred at Mweya for ARC2 and RFE2 and at Kasese for 3B42v7: the FB values equaled or exceeded 1.68. Those overestimates were connected to relatively large FAR values (Table 2).
There was little difference in HSS values among the three products (Table 3). The HSS values among the products and stations ranged from 0.22 to 0.50, and all values for the northern stations equaled or exceeded 0.40. All three products performed worst at either Kasese or Mweya.
The original HSS values at all three GTS stations were inflated, just as the original POD values also were inflated and the original FAR values were deflated (Table 3). Alternative HSS values equaled or exceeded 0.43 at Gulu and Masindi and ranged from 0.31 to 0.33 at Kasese. Alternative HSS values for ARC2 at Gulu, Masindi, and Kasese were 0.08, 0.07, and 0.12 lower, respectively, than the original values, and the values for RFE2 were 0.06, 0.04, and 0.09, lower, respectively. HSS values decreased the most at Kasese for two reasons: Kasese had a higher percentage of reporting days than did the other two GTS stations, and it was more difficult for the satellite products to identify rainfall days at Kasese compared to the northern stations.
c. Rainfall total errors
There were large differences in PBIAS among the
products and the stations (Tables 4and5). As one might expect,PBIASdid not change appreciably with an increase
in time step (i.e., from daily to seasonal totals). 3B42v7 was by far the least biased product at the northern sta-tions, withPBIASranging from29% to 6%. ARC2 and
RFE2 underestimated rainfall totals at all northern sta-tions, and underestimates at Gulu and Masindi by ARC2
and RFE2 were even larger when reporting days were excluded from the analysis. Therefore, the most valid
PBIASvalues at the northern stations ranged from217%
to212% for ARC2 and approximately223% for RFE2. 3B42v7 greatly overestimated rainfall totals at Kasese (i.e.,
PBIASvalues equaled or exceeded 30%). ARC2 and RFE2
actually had underestimates at Kasese (Table 4); adjusted
PBIASfor ARC2 and RFE2 were 12%–13% lower than
the original values. All three products, especially ARC2, greatly overestimated rainfall totals at Mweya: PBIAS
values ranged from 16% to 43%. Finally, there was mini-mal bias at Bwindi, the southernmost station.
The products in general were more accurate at esti-mating rainfall totals at the northern stations compared to the southern stations (Tables 4and5). TheEvalues for all three products tended to increase with an in-crease in time step, and this has been observed in other studies (e.g., Cohen Liechti et al. 2012). Product 3B42v7 was superior to ARC2 and RFE2 at estimating rainfall totals at the northern stations. For example, seasonalEvalues for 3B42v7 at the northern stations approached or exceeded 0.70. Alternative daily E
values for ARC2 at Gulu and Masindi were 0.15 and 0.07 lower, respectively, than the original, biased values. Therefore, valid seasonalEvalues for ARC2 at Gulu and Masindi were probably around 0.50, which was equivalent to the E value at Ngogo. The corre-sponding values for RFE2 were slightly lower. The al-ternative dailyEvalues for RFE2 at Gulu and Masindi were 0.17 and 0.07 lower, respectively, than the original values; thus, the valid seasonal E values were most likely lower than the Evalues for ARC2. Kasese and Mweya had the smallest seasonalEvalues, with none of the values exceeding 0.33. The alternative daily E
values for ARC2 and RFE2 at Kasese were 0.14 and 0.18 lower, respectively, than the original values. Therefore, RFE2 may have had the largest seasonalE
value at Kasese, but it probably did not exceed 0.30. All three products had relatively high seasonalEvalues at Bwindi, but the relatively low sample size (i.e., 20) re-duces the robustness of the results.
TABLE2. FAR and POD for ARC2, RFE2, and 3B42v7 at the six stations over the 2001–10 period. The number of days isN. The values in parentheses for ARC2 and RFE2 at the GTS stations (i.e., Gulu, Masindi, and Kasese) were calculated using only the nonreporting days at those stations.
FAR POD
Station N ARC2 RFE2 3B42v7 ARC2 RFE2 3B42v7
Gulu 3529 (2434) 0.29 (0.33) 0.33 (0.36) 0.33 0.72 (0.65) 0.79 (0.75) 0.79 Masindi 3440 (2330) 0.35 (0.40) 0.40 (0.43) 0.36 0.69 (0.67) 0.78 (0.77) 0.72
Ngogo 3652 0.37 0.39 0.32 0.69 0.81 0.72
Kasese 3591 (2207) 0.42 (0.48) 0.46 (0.50) 0.60 0.61 (0.49) 0.69 (0.60) 0.70
Mweya 2983 0.60 0.61 0.63 0.67 0.81 0.53
d. Overall performance of the products
3B42v7 and ARC2 were the two best products at the northern stations, and RFE2 was the most versatile product throughout the entire study region. Following the performance ratings for watershed models described in Moriasi et al. (2007), a product in this study had a satis-factory performance if thePBIASwas between
approxi-mately220% and 20% and theEvalue was greater than 0.50. None of the products performed satisfactorily at estimating daily and 10-day rainfall totals at any of the stations and estimating monthly and seasonal rainfall totals at the southern stations. Only 3B42v7 performed satisfactorily at estimating both monthly and seasonal rainfall totals at all northern stations. ARC2 likely per-formed satisfactorily at estimating seasonal rainfall totals at all three northern stations. RFE2 did not perform satisfactorily at any of the stations; nevertheless, it also did not perform poorly at the seasonal scale at any of the stations. All three products might have performed satis-factorily at the seasonal scale at Bwindi; however, data for more years are needed to determine this. Finally, since HSS andEhave the same upper and lower bounds, an HSS exceeding 0.50 might be a reasonable expectation for satisfactory performance by a product. Therefore, the three products are borderline satisfactory at identifying rainfall days at the northern stations and unsatisfactory at the southern stations, with the possible exception of Bwindi.
The satellite products performed the best at stations with the least complex topography and the worst at stations that appear to be affected by nearby mountains. Gulu, Masindi, and Ngogo have much less complex landscapes than do Kasese, Mweya, and Bwindi.Dinku et al. (2008)note that the relatively flat landscape of Zimbabwe contributes to the better performance of rainfall products there com-pared to the Ethiopian highlands. As noted earlier, both Kasese and Mweya have relatively low rainfall totals due to rain shadows; the stations are located in the rift valley, and Mweya is surrounded by mountainous terrain (Fig. 1).
The locations of Kasese and Mweya in rain shadows caused all three products to perform unsatisfactorily at those sta-tions. The products struggled to either identify rainfall days or estimate rainfall totals or both at Kasese and Mweya. And the large overestimation of rainfall by 3B42v7 also has been observed for the 3B42 product in other rain-shadow regions (Nair et al. 2009). Therefore, the products also are likely to perform unsatisfactorily in other anticipated rain-shadow areas in the northern portion of the Albertine Rift, including Lake Edward and Lake Albert and nearby low-elevation areas.
Previous research (Dinku et al. 2007, 2008, 2011) shows that nearly every rainfall product, including ARC, RFE2, and 3B42, underestimates rainfall in the high-lands of Ethiopia, where the warm orographic rain process dominates. The products did not underestimate rainfall at Bwindi, which is located at 2355 m MSL in the
TABLE3. FB and HSS for ARC2, RFE2, and 3B42v7 at the six stations over the 2001–10 period. The number of days isN. The values in parentheses for ARC2 and RFE2 at the GTS stations (i.e., Gulu, Masindi, and Kasese) were calculated using only nonreporting days at those stations.
FB HSS
Station N ARC2 RFE2 3B42v7 ARC2 RFE2 3B42v7
Gulu 3529 (2434) 1.01 (0.97) 1.19 (1.16) 1.19 0.56 (0.48) 0.56 (0.50) 0.45 Masindi 3440 (2330) 1.06 (1.12) 1.30 (1.35) 1.13 0.50 (0.43) 0.48 (0.44) 0.50
Ngogo 3652 1.10 1.34 1.06 0.41 0.44 0.40
Kasese 3591 (2207) 1.04 (0.95) 1.28 (1.21) 1.76 0.43 (0.31) 0.42 (0.33) 0.22
Mweya 2983 1.68 2.07 1.34 0.28 0.29 0.35
Bwindi 2783 1.07 1.39 0.97 0.35 0.38 0.45
TABLE4. Evaluation statistics at the six rainfall stations over 2001–10 for daily rainfall totals. The sample size isN. Positive (negative)PBIAS(%) are overestimates (underestimates). The
coefficient of efficiency between observed totals and predicted totals isE.
Product N PBIAS E
Gulu ARC2 3529 (2434) 211 (217) 0.17 (0.02) RFE2 3529 (2434) 215 (223) 0.23 (0.06)
3B42v7 3529 4 0.06
Masindi ARC2 3416 (2330) 27 (215) 0.09 (0.02) RFE2 3416 (2330) 215 (223) 0.13 (0.06)
3B42v7 3416 23 0.07
Ngogo ARC2 3626 212 20.04
RFE2 3626 222 0.07
3B42v7 3652 29 0.05
Kasese ARC2 3591 (2207) 6 (27) 20.07 (20.21) RFE2 3591 (2207) 23 (215) 0.10 (20.08)
3B42v7 3591 32 20.10
Mweya ARC2 2983 43 20.43
RFE2 2983 17 20.10
3B42v7 2983 25 20.08
Bwindi ARC2 2783 3 20.41
RFE2 2783 23 20.11
highlands of southwestern Uganda; therefore, it appears that the Bwindi rain gauge is not in a location dominated by warm orographic rains. Nevertheless, the products are expected to perform poorly in the Rwenzori Mountains, an approximately 100-km tract of the most mountainous part of the study region with peaks exceeding 5000 m MSL and annual rainfall exceeding 2000 mm (Osmaston 1989; Eggermont et al. 2009). Over the 2001–10 period, the maximum mean annual rainfall totals in the Rwenzori Mountains from ARC2, RFE2, and 3B42v7 were just 1350, 1010, and 1330 mm, respectively.
4. Conclusions
The purpose of this study was to assess the accuracy of ARC2, RFE2, and 3B42v7 for estimating rainfall days and rainfall totals at six stations in the Uganda portion of the Albertine Rift, which is on the eastern edge of central equatorial Africa, for the period 2001–10. The products performed best at identifying rainfall days at the three northern stations, but all three products tended to over-estimate rainfall days at all stations. Both 3B42v7 and ARC2 were satisfactory products for estimating seasonal rainfall totals at the northern stations, with 3B42v7 being more accurate than ARC2. 3B42v7 also was accurate at estimating monthly rainfall totals at the northern stations, and it was the only product not to underestimate boreal-summer rainfall at the northern stations. None of the products performed satisfactorily at the two southern stations in rain shadows. The products were borderline
satisfactory at estimating rainfall at the southernmost station, located in the highlands of southwestern Uganda. Finally, the products greatly underestimate rainfall in the Rwenzori Mountains, the largest mountain range in the study region. Consequently, the rainfall products are not useful for estimating rainfall in rain shadows and possibly other valley locations of the rift and in mountainous areas where the warm orographic rain process dominates.
Much more validation work is needed not only in low-and high-elevation areas of western Uglow-anda, but also southward throughout the rest of the Albertine Rift and westward into the rest of central equatorial Africa. The major obstacle to proper validation work in the region is the lack of high-quality, daily, ground-measured rainfall totals over multiple years. Additional validation studies are especially important with respect to ARC2: that product extends back to 1983 and thus might be useful for rainfall-variability analyses in gauge-deficient regions, such as the rest of central equatorial Africa.
Acknowledgments. This research was supported by a National Science Foundation Dynamics of Coupled Nat-ural and Human Systems Exploratory grant (CNH-EX 1114977).
REFERENCES
Bahati, G., P. Zhonghe, H. Ármannsson, E. M. Isabirye, and V. Kato, 2005: Hydrology and reservoir characteristics of three geothermal systems in western Uganda.Geothermics,34,568– 591, doi:10.1016/j.geothermics.2005.06.005.
TABLE5. Evaluation statistics at the six rainfall stations over 2001–10 for 10-day, monthly, and seasonal rainfall totals. The sample size is
N. Positive (negative)PBIAS(%) are overestimates (underestimates).The coefficient of efficiency between observed totals and predicted
totals isE. ItalicizedPBIASandEvalues are artificially closer to 0 and 1, respectively, because of reporting days included in the
calculations.
10 Days Monthly Seasonal
Product N PBIAS E N PBIAS E N PBIAS E
Gulu ARC2 349 29 0.38 113 211 0.53 35 210 0.62
RFE2 349 213 0.43 111 215 0.50 35 214 0.54
3B42v7 349 6 0.51 113 4 0.72 35 5 0.77
Masindi ARC2 339 27 0.36 109 27 0.49 34 28 0.59
RFE2 339 215 0.36 108 215 0.49 34 215 0.50
3B42v7 339 22 0.39 109 23 0.67 34 24 0.71
Ngogo ARC2 365 212 0.29 121 212 0.38 39 212 0.50
RFE2 365 222 0.29 119 222 0.27 39 222 0.28
3B42v7 365 29 0.45 121 29 0.51 39 29 0.67
Kasese ARC2 358 6 0.08 118 6 0.16 37 5 0.31
RFE2 358 23 0.22 116 23 0.32 37 22 0.47
3B42v7 358 32 20.02 118 32 0.18 37 30 0.13
Mweya ARC2 297 43 20.21 98 43 20.22 32 43 20.58
RFE2 297 16 0.08 96 17 0.19 32 17 0.33
3B42v7 297 25 0.06 98 25 0.05 32 24 0.12
Bwindi ARC2 252 3 0.04 76 5 0.25 20 5 0.44
RFE2 252 22 0.15 76 22 0.24 20 0 0.58
Basalirwa, C. P. K., 1995: Delineation of Uganda into climatological rainfall zones using the method of principal component analysis.
Int. J. Climatol.,15,1161–1177, doi:10.1002/joc.3370151008. Cohen Liechti, T., J. P. Matos, J. L. Boillat, and A. J. Schleiss,
2012: Comparison and evaluation of satellite derived pre-cipitation products for hydrological modeling of the Zambezi river basin.Hydrol. Earth Syst. Sci.,16,489–500, doi:10.5194/ hess-16-489-2012.
Cordeiro, N. J., N. D. Burgess, D. B. K. Dovie, B. A. Kaplin, A. J. Plumptre, and R. Marrs, 2007: Conservation in areas of high population density in sub-Saharan Africa.Biol. Conserv.,134,
155–163, doi:10.1016/j.biocon.2006.08.023.
Dinku, T., P. Ceccato, E. Grover-Kopec, M. Lemma, S. J. Connor, and C. F. Ropelewski, 2007: Validation of satellite rainfall products over East Africa’s complex topography.Int. J. Re-mote Sens.,28,1503–1526, doi:10.1080/01431160600954688. ——, S. Chidzambwa, P. Ceccato, S. J. Connor, and C. F.
Ropelewski, 2008: Validation of high-resolution satellite rainfall products over complex terrain.Int. J. Remote Sens.,29,4097– 4110, doi:10.1080/01431160701772526.
——, P. Ceccato, and S. J. Connor, 2011: Challenges of satellite rainfall estimation over mountainous and arid parts of east Africa. Int. J. Remote Sens., 32, 5965–5979, doi:10.1080/ 01431161.2010.499381.
Eggermont, H., K. Van Damme, and J. M. Russell, 2009: Rwenzori Mountains (Mountains of the Moon): Headwaters of the White Nile.The Nile: Origin, Environments, Limnology and Human Use,H. Dumont, Ed., Springer, 243–261.
Fisher, B., and T. Christopher, 2007: Poverty and biodiversity: Mea-suring the overlap of human poverty and the biodiversity hot-spots.Ecol. Econ.,62,93–101, doi:10.1016/j.ecolecon.2006.05.020. Hartter, J., M. D. Stampone, S. J. Ryan, K. Kirner, C. A. Chapman, and A. Goldman, 2012: Patterns and perceptions of climate change in a biodiversity conservation hotspot.PLoS One,7,
e32408, doi:10.1371/journal.pone.0032408.
Herrmann, S. M., and K. I. Mohr, 2011: A continental-scale classifi-cation of rainfall seasonality regimes in Africa based on gridded precipitation and land surface temperature products.J. Appl. Meteor. Climatol.,50,2504–2513, doi:10.1175/JAMC-D-11-024.1. Hoerling, M., J. Hurrell, J. Eischeid, and A. Phillips, 2006: De-tection and attribution of twentieth-century northern and southern African rainfall change.J. Climate,19,3989–4008, doi:10.1175/JCLI3842.1.
Huffman, G. J., and Coauthors, 2007: The TRMM Multisatellite Precipitation Analysis (TMPA): Quasi-global, multiyear, combined-sensor precipitation estimates at fine scales.J. Hy-drometeor.,8,38–55, doi:10.1175/JHM560.1.
Kizza, M., A. Rodhe, C. Y. Xu, H. K. Ntale, and S. Halldin, 2009: Temporal rainfall variability in the Lake Victoria basin in East Africa during the twentieth century.Theor. Appl. Climatol., 98,119–135, doi:10.1007/s00704-008-0093-6.
Legates, D. R., and G. J. McCabe, 1999: Evaluating the use of ‘‘goodness-of-fit’’ measures in hydrologic and hydroclimatic model validation.Water Resour. Res.,35,233–241, doi:10.1029/ 1998WR900018.
Liebmann, B., I. Bladé, G. N. Kiladis, L. M. V. Carvalho, G. Senay, D. Allured, and S. Leroux, 2012: Seasonality of African pre-cipitation from 1996 to 2009. J. Climate, 25, 4304–4322, doi:10.1175/JCLI-D-11-00157.1.
Love, T. B., V. Kumar, P. Xie, and W. Thiaw, 2004: A 20-year daily Africa precipitation climatology using satellite and gauge data.14th Conf. on Applied Meteorology, Seattle, WA,
Amer. Meteor. Soc., P5.4. [Available online athttp://ams. confex.com/ams/pdfpapers/67484.pdf.]
Moriasi, D. N., J. G. Arnold, M. W. Van Liew, R. L. Bingner, R. D. Harmel, and T. L. Veith, 2007: Model evaluation guidelines for systematic quantification of accuracy in watershed simu-lations. Trans. Amer. Soc. Agric. Biol. Eng., 50, 885–900, doi:10.13031/2013.23153.
Nair, S., G. Srinivasan, and R. Nemani, 2009: Evaluation of multi-satellite TRMM derived rainfall estimates over a western state of India. J. Meteor. Soc. Japan, 87, 927–939, doi:10.2151/ jmsj.87.927.
Nash, J. E., and J. V. Sutcliffe, 1970: River flow forecasting through conceptual models: Part 1. A discussion of principles.J. Hydrol., 10,282–290, doi:10.1016/0022-1694(70)90255-6.
Nicholson, S. E., 1996: A review of climate dynamics and climate variability in eastern Africa.The Limnology, Climatology and Paleoclimatology of the East African Lakes,T.C. Johnson and E. Odada, Eds., CRC Press, 25–56.
——, 2000: The nature of rainfall variability over Africa on time scales of decades to millennia.Global Planet. Change,26,137– 158, doi:10.1016/S0921-8181(00)00040-0.
Novella, N. S., and W. M. Thiaw, 2013: African Rainfall Climatology Version 2 for famine early warning systems.J. Appl. Meteor. Climatol.,52,588–606, doi:10.1175/JAMC-D-11-0238.1. Orlove, B., C. Roncoli, M. Kabugo, and A. Majugo, 2010:
In-digenous climate knowledge in southern Uganda: The multi-ple components of a dynamic regional system. Climatic Change,100,243–265, doi:10.1007/s10584-009-9586-2. Osmaston, H. A., 1989: Glaciers, glaciations and equilibrium line
altitudes on the Rwenzori. Quaternary and Environmental Research on East African Mountains,W. C. Mahaney, Ed., A. A. Balkema, 31–104.
Plumptre, A. J., and Coauthors, 2007: The biodiversity of the Al-bertine Rift. Biol. Conserv., 134, 178–194, doi:10.1016/ j.biocon.2006.08.021.
Population Reference Bureau, 2012: World population data sheet. Population Reference Bureau Rep., 19 pp. [Available online atwww.prb.org/pdf09/09wpds_eng.pdf.]
Stampone, M. D., J. Hartter, C. A. Chapman, and S. J. Ryan, 2011: Trends and variability in localized precipitation around Kibale National Park, Uganda, Africa.Res. J. Environ. Earth Sci.,3,
14–23.
Thiemig, V., R. Rojas, M. Zambrano-Bigiarini, V. Levizzani, and A. De Roo, 2010: Validation of satellite-based precipitation products over sparsely gauged African river basins.J. Hy-drometeor.,13,1760–1783, doi:10.1175/JHM-D-12-032.1. Todd, M. C., and R. Washington, 2004: Climate variability in
central equatorial Africa: Influence from the Atlantic sector.
Geophys. Res. Lett.,31,L23202, doi:10.1029/2004GL020975. Tosca, M. G., J. T. Randerson, and C. S. Zender, 2013: Global
impact of smoke aerosols from landscape fires on climate and the Hadley circulation.Atmos. Chem. Phys.,13,5227–5241, doi:10.5194/acp-13-5227-2013.
Trenberth, K. E., and Coauthors, 2007: Observations: Surface and atmospheric climate change. Climate Change 2007: The Physical Science Basis,S. Solomon et al., Eds., Cambridge University Press, 235–336.