R E S E A R C H A R T I C L E
Open Access
Predictors of inappropriate complementary
feeding practice among children aged 6 to
23 months in Wonago District, South
Ethiopia, 2017; case control study
Zerihun Berhanu
*, Taddese Alemu
†and Dirshaye Argaw
†Abstract
Background:Inappropriate complementary feeding practice could result in child illness, sub-optimal growth and development. Evidence shows a huge burden of inappropriate complementary feeding practice from global to national level. But studies regarding predictors of inappropriate complementary feeding practices were scarce especially in the study area. Therefore, the aim ofthis study was to determine predictors and community level factors associated with inappropriate complementary feeding practice among children age 6 to 23 months in Wonago district, South Ethiopia.
Methods:A community based unmatched case-control study design complemented by a qualitative and dietary data was employed among children in Wonago district from April- 07 to June- 06, 2017. A total of 372 study subjects were enrolled to the study by stratified sampling technique. Data were checked, coded and entered to Epi data and exported to SPSS for analysis. Univariate, bivariable and multivariable logistic regressions analyses were applied. A p- value < 0.05 was considered as statistical significant level.
Results:Paternal household decision making on feeding(AOR = 4.65, 95% CI = (1.69, 12.81)), family priority to elders during feeding(AOR = 2.35, 95% CI = (1.08, 5.14)), absence of nearby health facility(AOR = 4.15, 95% CI = (1.63, 10.55)), unplanned pregnancy (AOR = 3.45, 95% CI = (1.21, 9.85)), missing ANC(AOR = 2.71, 95% CI = (1.48, 4.96)) and
missing EPI service utilization (AOR = 2.43, 95% CI = (1.34, 4.38)) were independent predictors of inappropriate complementary feeding practices. Whereas; lack of awareness, short birth spacing practice, poverty and feeding culture were community related factors. The nutrient density of complementary foods were below WHO desired density level except for energy, protein and vitamin C.
Conclusions:Inappropriate complementary feeding practice was related to household feeding cultures, health service access and utilization and community related factors like awareness, poverty and low birth spacing. Complementary foods were found to have lower nutrient density than desired by WHO. Promoting community’s health service utilization and increasing awareness regarding complementary feeding were recommended.
© The Author(s). 2019Open AccessThis article is distributed under the terms of the Creative Commons Attribution 4.0 International License (http://creativecommons.org/licenses/by/4.0/), which permits unrestricted use, distribution, and reproduction in any medium, provided you give appropriate credit to the original author(s) and the source, provide a link to the Creative Commons license, and indicate if changes were made. The Creative Commons Public Domain Dedication waiver (http://creativecommons.org/publicdomain/zero/1.0/) applies to the data made available in this article, unless otherwise stated.
* Correspondence:zer.ber98@gmail.com;zer_ber98@yahoo.com
†Taddese Alemu and Dirshaye Argaw contributed equally to this work.
Background
The period from birth to two years of age is a“critical win-dow”for the promotion of optimal growth, health and devel-opment which are directly dependent on nutrition. World Health Organization (WHO) recommends exclusive breast feeding till six months of age; then to start complementary feeding, which is the process of starting other foods and liq-uids along with breast milk when breast milk alone is no lon-ger sufficient to meet the nutritional requirements of infants [1]. A complementary feeding practices commencing at 6–8 months of age while fulfilling minimum acceptable diet is considered as appropriate complementary feeding practice, but it is considered as inappropriate when it fails to fulfill ei-ther of the above indicators [2].
Globally only one in six children are receiving a min-imally acceptable diet [3]. While in Eastern and South Africa it was one in ten infant and young children [3]. In Ethiopia the status of minimum meal frequency, dietary diversity and acceptable diet were 48, 4 and 4% respect-ively. But minimum acceptable diet reached 7% in the recent 2016 Ethiopia Demography and Health Survey (EDHS). Similarly in South Nations and Nationalities Peoples Region (SNNPR) only 2.5% of infant and young children meet minimum dietary diversity and only 2.3% of them had the minimum acceptable diet according to EDHS 2011 [4,5].
Proper complementary feeding is important in filling energy and nutrient gaps to continue optimal growth, de-velopment and maintain health beyond six months. The amount of energy required from complementary feeding were 200, 300 & 550 kcal/day for 6–8, 9–11 & 12–23 months child respectively. Inappropriate complementary feeding practices results in total replacement of breast milk; increase risk of malnutrition, nutrient deficiencies, diarrhea and respiratory tract infections, slow growth and development; and maternal pregnancy [6–13].
Evidence is accumulated on the fact of a strong associ-ation of complementary feeding practices with
sociode-mographic, household, community, health service
utilization and information related factors [14–23]. But most of them emphasize on the positive direction (ap-propriate) and measures individual indicators of comple-mentary feeding, while inappropriate feeding culture is predominant. Additionally, as of the investigators know-ledge complementary feeding was not well studied par-ticular in Wonago district, where population density and malnutrition are high, and health service utilization is low. Therefore, this study aimed to investigate determi-nants and community level factors of inappropriate complementary feeding practices; and estimate energy density and nutrient adequacy of complementary feeding in the area. This made the study very important in de-veloping strategies and policies regarding complemen-tary feeding.
Methods
Study area and period
The study was conducted in Wonago district of Gedeo zone, SNNPR, Ethiopia. The district was located 13, 102 and 377 kms from the zonal, regional and national capi-tals, Dilla, Hawassa and Addis Ababa, respectively. The district have 17 rural and 4 urban kebeles. The latest 2016 population projection of the national statistical au-thority shows that the district has 156,481 total popula-tion. There are 33,294 households having 4.7 persons per household. From the total population, 91.3% dwells in the rural, while the rest 8.7% lives in urban. There are 29,780 and 3077 households in rural and urban respect-ively. Person per household is 4.8 and 4.4 for rural and urban respectively. According to Gedeo zone agriculture office coffee, inset, maize, teff, cabbage, sweet potato, av-ocado, banana, mango were among the main agricultural production of the district. The major economic activity of the area is commerce especially on coffee and product of inset. There are 6 health centers, 20 health posts and 2 private clinics in Wonago district. The study was con-ducted between April 07 and June 06, 2017 G.C.
Study design
The study employed a community based unmatched case-control analytic study design. This was complemen-ted by a qualitative data from community and dietary data from selected households.
Sample size determination
The sample size was calculated using EPI-Info version 7 statistical software (Center for Disease Control and Pre-vention, Atlanta, 2005) and the largest feasible sample size was taken. The assumptions for the sample size calcula-tion were: proporcalcula-tion of young children who had exposur-e(maternal education with secondary and above) were 17.9% among the cases and 31% among controls [24], 80% power, 95% confidence interval, 10% non-response rate and a case: control ratio of 1:1. This yielded, a total sample size of372(186cases and186controls). Similarly, satur-ation and redundancy level of informsatur-ation was used to limit the number of key informants and focus group dis-cussant of the qualitative part of the study.
Sampling technique and sampling procedures
feeding practices of infant and young children [2]. These are introduction of solid, semi-solid or soft foods at 6–8 months of age, meal frequency and dietary diversity. The 24 h dietary intake of the children were assessed using these structured questionnaire as of the mothers report. Based on this assessment the children’s dietary intake were labeled as appropriate (control) and inappropriate (case). Appropriate when they meet all the three indica-tors timely introduction, minimum meal frequency and minimum dietary diversity while it was considered in-appropriate when it fails to fulfill even a single indica-tors. From these list of identified households, a total of 186 cases and 186 controls were selected using a simple random sampling technique.
Operational definitions
Timely introduction of complementary feeding: intro-duction of solid, semi-solid or soft foods is recom-mended to start at age of 6–8 months [2].
Minimum dietary diversity:it is receiving foods from 4 or more food groups for children 6–23 months of age [2].
Minimum meal frequency: it is receiving solid, semi-solid, or soft foods the minimum number of times
or more among children 6–23 months. The
recom-mended number of meals per day for 6–8 months, 9–11 months & 12–23 months is 2–3 times, 3–4 times and 3– 4 plus 1–2 snacks respectively [2].
Minimum acceptable diet: Is the combination of both minimum dietary diversity and meal frequency [2].
Inappropriate complementary feeding practice:
complementary feeding practices that fails to fulfill ei-ther timely introduction or minimum acceptable diet.
Cases: Are young children (6–23 months) with in-appropriate complementary feeding practices.
Controls: Are young children (6–23 months) with ap-propriate complementary feeding practices.
Data collection procedures
Data was collected using a study format, structured, semi-structured and unstructured quantitative and quali-tative data collection questionnaires. The quantitave data collection utilized a structured interviewer administer questionnaires. It do have section that address sociode-mographic, household, community and health services characteristics. Under household characteristic wealth index was assessed using household asset and housing characteristics while household food insecurity was assessed using household food insecurity access scale measurement tool. While the qualitative data was col-lected using semi and unstructured in-depth and focus group discussion guide more focusing on community and cultural aspects. The data collection tools were
prepared in English and translated to local languages, Amharic and Gede’uffa.
The energy density and nutrient adequacy of comple-mentary foods were estimated among 15% of the sam-ple size, using dietary assessment method. The children food intake were weighted for two days. During each meal, weight of each ingredients during preparation, final weight of the food before taken by the child and leftover weight were taken.
The quantitative data was collected using 6 data col-lectors who complete at least grade 10; one for each se-lected kebeles. While the qualitative data collection utilized a total of 7 data collectors who are health pro-fessional. Two public health professionals supervised the whole data collection process day today. All data collec-tors and supervises were trained for one day before pre-ceding to data collection.
Pre-testing
Pre-testing and standardization of the study tools was carried out on April 2017, in Chichu which is closer but outside the proposed study area. Chichu was known to
share similar economic, geographic, cultural and
socio-demographic characteristics with study villages. During pre-testing the questionnaire was assessed for its clarity, understandability, length, completeness, validity and reliability. A total of 37 (10% of sample size) house-holds was selected for pre-testing.
Data processing and analysis
Data was checked, coded and entered to Epi data version 3.1 and exported to SPSS (Statistical Package for Social science) version 20 for analysis. Univariate analysis like mean, median and frequencies were conducted and pre-sented using text, tables and graphs. Wealth index was computed using the principal component analysis. Then bivariable analysis was carried out to identify candidate factors associated with outcome variable for multivari-able analysis. The decision was made using Odds ratio (OR) and confidence interval (CI) at 95% confidence level. Finally those predictor variables withP< 0.25 were entered into multivariable analysis and the final model was fitted using variables withP< 0.05.
Dietary data collected from sub sample two days fol-low up was converted to nutritional data using the Ethi-opian Food Composition Table for major macro and micronutrient contents. Each nutrient amount was cal-culated from each ingredient of complementary foods using the conversion factor from the above table. Then total amount of each nutrients over the two days were calculated by summing individual amount of nutrient from each ingredient of each meal. The same procedure were followed to calculate the total energy of
complementary food was calculated by dividing the amount of nutrients to total energy level of complemtary foods(in Kcal) and multiplying by 100Kcal while en-ergy density was calculated by dividing total enen-ergy of complementary foods in Kcal to total amount of com-plementary foods in grams.
Qualitative data analysis was done manually. Each audiotape interview was professionally transcribed word by word in Geddu’uffa (local language) to Amharic and then translated to English languages. Transcribed data was analyzed manually using the thematic framework analysis method.
Results
Characteristic of study participants
From a total of 421 children screened by the census; 213(54.9%) and 190(45.1%) children had been practicing appropriate and inappropriate complementary feeding respectively. From this 421 children, 372 children; 186 with appropriate complementary feeding practice (con-trol group) and 186 children with inappropriate comple-mentary feeding practice (case group) were enrolled to this analytic case-control study. The response rate of this analytical study was 100%.
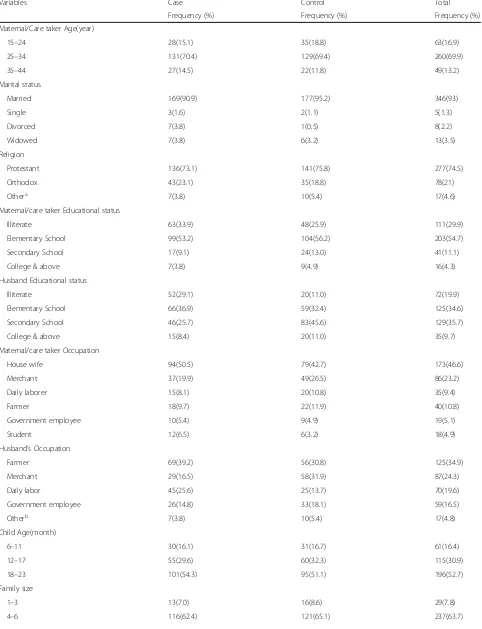
Sociodemographic characteristics
Majority of the study subjects, 143(76.9%) from case and 123(66.1%) from the control were enrolled from rural villages. In the same way, almost all 176(94.6%) cases and 182(97.8%) controls were cared by their biological mothers. The mean age of the mothers/care takers was 28.94 ± 4.85 years and most of them 260(70%) were in the age range of 25–34 years. The mean age of the chil-dren was 16.1 ± 4.55 months while 101(54.3%) cases and 95(51.1%) controls being in the range of 18–23 months. About 98(52.7%) cases and 96(51.6%) controls were fe-male and fe-male respectively (Table1).
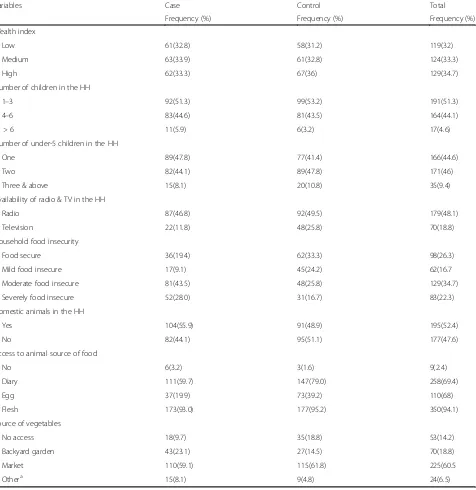
Household related characteristics
Households with three and above under five children were 15(8.1%) and 20(10.8%) among cases and controls respectively. Mothers were the decision makers of household feeding in most of the households among both cases 150(80.6%) and controls 178(95.7%). About 81(43.5%) household had moderate food insecurity among cases while among controls 62(33.3%) household had food security. Majority of the household had access to diary (258) and flesh (350) while most of the house-hold access vegetables from market (225) among both case and control (Table2).
Community related characteristics
There were food restriction among 15(8.1%) cases and 10(5.4%) controls. Family members other than children
especially fathers were culturally preferred in getting qual-ity food in 147(79%) cases and 124(66.7%) controls. One hundred thirty five (72.6%) cases and one hundred forty seven (79%) controls mentioned that grandmothers had no role on complementary feeding practices (Table3).
Health service related characteristics
Health facility was not available for 51(27.4%) cases and 10(5.4%) controls near to their village. Most of the chil-dren; 146(78.5%) cases and 178(95.7%) controls were from planned pregnancy. Only 18(9.7%) cases and 22(11.8%) controls were first birth order. Eighty seven (47%) and eighteen (10%) mothers from cases and con-trols respectively had no ANC visit whereas home deliv-ery was above 40% for both cases and controls. About 18(43.5%) mothers of cases did not receive information regarding complementary feeding during MCH service utilization whereas 64(34.4%) mothers of controls re-ceived the information from ANC service (Table4).
Whereas three mothers out of ten had no history of MCH service utilization among cases but it was only 4.3% among controls. Whereas PNC and under-5 out-patient department (OPD) were least ever utilized MCH services in both case and control groups (Fig.1).
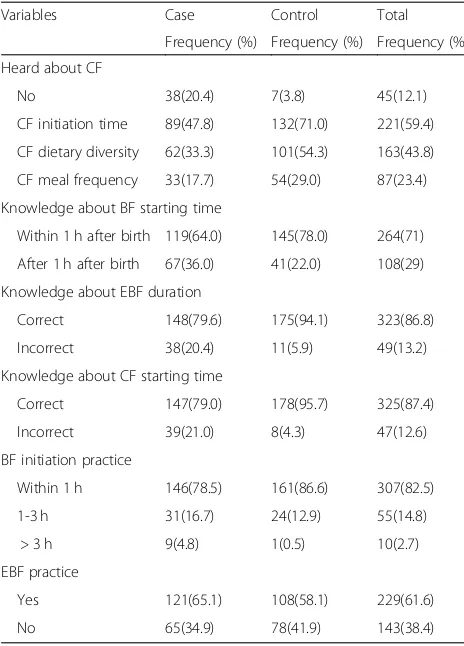
Information, knowledge and practice related characteristics
A large proportion of the mothers, 105(56.5%) cases and 126(67.7%) controls had media exposure. A majority of controls (108/60.3%) than cases (74/50%) got informa-tion about complementary feeding from health workers (Fig. 2). Majority of the mothers in both groups had ap-propriate knowledge regarding breast feeding initiation
time 264(71%), exclusive breast feeding duration
323(86.8%) and initiation time of complementary feeding 325(87.4%). Most of them practiced proper breast feed-ing initiation and exclusive breast feedfeed-ing (Table 5). Whereas the reason for late breast feeding initiation were baby being at the hand of the health professional and being tried was mentioned by most of the mothers among control and case respectively (Fig.3).
Predictors of inappropriate complementary feeding practice
Finally household decision maker regarding feeding, cul-tural preference to get food, nearby health facility, type of pregnancy, ANC and EPI service utilization were found to be independent predictors of inappropriate complementary feeding.
Table 1Sociodemographic characteristics of children aged 6–23 months and their family in Wonago district, South Ethiopia in 2017 G.C
Variables Case Control Total
Frequency (%) Frequency (%) Frequency (%)
Maternal/Care taker Age(year)
15–24 28(15.1) 35(18.8) 63(16.9)
25–34 131(70.4) 129(69.4) 260(69.9)
35–44 27(14.5) 22(11.8) 49(13.2)
Marital status
Married 169(90.9) 177(95.2) 346(93)
Single 3(1.6) 2(1.1) 5(1.3)
Divorced 7(3.8) 1(0.5) 8(2.2)
Widowed 7(3.8) 6(3.2) 13(3.5)
Religion
Protestant 136(73.1) 141(75.8) 277(74.5)
Orthodox 43(23.1) 35(18.8) 78(21)
Othera 7(3.8) 10(5.4) 17(4.6)
Maternal/care taker Educational status
Illiterate 63(33.9) 48(25.9) 111(29.9)
Elementary School 99(53.2) 104(56.2) 203(54.7)
Secondary School 17(9.1) 24(13.0) 41(11.1)
College & above 7(3.8) 9(4.9) 16(4.3)
Husband Educational status
Illiterate 52(29.1) 20(11.0) 72(19.9)
Elementary School 66(36.9) 59(32.4) 125(34.6)
Secondary School 46(25.7) 83(45.6) 129(35.7)
College & above 15(8.4) 20(11.0) 35(9.7)
Maternal/care taker Occupation
House wife 94(50.5) 79(42.7) 173(46.6)
Merchant 37(19.9) 49(26.5) 86(23.2)
Daily laborer 15(8.1) 20(10.8) 35(9.4)
Farmer 18(9.7) 22(11.9) 40(10.8)
Government employee 10(5.4) 9(4.9) 19(5.1)
Student 12(6.5) 6(3.2) 18(4.9)
Husband’s Occupation
Farmer 69(39.2) 56(30.8) 125(34.9)
Merchant 29(16.5) 58(31.9) 87(24.3)
Daily labor 45(25.6) 25(13.7) 70(19.6)
Government employee 26(14.8) 33(18.1) 59(16.5)
Otherb 7(3.8) 10(5.4) 17(4.8)
Child Age(month)
6–11 30(16.1) 31(16.7) 61(16.4)
12–17 55(29.6) 60(32.3) 115(30.9)
18–23 101(54.3) 95(51.1) 196(52.7)
Family size
1–3 13(7.0) 16(8.6) 29(7.8)
Table 1Sociodemographic characteristics of children aged 6–23 months and their family in Wonago district, South Ethiopia in 2017 G.C
(Continued)
Variables Case Control Total
Frequency (%) Frequency (%) Frequency (%)
> 6 57(30.6) 49(26.3) 106(28.5)
a
Includes Muslims and non-religiousbIncludes students and non-workers
Table 2Household related characteristic of children aged 6–23 months in Wonago district, South Ethiopia in 2017 G.C
Variables Case Control Total
Frequency (%) Frequency (%) Frequency (%)
Wealth index
Low 61(32.8) 58(31.2) 119(32)
Medium 63(33.9) 61(32.8) 124(33.3)
High 62(33.3) 67(36) 129(34.7)
Number of children in the HH
1–3 92(51.3) 99(53.2) 191(51.3)
4–6 83(44.6) 81(43.5) 164(44.1)
> 6 11(5.9) 6(3.2) 17(4.6)
Number of under-5 children in the HH
One 89(47.8) 77(41.4) 166(44.6)
Two 82(44.1) 89(47.8) 171(46)
Three & above 15(8.1) 20(10.8) 35(9.4)
Availability of radio & TV in the HH
Radio 87(46.8) 92(49.5) 179(48.1)
Television 22(11.8) 48(25.8) 70(18.8)
Household food insecurity
Food secure 36(19.4) 62(33.3) 98(26.3)
Mild food insecure 17(9.1) 45(24.2) 62(16.7
Moderate food insecure 81(43.5) 48(25.8) 129(34.7)
Severely food insecure 52(28.0) 31(16.7) 83(22.3)
Domestic animals in the HH
Yes 104(55.9) 91(48.9) 195(52.4)
No 82(44.1) 95(51.1) 177(47.6)
Access to animal source of food
No 6(3.2) 3(1.6) 9(2.4)
Diary 111(59.7) 147(79.0) 258(69.4)
Egg 37(19.9) 73(39.2) 110(68)
Flesh 173(93.0) 177(95.2) 350(94.1)
Source of vegetables
No access 18(9.7) 35(18.8) 53(14.2)
Backyard garden 43(23.1) 27(14.5) 70(18.8)
Market 110(59.1) 115(61.8) 225(60.5
Othera 15(8.1) 9(4.8) 24(6.5)
a
food were 2 times more likelihood of inappropriate com-plementary feeding practice than those in the house with preference for children less than 2 years (AOR = 2.35, 95% CI = (1.08, 5.14)).
Children from area without nearby health facility had 4 times more likelihood of inappropriate complementary feeding (AOR = 4.15, 95% CI = (1.63, 10.55)). Unplanned children had 3 times more likelihood of inappropriate complementary feeding compared to planned children (AOR = 3.45, 95% CI = (1.21, 9.85)). Those children from mothers without any history of ANC service utilization had 2.7 times higher probability of inappropriate com-plementary feeding as compared to children from mothers with ANC service utilization (AOR = 2.71, 95% CI = (1.48, 4.96)). Similarly children from those mother’s without history EPI service utilization had 2.4 times risk of having inappropriate complementary feeding practices
compared to those from mother’s with EPI service
utilization (AOR = 2.43, 95% CI = (1.34, 4.38)) (Table6).
Estimated energy density and nutrient density of complementary foods
After sub-sample assessment of complementary foods; mean of estimated energy density per day was 0.865 ± 0.15 Kcal/g for 6–8 months, 0.974 ± 0.19 Kcal/g for 9–11 months and 1.081 ± 0.2 Kcal/g for 12–23 months children. While mean protein density per 100Kcal energy of comple-mentary food per day were 1.224 ± 0.46 g for 6–8 months, 1.128 ± 0.31 g for 9–11 months and1.267 ± 0.34 g for 12– 23 months children. Whereas mean calcium density per
100Kcal energy of complementary food taken by children 6–8, 9–11 and 12–23 months per day were 13.957 ± 3.47,12.023 ± 2.73 and 10.459 ± 3.07 mg respectively. Except energy, protein, vitamin C densities other nutrient densities were below WHO desired density level [25,26] (Table7).
Qualitative study findings
Study participants
A total of four focus group discussions (FGD) and six in-depth interviews were conducted with purposefully se-lected mothers and key informants respectively. FGDs were held with thirty five mothers (7, 9, 11 & 8 mothers in each groups) having child beyond six months in the study community. In terms of their sociodemographic charac-teristics, three quarter of the mothers were from rural area and 68% of them had less than primary educational status. Table 3Community related characteristics of children aged 6–
23 in Wonago district, South Ethiopia 2017 G.C
Variables Case Control Total
Frequency (%)
Frequency (%)
Frequency (%)
Food preference in the family
Children less than 2 years
31(16.7) 53(28.5) 84(22.6)
Children≥2 years 8(4.3) 9(4.8) 17(4.6)
Other family members 147(79.0) 124(66.7) 271(72.8)
Type of role grandmothers have on CF
Insisting CF early initiation
24(47.1) 19(48.7) 43(47.8)
Insisting CF timely initiation
16(31.4) 18(46.2) 34(37.8)
Other 11(21.6) 2(5.1) 13(14.4)
Reason for CF early/late initiation
Child could get hungry 17(53.1) 12(57.1) 29(54.7)
Mothers engaged with work
11(34.4) 4(19) 15(28.3)
Breast feeding is enough
4(12.5) 5(23.8) 9(17)
Table 4Health service related characteristics of children aged 6–23 months and their mothers in Wonago district, South Ethiopia in 2017 G.C
Variables Case Control Total
Frequency (%) Frequency (%) Frequency (%)
Birth Order
First 18(9.7) 22(11.8) 40(10.8)
2–4 115(61.8) 109(58.6) 224(60.2)
> 4 53(28.5) 55(29.6) 108(29)
MCH Service utilization for the index child
ANC
No visit 87(46.8) 18(9.7) 105(28.2)
< 4 visit 65(34.9) 116(62.4) 181(48.7)
4 visit 19(10.2) 17(9.1) 36(9.7)
> 4 visit 15(8.1) 35(18.8) 50(13.4)
Place of birth
Home 99(53.2) 75(40.3) 174(46.8)
Health post 9(4.8) 16(8.6) 25(6.7)
Health center 48(25.8) 65(34.9) 113(30.4)
Hospital 30(16.1) 30(16.1) 60(16.1)
PNC 64(34.4) 114(61.3) 178(47.8)
EPI 181(97.3) 184(98.9) 365(98.1)
Growth monitoring 86(46.2) 130(69.9) 216(58.1)
Under-5 OPD 118(63.4) 132(71.0) 250(67.2)
Receive CF information from MCH services
No 81(43.5) 14(7.5) 95(25.5)
ANC 24(12.9) 64(34.4) 88(23.7)
Delivery 23(12.4) 32(17.2) 55(14.8)
PNC 2(1.1) 3(1.6) 5(1.3)
EPI 40(21.5) 50(26.9) 90(24.2)
Under-5 OPD 6(3.2) 10(5.4) 16(4.3)
Almost all of the mothers were married and half of them were house wives. They had an average age of 29 years (range, 22 to 50 years) and an average of four children each. The in-depth interview was carried out with health professionals acting as district health office head, health center head, under five outpatient case team coordinator, MCH case team coordinator and health extension worker. Most of them were clinical nurse and diploma holders.
Awareness about complementary feeding
Study participants had divergent views about appropriate as well as inappropriate complementary feeding prac-tices. Majority of key informants and the FGD discus-sants had good understanding on complementary feeding while others describing it poorly and often wrongly. Accordingly, four key informants and about 70% of FGD participants involved in the study described complementary feeding as a balanced food given to chil-dren with breast milk from 6 to 23 months from local resource. On the other hand, two of key informants also described it as a food given to malnourished children
and a food that is given to all under five children. One of the key informants also believe that the type and amount of complementary feeding depends on growth and development of the child.
Reporting on inappropriate complementary feeding practices, most of the participants believe that comple-mentary food could be considered inappropriate if it lacks adequacy in amount, regardless of its variety, fre-quency, consistency, and timely initiation.
Most participants from both FGD and in-depth interview reported that inappropriate complementary feeding has several consequences and effects on the health and devel-opment of the children that potentially leads to causes massive burden on the national economy. They emphasized its effect on the child’s health and wellbeing by affecting the immunity and disease resistance capacities.
Burden and extent of inappropriate complementary feeding practices in the area
As most of the study participant mentioned the burden and extent of inappropriate complementary feeding Fig. 1MCH service ever utilization among mothers of children aged 6–23 months in Wonago district, South Ethiopia in 2017 G.C
practices were sever in the area. Almost all of the health professionals agreed that complementary feeding prac-tices in the district was inappropriate being worst in the rural area. As they mentioned the community put the child on family food like qocho (local food prepared
from inset) and even they don’t care whether the child eat or not.
Supporting this most of the FGD participants agreed as they didn’t provide any thing especial other than fam-ily foods. Most of the time even they provide dry type of food like qocho and qoqor (food made from bread) with tea. Some of the mothers said that they didn’t give any thing for the child except breast until above 12 month and while others start complementary feeding before six months even before three months for seek of work. Con-trary to this some of FGD participants prepare different food for the child other than family food as affordable and they didn’t provide qocho and flesh till 12 months. They provide porridge prepared from maize, cow milk, egg with potato, carrot with potato, gruel and fruit like avocado, mango and banana for the child. They serve their child above two times a day as he/she needs.
Reasons for inappropriate complementary feeding practices
The study participants from both in-depth interview and FGD list out different reasons for inappropriate feeding practices in the area. For instance most of the partici-pants agreed that inappropriate complementary feeding result from lack of awareness, short birth spacing and poverty. But some of key informants and participants in FGD complain as it result from inappropriate usage of resource and lack of saving culture. For instance there is ample amount of different fruit source but not utilized in the home, as mentioned by most of the participants fruits were sold in the market and in return they bought inset for qocho preparation. Adding to this the area was not lucky in crop production and this was one of the reason as the participant believed. Lack of emphasis for the child in the community was one of the reason men-tioned by the participants and this was demonstrated by Table 5Information, knowledge and practice regarding breast
feeding and complementary feeding among mothers having children 6–23 months in Wonago district, South Ethiopia in 2017 G.C
Variables Case Control Total
Frequency (%) Frequency (%) Frequency (%)
Heard about CF
No 38(20.4) 7(3.8) 45(12.1)
CF initiation time 89(47.8) 132(71.0) 221(59.4)
CF dietary diversity 62(33.3) 101(54.3) 163(43.8)
CF meal frequency 33(17.7) 54(29.0) 87(23.4)
Knowledge about BF starting time
Within 1 h after birth 119(64.0) 145(78.0) 264(71)
After 1 h after birth 67(36.0) 41(22.0) 108(29)
Knowledge about EBF duration
Correct 148(79.6) 175(94.1) 323(86.8)
Incorrect 38(20.4) 11(5.9) 49(13.2)
Knowledge about CF starting time
Correct 147(79.0) 178(95.7) 325(87.4)
Incorrect 39(21.0) 8(4.3) 47(12.6)
BF initiation practice
Within 1 h 146(78.5) 161(86.6) 307(82.5)
1-3 h 31(16.7) 24(12.9) 55(14.8)
> 3 h 9(4.8) 1(0.5) 10(2.7)
EBF practice
Yes 121(65.1) 108(58.1) 229(61.6)
No 65(34.9) 78(41.9) 143(38.4)
Table 6Independent predictors of inappropriate complementary feeding practices among children 6–23 months of age in Wonago district, South Ethiopia 2017 G.C
Variables Case n(%) Control n(%) COR(95%CI) AOR(95%CI)
HH decision maker regarding feeding
Mother 150(80.6) 178(95.7) 1 1
Father 36(19.4) 8(4.3) 5.34(2.41, 11.84)** 4.65(1.69, 12.81)**
Food preference in the family
Children less than 2 years 31(16.7) 53(28.5) 1 1
Children≥2 years 8(4.3) 9(4.8) 1.52(0.53, 4.35) 0.61(0.16, 2.38)
Other family members 147(79.0) 124(66.7) 2.03(1.23, 3.35)** 2.35(1.08, 5.14)**
Availability of nearby health facility
Yes 135(72.6) 176(94.6) 1 1
No 51(27.4) 10(5.4) 6.65(3.26, 13.58)** 4.15(1.63, 10.55)**
Type of pregnancy resulting that child
Planned 146(78.5) 178(95.7) 1 1
Unplanned 40(21.5) 8(4.3) 6.1(2.77, 13.43)** 3.45(1.21, 9.85)**
ANC service ever utilized
Yes 55(29.6) 136(73.1) 1 1
No 137(70.4) 50(26.9) 6.48(4.12, 10.18)** 2.71(1.48, 4.96)**
EPI service ever utilized
Yes 64(34.4) 115(61.8) 1 1
No 122(65.6) 71(38.2) 3.09(2.02, 4.71)** 2.43(1.34, 4.38)**
1). 1:- Reference group**:-p-value< 0.05*:-p-value< 0.25+
:-Includes fathers, aunt, grandmothers and servant
2). Independent predictors controlled for:- child caretakers, maternal age, husband education status, household food insecurity, access to diary products, access to egg, grandmothers role on CF, family planning ever utilized, received information about CF from MCH, heard about CF
Table 7Estimated nutrient density per 100 kcal energy of complementary food per day for sub-sampled of 6–23 months children included in the study in Wonago district, South Ethiopia in 2017 G.C
Nutrient 6–8 months 9–11 months 12–23 months
Desired density Mean Median Desired density Mean Median Desired density Mean Median
Protein(g) 1 1.224 1 1.128 0.9 1.267
Calcium(mg) 105 13.957 74 12.023 63 10.459
Inadequate intake (%) 86.7 83.8 83.4
Phosphorous(mg) 114 30.15 70 30.085 26 31.841
Inadequate intake (%) 58.2 57
Iron(mg) 4.5 1.041 3 0.964 1 0.914
Inadequate intake (%) 76.9 67.9 8.6
Vitamin A(μg) 31 0.344 30 0.234 23 0.272
Inadequate intake (%) 98.9 99.2 98.8
Thiamine(mg) 0.08 0.026 0.06 0.03 0.07 0.031
Inadequate intake (%) 67.5 50 55.7
Riboflavin(mg) 0.08 0.055 0.06 0.038 0.06 0.04
Inadequate intake (%) 31.3 36.7 33.3
Niacin (mg) 1.5 0.226 1 0.239 0.9 0.271
Inadequate intake (%) 84.9 76.1 69.9
Vitamin C(mg) 1.5 1.647 1.7 1.563 1.5 1.590
that most of the child in the area were cared by others due to most mothers in the area were merchant.
Culture
In both FGD and in depth interview it were believed that culture pays a major role in child feeding practices. Feeding culture of the community is not in favor of ap-propriate child feeding practices, for instance the staple food of the area was qocho made from inset which is not comfortable for child especially at the beginning of complementary feeding and even they depraved locally available fruits and eggs by taking to the market for the sake of earning money for inset buying. Most of the par-ticipant also revealed that as there was priority for elders especially husbands during feeding and it was mentioned that leftover was served for the child. Contrary to this some of the participant also mentioned that as there was a culture of feeding together which again also made dif-ficult for the child to get appropriate complementary feeding putting them on ordinary family food and even they can’t compete to get adequate food. Most of the key informants also mentioned that there were a cultural medicine which made child depraved of appropriate care and treatment during sickness. So the health profes-sionals believe this had influence on complementary feeding by suppressing child’s appetite. In contrast to the above some of the key informants believe that the cul-ture of the community had no contribution for inappro-priate complementary feeding in the area.
Discussion
Inappropriate complementary feeding practice among children increase 4.7 times when household decision re-garding feeding made by father which is in line with a study from northwest Ethiopia [15]. This can be due to paternal knowledge regarding feeding was limited espe-cially on child feeding and most of the food preparation also carried out by mothers. This was evident that small portion of the study participants were cared by family members other than mothers which includes fathers, grandmothers and servants.
The culture of preference for family members other than children during feeding was responsible for increas-ing the odds of inappropriate complementary feedincreas-ing practice among children by 2.4. This is supported by the finding from qualitative study in which feeding culture of the community was mentioned as a responsible factor for inappropriate complementary feeding practices. Among these cultures priority during feeding was given for elders and leftover was served for children in the study area as revealed from in-depth interview and focus group discussion. On the other hand there was a culture of serving all family members including children to-gether during feeding putting them on ordinary family
food. In addition to this the qualitative result showed that children were a community members whom lacks due attention/emphasis by the community. But as of the investigator knowledge this family preference during feeding was not mentioned in other studies.
The odds of inappropriate complementary feeding practices rise by 4.2 when nearby health facility was not available. This may be related with as the facility is near-est to the community, the culture of service utilization increases which intern improve the awareness including about complementary feeding. This was not assessed by other studies as of the investigators knowledge.
In this study unplanned pregnancy increase the risk of inappropriate complementary feeding practices 3.5 times compared to planned one. During planning to have a child, the family will prepare themselves in different ways for instance psychological and economical ation. But in the case unplanned pregnancy this prepar-ation will be missed. Consequently the child may be depraved of proper care including feeding. Short birth spacing was one of the factor mention in the qualitative result which was interrelated with unplanned pregnancy. During short birth spacing there was shortage of re-source which may result in feeding problem of the chil-dren. In contrast study from Mekelle town revealed that whether the child was from planned or unplanned preg-nancy it did not have statistical significance on timely initiation of complementary feeding [22]. This difference may be due to this two studies were different in design and study setting.
As of this study mothers without exposure to ANC and EPI service were found engage their children with inappropriate complementary feeding practices. This is due to improved awareness gained during these service utilization. Similarly studies from South Asia countries revealed inadequate antenatal care as a predictor of in-appropriate complementary feeding practices [27, 28]. Moreover, studies from Ethiopia [18, 20, 22] and Nepal [21] revealed that ANC service utilization had improved complementary feeding practices. In contrast other cross-sectional studies in Ethiopia [16, 19, 23, 29] sated that ANC service utilization had no statistical signifi-cance on commencement of complementary feeding but they differ from this study in design and focusing point. Whereas as far as the knowledge of the investigator there was no evidence regarding the influence of EPI service utilization on complementary feeding practices.
Lack of awareness was one of the factor for inappro-priate complementary feeding according to the qualita-tive result. This is in line with a quasi-experimental study from Dilla showed improvement in complemen-tary feeding practice after intervening with nutritional education [30]. Similarly studies from Dangila [15], Jima
exposure and information regarding breast feeding im-proved complementary feeding practices.
Poverty was among the factor mentioned for inappro-priate complementary feeding during focus group discus-sion whereas wealth index lack statistical significance in the quantitative part. This is in line with study in south Wollo where middle-income and rich households had im-proved complementary feeding practice in respect to
diet-ary diversity [14]. Moreover, food availability and
affordability was one of the factor determining comple-mentary feeding practices in Zambia [31]. This is because economic status play role in fulfilling household resource including ingredients for complementary food prepar-ation. So that poverty can limit accessing those resource and result inappropriate complementary feeding practice. Inline to quantitative result income was not statistically significant with appropriate complementary feeding prac-tice in studies at Sidama zone and Abyi-Adi town [17,32]. According to the qualitative result improper resource utilization was related to inappropriate complementary feeding practices. For instance the area is rich in differ-ent fruits but as mdiffer-entioned in the focus group discus-sion and in-depth interview it was sold in the market and not served for the children. As it was recommended by WHO serving fruits can improve complementary feeding practices [2].
Only energy, protein and vitamin C densities were above WHO desired density level [25,26]. This is because maize, meat, qocho and kidney beans are among commonly uti-lized foods in the area and they are good in energy and protein according to Ethiopian food composition table. Whereas green pepper may be responsible for vitamin C as it is commonly utilized in the area [33]. Similarly com-plementary food protein density was above desired level in other studies from Ethiopia [34,35].This finding is in line with finding from South Africa, Guatemalan and Peru in respect to protein and vitamin C densities [36–39]. In contrast vitamin C density was below desired level in Wollo and Sidama of Ethiopia [34,35]. This may be due to difference in the way of dietary analysis, since this two studies followed biochemical analysis.
On other hand thiamine and riboflavin densities of complementary food was below the desired density of WHO. Whereas the density for niacin and iron was lower than desired density level [25, 26]. While phos-phorus, calcium and vitamin A densities were far below desired density level. These may be due to lower amount of complementary food served per day. Similarly thiamine and riboflavin densities of complementary foods in Sidama zone Ethiopia were below desired level [34]. Niacin and vitamin A densities of complementary food in Ethiopian and Guatemalan were similarly below the desired density level [34,35,37]. Furthermore, stud-ies from Ethiopia, South Africa, Guatemalan and Peru
also revealed that iron and calcium densities were below WHO recommendation [34–39]. Densities for thiamine, riboflavin, niacin and vitamin A were above the desired recommendation level in Guatemalan [36]. This differ-ence may be explained by the differdiffer-ence in feeding cul-ture of two community.
As a limitation most of the variables were measured based on subjective report of the participants which may introduced recall bias. Estimating energy and nutrient density of complementary foods using sub-sample without biochemical analysis was another limitation of the study.
Conclusions
According to this study inappropriate complementary feed-ing practices was related to household feedfeed-ing cultures, health service access and utilization and community related factors like awareness, poverty and low birth spacing. Com-plementary foods were found to have lower nutrient density than desired by WHO. Promoting community’s health ser-vice utilization and increasing awareness regarding comple-mentary feeding are recommended.
Abbreviations
ENA:Emergency nutrition assessment; EPI: Expanded program of immunization; HMIS: Health management information system; MCH: Maternal and child health; OPD: Out patient department; OR: Odds ratio; RNI: Recommended nutrient intake
Acknowledgements
The authors would like to express our gratitude to Dilla University College of Health Science and Medicine, public health department and NORHED /SENUPH research project office for their support, and for Gedeo zone health office, Gedeo zone statistics office, Gedeo zone agricultural office, Wonago district health office, and all health centers in the district and for all study participants, supervisors and data collectors.
Funding
There was no funding and sponsorship organization.
Availability of data and materials
We have sent all the available data and we do not want to share the raw data as we are conducting related study.
Authors’contributions
ZB wrote the proposal, participated in data collection, analyzed the data and drafted the paper. TA and DA approved the proposal with some revisions and participated in data analysis. All the authors revised the subsequent drafts of the paper, read, and approved the final manuscript.
Ethics approval and consent to participate
Consent for publication
Not applicable.
Competing interests
All the authors declare that they have no competing interests.
Publisher’s Note
Springer Nature remains neutral with regard to jurisdictional claims in published maps and institutional affiliations.
Received: 15 March 2019 Accepted: 26 April 2019
References
1. Lutter KDC. GUIDING PRINCIPLES FOR COMPLEMENTARY FEEDING OF The breastfed child. 2001.
2. UNICEF/WHO. Indicators for assessing infant and young child feeding practices PART 1 DEFINITIONS. Washington D.C., USA; 2008. 3. UNICEF. INFANT AND YOUNG CHILD FEEDING; CURRENT STATUS +
PROGRESS. 2016.
4. Ethiopia CSA, ICF International. Ethiopia Demographic and Health Survey. Addis Ababa, Ethiopia and Calverton. USA: Maryland; 2011. p. 2012. 5. Ethiopia CSA, ICF. Ethiopia demographic and health survey; key indicators
report. Ethiopia, Rockville, Maryland and USA: Addis Ababa; 2016. 6. Hockstein E. Infant and young child feeding practices monitoring tool and
guide; 2011.
7. World Health Organization. Infant and young child feeding counselling: an integrated course;Trainer’s guide. 2006;
8. Asfaw M, Wondaferash M, Taha M, Dube L. Prevalence of undernutrition and associated factors among children aged between six to fifty nine months in Bule Hora district , South Ethiopia. BMC Public Health. 2015; 15(41):1–9.
9. Ocampo-guirindola ML, Garcia-malabad CJ, Valdeabella-maniego MLM, Punzalan SLM. Association between dietary diversity score and nutritional status of Filipino children aged 6-23 months. Philipp J Sci. 2016;145(1):57–68. 10. Tessema M, Belachew T, Ersino G. Feeding patterns and stunting during
early childhood in rural communities of Sidama, South Ethiopia. PanAfrican Med J. 2013;14(75):1–12.
11. Alambo KA. The prevalence of diarrheal disease in under five children and associated risk factors in Wolitta Soddo town, southern, Ethiopia. ABC Res Alert. 2015;3(2):12–22.
12. Mengistie B, Berhane Y, Worku A. Prevalence of diarrhea and associated risk factors among children under-five years of age in eastern Ethiopia : a cross-sectional study. Open J Prev Med Preval. 2013;3(7):446–53.
13. Fekadu Y, Mesfin A, Haile D, Stoecker BJ. Factors associated with nutritional status of infants and young children in Somali Region , Ethiopia : a cross-sectional study. BMC Public Health [Internet]. BMC Public Health; 2015; 15(846):1–9. Available from:https://doi.org/10.1186/s12889-015-2190-7
14. Gebremedhin S, Ph D, Baye K, Ph D, Bekele T, Phil M, et al. Predictors of dietary diversity in children ages 6 to 23 mo in largely food-insecure area of south Wollo , Ethiopia. Nutrition [Internet] Elsevier Inc. 2014;33(2017):163–8 Available from:https://doi.org/10.1016/j.nut.2016.06.002.
15. Beyene M, Worku AG, Wassie MM. Dietary diversity, meal frequency and associated factors among infant and young children in Northwest Ethiopia : a cross- sectional study. BMC Public Health [Internet]. BMC Public Health; 2015;15(1007):1–9. Available from:https://doi.org/10.1186/s12889-015-2333-x
16. Agedew E, Demissie M, Misker D, Haftu D. Early initiation of complementary feeding and associated factors among 6 months to 2 years young children , in Kamba Woreda , south West Ethiopia: a community based cross sectional study. Nutr Food Sci. 2014;4(6).
17. Mekbib E, Shumey A, Ferede S, Haile F. Magnitude and factors associated with appropriate complementary feeding among mothers having children 6-23 months-of-age in northern Ethiopia ; a community-based cross-sectional study. Int J Nutr Food Sci. 2014;2(2):36–42.
18. Yemane S, Awoke T, Gebreslassie M. Timely initiation of complementary feeding practice and associated factors among mothers of children aged from 6 to 24 months in Axum town , North Ethiopia. Int J Nutr Food Sci. 2014;3(5):438–42.
19. Deme GG, Bekele SA, Argaw MD, Berhane Y. Factors associated with early initiation of complementary feeding in Bishoftu town , Oromia, Ethiopia. Open Access Libr J. 2015;2(e1949):1–9.
20. Gatahun EA, Abyu DM. Dietary Diversity Feeding Practice and Determinants among Children Aged 6–23 Months in Kemba Woreda , Southern Ethiopia Implication for Public Health Intervention. Nutr Food Sci. 2015;s13(213003). 21. Khanal V, Sauer K, Zhao Y. Determinants of complementary feeding practices among Nepalese children aged 6–23 months : findings from demographic and health survey 2011, BMC Pediatr. BMC Pediatr. 2013;13(131).
22. Shumey A, Demissie M, Berhane Y. Timely initiation of complementary feeding and associated factors among children aged 6 to 12 months in northern Ethiopia : an institution-based cross-sectional study. BMC public health [internet]. BMC public health; 2013;13(1):1. Available from: BMC Public Health. 23. Tamiru D, Aragu D, Belachew T. Survey on the introduction of complementary
foods to infants within the first six months and associated factors in rural communities of Jimma Arjo. Int J Nutr Food Sci. 2013;2(2):77–84.
24. Kassa T, Meshesha B, Haji Y, Ebrahim J. Appropriate complementary feeding practices and associated factors among mothers of children age 6–23 months in southern Ethiopia, 2015. BMC Pediatr [internet]. BMC Pediatr; 2016;16(131):1–10. Available from:https://doi.org/10.1186/s12887-016-0675-x
25. Dewey KG, Brown KH. Update on technical issues concerning complementary feeding of young children in developing countries and implications for intervention programs. Food Nutr Bull. 2003;24(1):5–28. 26. FAO/WHO. Human Vitamin and Mineral Requirements. Bangkok, Thailand;
2002.
27. Senarath U, Agho KE, Akram DES, Godakandage SSP, Hazir T, Jayawickrama H, et al. Comparisons of complementary feeding indicators and associated factors in children aged 6-23 months across five south Asian countries. Matern Child Nutr. 2012 Jan;8(SUPPL. 1):89–106.
28. Senarath U, Dibley MJ. Complementary feeding practices in South Asia : analyses of recent national survey data by the South Asia infant feeding research network. Matern Child Nutr. 2012;8:5–10.
29. Semahegn A, Tesfaye G, Bogale A. Complementary feeding practice of mothers and associated factors in Hiwot Fana specialized hospital, eastern Ethiopia. PanAfrican Med J. 2014;18(143).
30. Daba AK, Ersado ME. Family Medicine & Medical Science Research Impact of community based Management of Acute Malnutrition Integrated Nutrition Education on infant and young child feeding knowledge and practice of mothers or caregivers in Dilla Zuria Woreda , southern Ethiopi. Fam Med Med Sci Res. 2015;4(5).
31. Owino V. Complementary feeding practices and nutrient intake from habitual complementary foods of infants and children aged 6-18 months old in LUSAKA, Zambia. African J Food, Agric Nutr Dev. 2008;8(1):28–47. 32. Haile D, Belachew T, Berhanu G, Setegn T, Biadgilign S. Complementary feeding practices and associated factors among HIV positive mothers in Southern Ethiopia. J Heal Popul Nutr [Internet]. BioMed Central; 2015;35(5): 1–9. Available from: ???
33. Ethiopia health and nutrition research institute. Composition table for use in ethiopia part ill.
34. Gibson RS, Abebe Y, Hambidge KM, Arbide I, Teshome A, Stoecker BJ. Inadequate feeding practices and impaired growth among children from subsistence farming households in Sidama, southern Ethiopia. Matern Child Nutr 2009;260–75.
35. Baye K, Guyot J, Mouquet-rivier C. Nutrient intakes from complementary foods consumed by young children ( aged 12–23 months ) from north Wollo , northern Ethiopia : the need for agro-ecologically adapted interventions. Public Health Nutr. 2012;16(10):1741–50.
36. Bs RC, Bs LH, Bs MJS. Contribution of complementary food nutrients to estimated total nutrient intakes for rural Guatemalan infants in the second semester of life. Asia Pac J Clin Nutr. 2010;19(August):481–90.
37. Vossenaar M, Solomons NW. The concept of“critical nutrient density”in complementary feeding : the demands on the“family foods”for the nutrient adequacy of young Guatemalan children with continued breastfeeding. Am J Clin Nutr. 2012;11:859–66.
38. Faber M. Complementary foods consumed by 6–12-month-old rural infants in South Africa are inadequate in micronutrients. Public Health Nutr. 2004;8(4):373–81.