www.scienceworldjournal.org ISSN 1597-6343
NUCLEAR AND ATOMIC METHODS APPLIED IN THE
DETERMINATION OF SOME HEAVY POLLUTING ELEMENTS IN
SOME SOIL SAMPLES AROUND INDUSTRIAL LOCATIONS IN
KANO-NIGERIA
*Maharaz Mohammed Nasir, **Rakiya Aliyu
*Physics Departments, Federal University, Dutse – Nigeria
**Kano University of Science and Technology, Wudil – Nigeria
*Corresponding author E-mail: [email protected]
ABSTRACT
Heavy metals (HM) can have a serious impact if released into environment even in trace quantities. These can enter into food chain from aquatic and agricultural ecosystems and threaten human health indirectly. An experiment was carried out to investigate some heavy elements from soil samples of different industrial locations of Kano state, Nigeria. The techniques used were Neutron Activation Analysis (NAA) and Atomic Absorption Spectrometry (AAS). The order of average contents of metals in soil samples was Mn>Fe>Zn>Cu>Pb>Cd>Cr>Ni and their concentration values ranged from (31.8 to 18.1), (21.1 to 10.3), (8.8 to 2.01), (7.17 to 1.72), (4.02 to 1.71), (2.18 to 0.19), (1.71 to 0.22) and (0.28 to 0.21) mg/kg, respectively. The results also indicated that Fe contents are higher than for Pb in each location and the two different techniques have shown good agreement with each other. The concentrations are within acceptable limits.
Keywords:
Heavy metals, Neutron Activation Analysis, Atomic Absorption Spectrometry, Soil samplesINTRODUCTION
Environment and health related problems have become a major global concern in the recent years. Some northern Nigerian states are facing a serious problem about heavy metals toxicity which contaminates
their environment. In Zamfara State, a series of lead poisoning led to the deaths of at least 163 people between March and June 2010 including one hundred and eleven children (BBC News, 2010). Some heavy metals are naturally occurring elements found in soils and rocks and another source is from chemical emission in the manufacturing industries. The most important sources of heavy metals in the environment are the anthropogenic activities such as mining, smelting procedures, steel and iron industries, chemical industries, traffic, agriculture as well as domestic activities. The presence of heavy metals in soil can affect the quality of food, ground water, micro-organisms activity, plants growth, etc (Tlustos et al, 2007). The main objective of this research is to determine the level of soil pollution with some heavy metals by using two different techniques; Neutron Activation Analysis (NAA) and Atomic Absorption Spectrometry (AAS).
Kano state has industrial activity for over forty years, being one of the most important industrial states in the northern part of Nigeria. The population of the State is estimated at over 10 million during the 2006 National population census. It is a commercial nerve centre of Nigeria.
MATERIALS AND METHOD
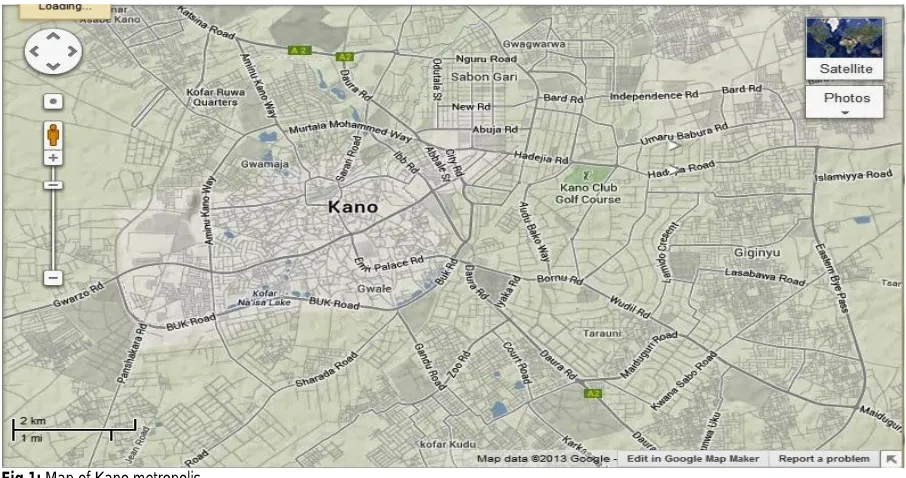
The study locations are within Kano metropolis, Nigeria (figure 1). It is situated between latitudes 11025’N to 12047’ and longitude 8022’E to
8039’E east, and 472m above sea level. Most of Kano’s industries are
located around Bompai, Sharrada, Challawa and Kofar Ruwa areas (Mohan, 2005).
Ful
l Le
ngt
h
R
es
ea
rc
h
Fig 1: Map of Kano metropolis
Neutron Activation Analysis (NAA)
The complex nature of soil requires the choice of Neutron Activation Analysis (NAA), available at the Nigerian Research Reactor (NIRR-1), Center for Energy Research and Training (CERT), Ahmadu Bello University (ABU), Zaria. NAA is a quantitative and qualitative method for the precise determination of a number of major, minor and trace elements in different types of geological, environmental and biological samples. It is based on nuclear reaction between neutron and target nuclei of a sample material. It is a useful method for the simultaneous determination of a large number of major, minor and trace elements in ppb-ppm range without chemical separation (Christache and Duliu, 2007). If a sample is subjected to a neutron flux Ф (E), radio-isotopes are formed at a rate;
= ∫Ф( ) ( )ƒԁ (1)
Where, = is the number of target prior to irradiation, ( ) is the reaction cross section for the production of corresponding radio-isotopes from the isotopic abundance of the target element, m is the mass of the target, A is the atomic weight of the target, and NA is the
Avogadro’s number. For a constant Energy flux, like thermal neutrons, the equation becomes.
= ∅( ) ( )ƒ (2)
The number of radio-isotopes decaying in the time interval between the end of irradiation and the end of counting is
= (1− )(1− ) (3)
The number of photons emanating from the radioactive decay that are detected, S, will be a lot smaller than the predicted value due to many factors like; the geometry dependant photo peak efficiency ( ), the gamma emission probability ǀ(E), the geometric correction factor Cg, and the self-absorption correction factor k. Including these factors, the total number of detected photons becomes,
= = (4)
Combining equations (2) through (4), the thermal neutron flux will have an expression
Ф( ) =
ԑ (5)
Calculation of Concentrations Using Gamma Ray Counts The concentrations of the investigated elements in samples were determined in comparison to standard material with known concentration. The relative method is the most simple and accurate way of quantifying the concentration of an element. In this method, sample and the standard are irradiated together and both are counted under exactly the same conditions by the same detector. This procedure eliminates any uncertainty in the parameters e.g. cross- sections, neutron flux, decay scheme, and detector efficiency. Therefore, the formula for the determination of elements using the comparative method (Clascock, 2004) is:
= (6)
Where, =mass of element in unknown sample = mass of element in the standard
=Count rate of the unknown sample
=Count rate of the standard
=Decay time
Atomic Absorption Spectrometry
energy level to a higher energy level (Ingle and Crouch, 1988). The concentration of an element can be determined using the Beer-Lambert law (Christache and Duliu, 2007), that is
= (7)
Where A is the absorbance (no units, since = log ). Is is the molar absorptivity with unit of Lmol-1 cm-1.
Is is the path length of the sample, that is the optical path.
Is is the concentration of the compound in solution, expressed in mol L-1.
In AAS, the sample is atomized, that is, converted into ground state free atoms in vapour state and a beam of electromagnetic radiation emitted from excited lead atoms is passed through the vaporized sample. Some of the radiation is absorbed by the lead atoms in the sample.
Sample Collection and Preparation
Soil samples were collected from Bompai, Kofar Ruwa, Challawa and Sharada industrial areas. From each site, 5 soil samples were collected from an area of 0.5m x 0.5mm up to the depth of 15cm. In this way a total of 25 soil samples were collected from all four sites using clean trowel, placed in plastic bags through a 2-mm mesh sieve, through a 1-mm mesh sieve. Each sample containing soil grain weighing about 200g was stored in standardized polyethylene containers. For easy identification the soil samples were labelled as shown in table 1.
The NIRR-1, at CERT, A.B.U. Zaria was used for this work. During the irradiation, neutrons of flux 5.0x10¹¹ncm-2s-1 were accessed. Using
rabbit carriers, the samples and the standard were sent into the reactor through a pneumatic transfer system which uses pneumatic pressure. The samples were irradiated with a thermal neutron flux of 5.0x10¹¹ncm-2s-1 for 6 hours. The whole system is equipped with
electronic timers which help in monitoring the exact irradiation and decay times. At the end of irradiation the vials were returned from the reactor with the help of pneumatic pressure to an ejector. It was then allowed to decay by allowing the activity of the sample to fall down. Samples are usually handled when the activity is within the acceptable
handling limit. The sample were then taken to a detecting set up consisting of a high purity germanium(HPGe) detector, connected to a PC-based multichannel analyzer (M.C.A) in a fixed sample to detect geometry. For short lived elements, the first counting was done immediately and followed by a second one two hours later. The samples were then allowed to decay further for the analysis of long life elements. Counting after 3 days is referred to as first long count and is done in 30 minutes. The samples were then further cooled for another 7 days after which they were ready for second long count for a period of 1 hour. Using the procedure for all the samples, the results obtained are presented in table 2. An Atomic Absorption Spectrometry used in this work is the AAS-AVANTA GBC with hollow cathode lamp (HCL) used at the Faculty of Agriculture, Bayero University, Kano. Measurements were made separately for each element of interest from the collected samples using the calibration curve-absorbance versus concentration.
RESULTS AND DISCUSSION
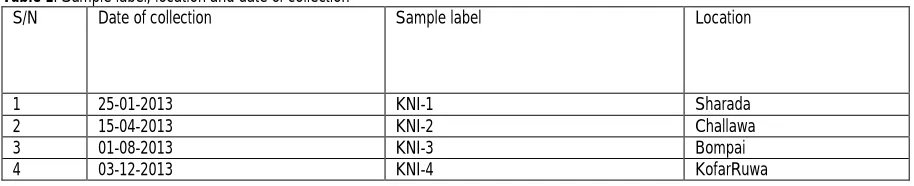
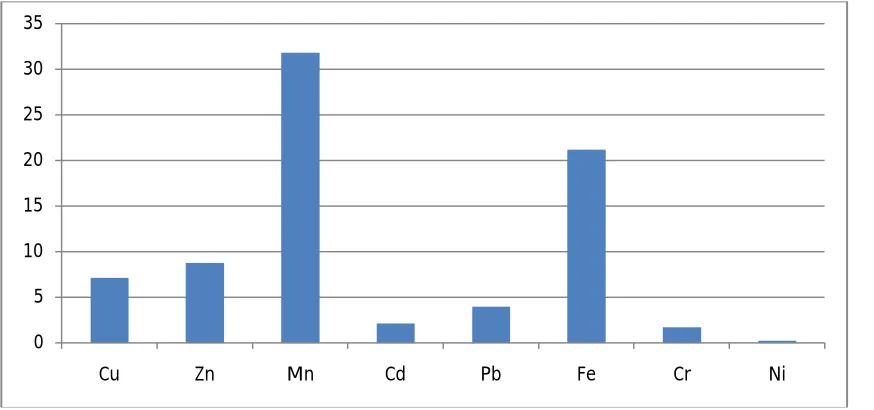
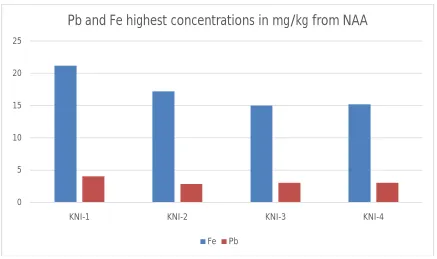
Table 1, shows the locations, labels and the date of sample collection. The samples were collected from the two different levels, surface (0cm depth) and 15cm depth. Table 2 and 3 present the eight identified heavy metals and their concentrations by AAS and NAA in this study, respectively. In 20 soil samples collected in the vicinity of the four industrial locations of Kano state, all the eight elements were present in all the soil samples and their concentrations are reported in mg/kg. For the soil samples, the highest levels corresponded to Mn and Fe followed by Zn. The lowest levels of metals were recorded for Cr and Ni. Meanwhile, the elemental concentrations in soil samples are in increasing order of Mn>Fe>Zn>Cu>Pb>Cd>Cr>Ni, respectively. The concentrations of Pb and Fe were determined by NAA and AAS in order to perform a comparison of the results from the two different techniques. Comparison results obtained are as presented in fig 1, with the highest value for Mn and the lowest value for Ni, from all the locations. Fig 3 and 4 show the concentration differences in mg/kg between Fe and Pb from all the four sample locations. The Fe contents are much higher than that of Pb in each location. The two different techniques, AAS and NAA, have shown a good agreement to each other. The concentrations of the other elements were determined by AAS only.
Table 1: Sample label, location and date of collection
S/N Date of collection Sample label Location
1 25-01-2013 KNI-1 Sharada
2 15-04-2013 KNI-2 Challawa
3 01-08-2013 KNI-3 Bompai
Table 2: Elements identified and their concentrations by AAS in mg/kg
Sample
labelled
Depth
(cm)
Cu Zn Mn Cd Pb Fe Cr Ni
KNI-1 0 7.17 8.80 30.9 0.63 3.51 21.1 1.71 Nd
15 6.63 5.98 31.8 1.25 2.89 20.2 0,92 Nd
KNI-2 0 2.22 3.71 20.9 1.73 1.71 15.1 Nd Nd
15 1.95 2.68 20.8 2.18 3.00 13.8 Nd Nd
KNI-3 0 5.38 7.61 18.1 0.35 3.11 15.2 Nd Nd
15 4.13 5.61 20.2 1.00 3.00 13.8 Nd Nd
KNI-4 0 2.12 3.26 20.3 0.25 2.85 14.3 0.78 0.212
15 1.72 2.01 20.2 0.19 3.00 12.6 0.22 0.281
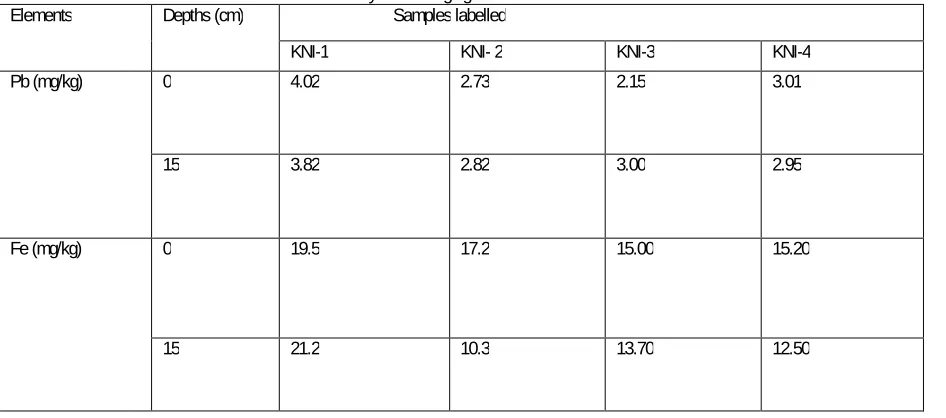
Table 3: Elements identified and their concentrations by NAA in mg/kg Elements Depths (cm) Samples labelled
KNI-1 KNI- 2 KNI-3 KNI-4
Pb (mg/kg) 0 4.02 2.73 2.15 3.01
15 3.82 2.82 3.00 2.95
Fe (mg/kg) 0 19.5 17.2 15.00 15.20
15 21.2 10.3 13.70 12.50
Table 4: Elemental concentrations reported in literature for Europe and United Nations and the highest value obtained from this work
Elements Literature values KNI-1 KNI-2 KNI-3 KNI-4
European media [8] World media [9]
Pb(mg/kg) 22.6 35 4.02 3.0 3.1 3.0
Cu(mg/kg) 13 30 7.17 2.2 5.4 2.1
Zn(mg/kg) 52 90 8.8 3.7 7.6 3.3
Mn(mg/kg) 650 1000 31.8 21 20 20
Fe(mg/kg) 35.1 40 21 15 15 14
Ni(mg/kg) 18 50 Nd Nd Nd 0.3
Cd(mg/kg) 0.145 0.35 1.3 2.2 1.0 0.3
Cr(mg/kg) 60 70 1.7 Nd Nd 0.8
Nd = Not detected
For the majority of metals, pronounced maximum concentration values at surface levels(0cm depth) and minimum at 15cm depth in most of the locations. For Pb, the highest concentration was found at Sharada followed by KofarRuwa, and the lowest found at Challawa and Bompai areas. In table 4, all obtained concentration values for the elements were
compared with those provided in literature for Europe (Salminea, 2005) and the United Nations (Bowen, 1979), which indicate that all the concentrations obtained did not exceed recommendations by the standard international organizations.
Fig. 2: The highest concentrations in mg/kg against each element
0
5
10
15
20
25
30
35
Cu
Zn
Mn
Cd
Pb
Fe
Cr
Ni
Fig. 3: Pb and Fe highest concentrations in mg/kg from AAS
Fig. 4: Pb and Fe highest concentrations in mg/kg from NAA
0 5 10 15 20 25
KNI-1 KNI-2 KNI-3 KNI-4
Pb and Fe highest concentrations in mg/kg from AAS
Fe Pb
0 5 10 15 20 25
KNI-1 KNI-2 KNI-3 KNI-4
Pb and Fe highest concentrations in mg/kg from NAA
Fe Pb
CONCLUSION
Atomic Absorption Spectrometry (AAS) and Neutron Activation Analysis (NAA) were used to determine the level of pollution of some soil samples with heavy metals in some major industrial areas in Kano state. The experimental results obtained in this research demonstrated the capability of these analytical methods of high sensitivity and precision to be applied on a large spectrum of environmental samples. The soil samples from these locations recorded no heavy metals loading (contamination) or pollution. Until the current investigation, data on metals level using the two different analytical techniques were not recorded for the study area; therefore, the current results should be of special interest as reference values in future evaluations of the heavy metals concentrations, which we deem very necessary. By monitoring the anthropogenic activities as well as domestic activity on the environment, this study underlines the need for replicating periodic studies (two years duration) on the environment in addition to the evaluation of heavy metals on human health.
ACKNOWLEDGEMENT
The Authors wish to thank the managements of Faculty of Agriculture, Bayero University Kano and the Centre for Energy Research and Training (CERT), ABU Zaria for advice and providing opportunity to use their facilities.
REFERENCES
BBC News (2010). “Nigeria-lead poisoning kills 100 children in north. Retrieved 4 June, 2010.
Bowen, H.J.M. (1979). Environmental chemistry of the Elements, Academic press, New York.
Clascock, M.D. (2004). An overview of Neutron Activation Analysis. 22 Research Reactor, University of Missouri Columbia, MO 65211. Retrieve on 12th may, 2011 from www.missouri.edu/archlab.htm
.
Cristache, O.C. and Duliu, G.(2007). Determination of Elemental content in geological Samples, National institute for Nuclear physics and Engineering, Bucharest, Romania.
Ingle, J.D.J. and S.R. Crouch, (1988). Spectrochemical Analysis, Prentice Hall, New Jersey.
Mohan, M. (2005). ”Urban land use/land cover change detection in national capital region, Delhi: A case study of Faridabad district, Cairo, Egypt”. FIG working week.
Salminea, R. ed. (2005). Geochemical Atlas of Europe, Part I. Background Information, Methodology and Maps, ESPOO, Geological survey of Finland. URL:http://www.gtk.fi/pubi/foregsatlas.
Tlustos P., Szakova J., Vysloizilova M., Pavlicova D., Weger J.,Javovska H. (2007). Variation in the uptake of Arsenic, cadmium, lead and zinc by different species of willows salixspp: grown in contaminated soil, central European. Journal of Biology 2(2), 254.