Ship rat demography and diet following possum control in a mixed
podocarp–hardwood forest
Peter J. Sweetapple* and Graham Nugent
Landcare Research, PO Box 40, Lincoln 7640, New Zealand
* Author for correspondence (Email: sweetapplep@landcareresearch.co.nz)
Published on-line: 3 December 2007
___________________________________________________________________________________________________________________________________ Abstract: Control of one pest species may permit increases in abundance of other pests, thereby reducing the overall net benefit from pest control. We provide evidence that control of introduced possums (Trichosurus vulpecula) may increase ship rat (Rattus rattus) abundance in some New Zealand native forests. Ship rat abundance in a podocarp–hardwood forest was assessed using simple interference indices over 14 years (1990–2004) that included two aerial possum-poisoning operations (1994, 2000). Ship rat demography and rat and possum diet were measured from June 2001 to June 2003 when the rat population was increasing after the 2000 poisoning. Mean ship rat abundance indices increased nearly fivefold after possum control and remained high for up to 6 years after the 1994 poisoning. Rat fecundity was high (50–100% of adult females breeding), even during winter, and young animals dominated the population (73% in age classes 1–3) in 2001–2002 when rat numbers were increasing. During 2002–2003, rat abundance stabilised, without marked winter or spring reductions, the population aged significantly (only 32% in age classes 1–3), and fecundity declined to low levels (4–27% of adult females breeding). Although seeds and fruit dominated the diet of rats driving population recovery after control (74.0% of total diet by dry weight), rat fecundity was instead closely correlated with the proportional consumption of invertebrates (r = 0.91). Juvenile survival was correlated with proportional seed consumption (r
= 0.75), while adult survival was correlated with combined seed and invertebrate consumption (r = 0.83). Adult rats ate more seeds and fewer invertebrates than juvenile rats. Seeds and fruit also dominated possum diet (52.2% of total diet). These results are consistent with the hypothesis that increased rat abundance following possum control is a consequence of greater availability of, or reduced competition for, seeds and fruit.
___________________________________________________________________________________________________________________________________ Keywords: competition; fruit; invertebrates; Rattus rattus; seed; Trichosurus vulpecula
Introduction
Conservation of indigenous biodiversity frequently requires removal of the major threats to the desired patterns of ecosystem function. Where a multitude of interacting threats are present, a lack of resources often precludes control of more than one or two of the worst threats. Although the economic justification for this ‘worst-pest’ approach is obvious, the ecological consequences are not as clear, because the direct and indirect interactions between threats are multifaceted and not easy to predict (Sinclair & Krebs 2002). Controlling one pest species where more than one is present therefore poses risks in the form of undesirable numerical or functional responses by the pests that are not controlled (e.g. Murphy & Bradfield 1992; Corbett 1995; Murphy et al. 1998; Norbury et al. 2002; Steen et al. 2005). Here we focus on the potential for such risks in the context of the interactions between two of the most important conservation pests in mainland
New Zealand forests, brushtail possums (Trichosurus vulpecula) and ship rats (Rattus rattus) (Cowan 1990; Innes 1990).
The New Zealand Department of Conservation controls possums on about one million hectares in New Zealand to mitigate the ecological impacts of this introduced mammalian herbivore (Parkes & Murphy 2003). Ninety percent of this control effort is by pulsed operations at intervals of 3–7 years (J. Parkes, Landcare Research, Lincoln, NZ, pers. comm.). Most operations target only possums, although a host of other mammalian pests are usually present (King 2005).
Ship rats are ubiquitous in mainland New Zealand forest (Innes 1990). High proportions of their populations are frequently killed in possum-poisoning operations, although they usually recover to previous densities within 6 months (Innes et al. 1995; Miller & Miller 1995; Murphy et al. 1999). As a consequence, the typical outcome for most pulsed possum control is an uncontrolled ship rat population in the presence
of a low-density possum population for most of the 3–7-year possum control cycle.
Food supply is the primary regulator of population growth rate in vertebrates (Sinclair & Krebs 2002). Rodents respond positively and vigorously to increases in food supply in many areas around the world (e.g. Jensen 1982; Pucek et al. 1993; Ostfeld et al. 1996; Wolff 1996; Henry 1997). Food supply is the driver for rodent eruptions in New Zealand forests (Blackwell et al. 2003). Seeds and fruit are a major component of forest-dwelling ship rat diet (Best 1969; Daniel 1973; Innes 1979; Clout 1980; Gales 1982), and New Zealand ship rat populations sometimes erupt after heavy fruiting or seeding of forest trees (Daniel 1978; King & Moller 1997; Dilks et al. 2003, Harper 2005), although not always (Efford et al. 2006). Seeds and fruit are also strongly preferred foods of possums (Nugent et al. 2000; Sweetapple 2003), and fruit production and/or survival in some forest tree species sometimes increases following possum control (Cowan & Waddington 1990; Cowan 1991; Brockie 1992), This raises the possibility that, once recovered from the direct effects of possum control operations, ship rat densities may exceed pre-control levels, because of enhanced fruit and seed production and/or reduced competition from possums.
During a 14-year study of possum impacts in a New Zealand podocarp–hardwood forest (Nugent et al. 1997; Sweetapple et al. 2002), we observed greatly increased and sustained activity of ship rats at baits and traps set for possums over 6 years following a possum poisoning operation in 1994, compared with the 3.5 years before possum control. To confirm and quantify this apparent change in rat abundance, we initiated a snapback trapping study in 1999 to monitor ship rat population levels, and calibrated these with lure disturbance rates at possum traps and baits before and after a second possum poisoning operation in 2000. We also measured ship rat demography and diet, and possum diet, during and after ship rat population recovery following the possum poisoning operation in 2000, to investigate the relationship between rat diet and demography, and dietary overlap between rats and possums. We hypothesised that ship rat abundance would exceed the 1990–1994 pre-possum-control levels because of an increase in the availability of seeds and fruit to the post-control rat population owing to increased production and/or reduced competition from possums. We therefore predicted that fruits and seeds would dominate post-control ship rat diet, particularly during the first post-control year while the rat population was recovering from the direct effects of the poison operation.
Methods
Study areaThe study took place in a block of forest (1 × 4 km) in the headwaters of the Waihaha and Waitaia catchments, between 700 and 800 m a.s.l. on the south-eastern flank of the Hauhungaroa Range, Pureora Forest Park, in the central North Island (38º45’S, 175º35’E). These forests contain high densities of emergent Dacrydium cupressinum (rimu), Podocarpus hallii (Hall’s tōtara),
Prumnopitys ferruginea (miro) and Prumnopitys taxifolia (mataī), over a mixed hardwood canopy dominated by Weinmannia racemosa (kāmahi) and
Quintinia serrata (tawheowheo). Forest composition within the study area is described in detail in Smale & Smale (2003).
At the start of the study in 1990, ship rats had been present in the study area for over a century (Atkinson 1973) and possums for at least 40 years (Sweetapple et al. 2002). With the exception of some commercial possum-fur hunting in the 1970s and 1980s, the possum population was uncontrolled before 1994. In August 1994, possum abundance was reduced from 24 to <1 100TN–1 (captures per 100 trapnights)
by aerial application (across 20 000 ha) of chopped carrots impregnated with 0.15% 1080 toxin (sodium monofluroacetate) (Sweetapple et al. 2002). Numbers recovered to 8 100TN–1 by 2000 (Sweetapple et al.
2002), then were again reduced to <1 100TN–1 in
August 2000 by a repeat of the 1994 poison operation, before recovering again to 6 100TN–1 by August 2004
(unpubl. data). The study area was located deep within the aerially poisoned area, at least 2.5 km in from the forest and poison operation boundary.
Rat abundance and demography
Lure was recorded as disturbed only if at least half the lure was gone. No lure-disturbance data were recorded between April 1994 and August 1998.
Lure disturbance is not commonly used as an index of rat abundance in New Zealand, so we calibrated it against snapback-trap capture rate, which is a frequently used index (King & Moller 1997). In March 1999 and March and May 2000, 20 snapback traps (Supreme Eziset) were set along each of four 400-m-long possum trap lines. Rat traps were uncovered, placed 2 m south of each possum trap (20-m intervals), and set for 3 nights.
After the August 2000 possum control operation, an intensive study of rat density, demography, and diet was undertaken. Lure disturbance on cyanide baits and rat snapback-trap capture rates were measured four times a year (August, November, March, June) from August 2000 to June 2003. This work was undertaken using four sets of transects, with each set located randomly within the study area and each set comprising four parallel transects spaced 200 m apart. One transect within each set was used each assessment so individual transects were measured no more than once a year. During each assessment, lure disturbance was measured on the first night and rat capture rates measured on the following three nights. Forty cyanide baits at 10-m intervals and 20 rat snapback traps at 20-m intervals were set along each transect 20-measured. Rat traps were baited with peanut butter dyed green with food colouring and placed under 10-mm-mesh wire tunnels to exclude birds.
The number of ship rats captured was expressed as a percentage of the total number of trap-nights after adjustments for sprung traps (Nelson & Clark 1973). Capture rates were compared (Pearson correlation coefficient) with lure disturbance rates to calibrate the latter against capture rate as an index of ship rat abundance. To investigate the effect of possum control on rat abundance, lure disturbance rates before possum control was initiated (August 1994) were compared with later assessments using the Generalised Least Squares procedure in the statistical package R (Pinheiro et al. 2006). Initially, a model with an autocorrelation term, to account for repeated measures in the data, was constructed. The autocorrelation model was dropped because it explained a similar amount of variation as a model without autocorrelation.
The number of live foetuses per female, paunched weight (weight of carcass with stomach and reproductive tract removed), and tooth wear index (Karnoukhova 1971; illustrated in Innes 1990) were measured for all rats captured. Stomachs were retained for diet analysis.
Rat diet
No rats were captured during three trapping sessions in the 7 months after the August 2000 possum control
operation, but rats were then captured during nine successive assessments from June 2001 to June 2003. Diet composition data were obtained from 5–36 stomachs from each of these collections, totalling 218 stomachs (Table 1). A further 30 stomachs (not shown in Table 1) were opened but 22 of these were empty (food items < 0.5 g wet weight) and the contents of the remaining eight were too mixed to sort. The contents of all suitable stomachs were sorted from all collections before June 2002. For later collections when large numbers of ship rats were captured, stomachs from all juveniles (age classes 1 and 2), breeding (pregnant or lactating) females, and a random selection of remaining stomachs, totalling 29–36 per collection, were sorted (Table 1). Individual food items were layered in most stomachs, allowing their separation by a layer separation method developed for possum diet analysis (Sweetapple & Nugent 1998). Food items were identified to species level for fruits (pericarp and small seeds from berries and drupes) and seed (endosperm from large-seeded fruits) separately, but all other foods were identified as either invertebrates, herbs, fungi, feathers, bark, wood, litter/moss, or unidentified material. Fruits and seeds were identified by comparison with reference material. Total wet weight of food material was recorded for all stomachs opened, including empty stomachs and those with mixed contents, by subtracting the wet weight of parasitic nematodes, bait material, and the stomach tissue from the wet weight of their unopened stomachs. Food items were oven dried at 70ºC for 24 h and weighed, then the percentage dry weight was calculated by item for each stomach.
Possum diet
Stomachs from 26 possums poisoned between June 2001 and June 2003 during cyanide bait disturbance assessment were analysed to investigate dietary overlap between possums and ship rats. Possum stomach contents were sorted using the layer separation method. Food items were oven dried at 70ºC for 24 h and weighed, and their percentage dry weight calculated for each stomach.
Diet data analysis
were each analysed using the unbalanced (unbalanced anova) procedure in the statistical package GenStat. To
avoid prediction of dietary proportions under 0% and above 100%, percentage data were transformed using the following logit function:
In all cases, month (March, June, August, November), then year, and then status, and their second-order interactions were included in a model. Non-significant terms were removed sequentially to produce the minimum adequate model. Total stomach content data were log-transformed before analysis to stabilise residuals. Pairwise comparisons were tested using Duncan’s multiple range tests.
Linear relationships between mean monthly proportion of major food groups and fecundity (percentage of adult females breeding), rates of increase, and estimates of juvenile and adult survival were examined using Pearson correlation coefficients. Bait disturbance rates were used to estimate rates of increase because they were measured 3 months after the final collection of diet samples, allowing the addition of an extra ‘diet’–‘rate of increase’ data pair. We devised crude indices to measure rat survival. Juvenile survival was calculated as the log of the number of animals of age-class 3 captured at the next assessment over the number of juveniles captured in the current assessment. Adult survival was calculated as the log
Table 1. Number of ship rat and possum stomachs analysed for diet composition by month collected and, for ship rats, age, sex and breeding-status class. An additional 30 ship rat stomachs were opened but found to be empty or the contents too mixed to be sorted.
___________________________________________________________________________________________________________________________________ Ship rats
Year/ month Juveniles Adult Non-breeding Breeding Total Ship Total (tooth wear males adult females adult females rats possums class 1–2)
___________________________________________________________________________________________________________________________________ Year 1 (June 2001–June 2002)
June (01 + 02) 12 17 5 6 40 7
August 0 2 1 2 5 2
November 8 3 0 4 15 3
March 14 7 1 6 28 4
Year 1 total 34 29 7 18 88 16
Year 2 (August 2002–June 2003)
August 5 12 13 1 31 2
November 1 18 13 4 36 2
March 5 16 6 7 34 2
June 5 9 11 4 29 4
Year 2 total 16 55 43 16 130 10
Grand total 50 84 50 34 218 26
___________________________________________________________________________________________________________________________________
of the number of animals of age-classes 4–6 captured at the next assessment over the number of animals of age-classes 3 and 4 captured in the current assessment. Juvenile survival was correlated with diet of juveniles and fecundity; rates of increase and adult survival were correlated with diet of adult ship rats.
The proportions of juveniles and breeding females were compared between years using 2×2 contingency tables. Dietary overlap between possums and rats was quantified using Horn’s index (Horn 1966) following the procedures in Krebs (1989).
Untransformed data are presented in figures and tables and were obtained by first pooling and averaging data within years from June and August, and November and March separately, then calculating annual and total means. This was to reduce biases due to an unbalanced dataset (Table 1).
Results
Ship rat abundance
6.47, P < 0.0001). Because a percent index of animal abundance usually has a curvilinear relationship with absolute density, it was Poisson-transformed to approximate a linear index of animal density (Caughley 1977). Poisson-transformed lure disturbance rates for these same periods were, on average, 4.8 times higher after than before the 1994 control.
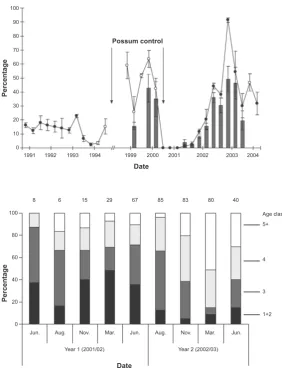
Ship rat snapback-trap capture rates ranged from 15.6% to 42.6% during the 18 months before the 2000 poison operation. No ship rats were captured for 7 months after the 2000 control. Capture rates then increased to pre-August 2000 levels by June 2002, and remained between 18.6% and 49.1% until trap-catch monitoring ceased in June 2003 (Fig. 1). Lure disturbance rates were strongly correlated with snapback-trap capture rates (catch rate = 1.48 + 0.96
Possum control
Date
Percentage
1991 1992 1993 1994 1999 2000 2001 2002 2003 2004
100
90
80
70
60
50
40
30
20
10
0
Figure 1. Lure disturbance rates at cyanide-paste baits (solid circles) and possum trap sites (open circles), and ship rat trap-catch rates (bars), at Waihaha from 1990 to 2004. Error bars are standard errors.
(lure disturbance rate); r = 0.96, F1,12 = 143.9, P < 0.001), indicating that they provided a similar index of relative abundance to snapback-trap capture rates.
Ship rat demography
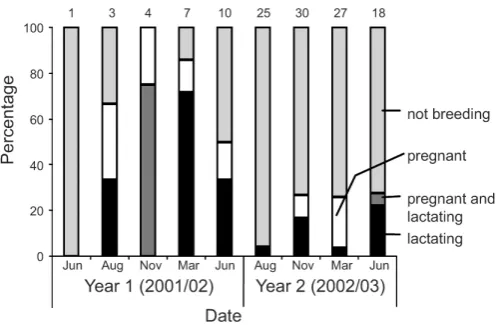
The demographic characteristics of the ship rat population 10–19 months after poisoning (Year 1; Fig. 2) were typical of a rapidly increasing population. Juvenile rats made up 39% of the catch and fecundity was high, with 64% of adult females breeding (pregnant or lactating). Proportionally fewer juveniles (10%) were caught during the following 12 months (χ2
1 = 48.4, P
<0.001; Fig. 2) and fecundity was also significantly lower than in year 1 with only 21% of adult females breeding (χ2
1 = 21.0, P <0.001; Fig. 3).
Percentage
100
80
60
40
20
0
Jun. Aug. Nov. Mar. Jun. Aug. Nov. Mar. Jun.
Year 1 (2001/02) Year 2 (2002/03)
Date
8 6 15 29 67 85 83 80 40
Age class 5+
4
3
1+2
Ship rat diet
Net wet weight of ship rat stomach contents differed between status groups (F3, 204 = 5.9, P < 0.001). Mean weights were 2.71 g for juveniles, 3.48 g for non-breeding adult females, 3.92 g for adult males, and 5.93 g for breeding females. Rats ate similar quantities of food in both years (F1, 204 = 0.04, P = 0.841) and each season (F3, 204 = 1.40, P = 0.244), and the differences between age-sex classes were also similar in both years (year × age-sex-class interaction term: F3, 192 = 1.62, P = 0.186).
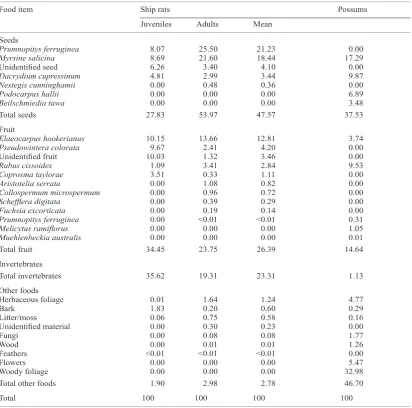
Seeds were the most important food group eaten by ship rats during the diet study, comprising 47.6% of total diet, with Prumnopitys ferruginea and Myrsine salicina seeds dominating this food group (Table 2). Fruit was the second most important food group at 26.4% of total diet, and comprised primarily of Elaeocarpus hookerianus, Pseudowintera colorata, Rubus cissoides
and unidentified fruit (Table 2). The balance of rat diet was almost entirely of invertebrates (23.3%) with other-foods at just 2.8% of total diet. Birds were found in trace amounts (feathers only) in two rat stomachs, and no other vertebrate remains were identified, although birds’ eggs may have been under-represented by our analysis as they are difficult to identify in stomachs.
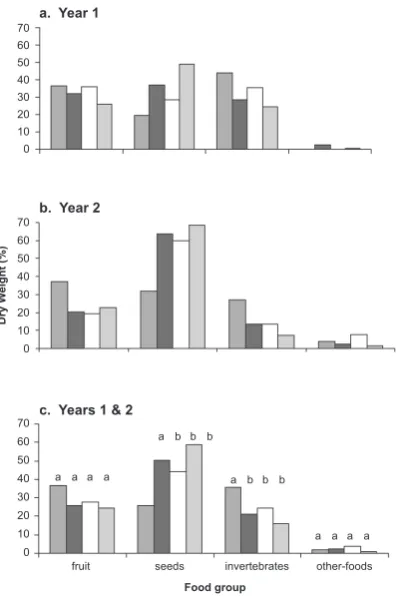
The proportional contribution of food groups to total diet varied between the two years of the diet study (Fig. 4). During the first year, when the ship rat population was increasing, rats ate more invertebrates (year 1: 33.2%, year 2: 13.3%; F1,210 = 41.8, ; P < 0.001) and less seed (year 1: 34.1%, year 2: 61.1%; F1,207 = 34.8, P < 0.001) and other foods (year 1: 1.1%, year 2: 4.5%; F1,210 = 10.0, P = 0.002) than in the second year when the rat population was stable (Fig. 4).
All four food groups varied seasonally in importance in rat diet (Fig. 5). Rats ate most invertebrates in late spring and late summer to early autumn (November and March) (F3, 210 = 15.6, P < 0.001), most seeds in
winter (August) (F3, 207 = 6.0, P < 0.001), and least fruit in late spring (November) (F1, 198 = 26.3, P < 0.001). Small quantities of ‘other foods’ were eaten, mainly in the autumn and winter of the second year (F3, 210 = 5.1, P = 0.002). The seasonal pattern of seed and fruit consumption varied significantly between the two years (season × year interaction terms: seeds, F3, 207 = 9.7,
P < 0.001; fruit, F3, 198 = 20.3, P < 0.001), probably reflecting differences in the relative abundance of seeds and fruit between the two years.
Diet composition varied significantly between age-sex classes (Fig. 4c). Juvenile rats ate less than half the proportion of seeds (F3, 207 = 3.3, P < 0.021) and more than twice the proportion of invertebrates (F3, 210
= 3.3, P < 0.022) as did breeding female rats. The mean proportion of seeds and invertebrates in adult male and non-breeding adult female rat diet was intermediate between that of juveniles and breeding females, but was not statistically significantly different from that of breeding females (Fig. 4c). Multiplying proportional diet data by mean wet weight of stomach contents reveals that breeding females ate 127%, 51% and 11% more seeds, fruit, and invertebrates, respectively, than non-breeding females.
Rat fecundity, survival, and rates of increase
The percentage of invertebrates in the monthly diet of adult ship rats was strongly correlated with fecundity (Table 3). The relationship between fecundity and invertebrate consumption by breeding females was similar to that of other adults (Fig. 6), suggesting that invertebrate availability drove breeding rather than adult females switching to invertebrate feeding when pregnant or lactating. The proportional consumption of seeds or fruit was strongly and positively correlated with rat survival and the instantaneous rate of population increase 3–6 months after diet assessment, but no diet parameter was strongly correlated to the instantaneous
Table 2. Mean percentage dry weight of food items in ship rat and possum stomachs during the 2-year diet study. Mean ship rat (juveniles and adults) diet data are weighted by the relative number of juvenile and adult samples analysed (Table 1). ___________________________________________________________________________________________________________________________________
Food item Ship rats Possums
Juveniles Adults Mean
___________________________________________________________________________________________________________________________________ Seeds
Prumnopitys ferruginea 8.07 25.50 21.23 0.00
Myrsine salicina 8.69 21.60 18.44 17.29
Unidentified seed 6.26 3.40 4.10 0.00
Dacrydium cupressinum 4.81 2.99 3.44 9.87
Nestegis cunninghamii 0.00 0.48 0.36 0.00
Podocarpus hallii 0.00 0.00 0.00 6.89
Beilschmiedia tawa 0.00 0.00 0.00 3.48
Total seeds 27.83 53.97 47.57 37.53
Fruit
Elaeocarpus hookerianus 10.15 13.66 12.81 3.74
Pseudowintera colorata 9.67 2.41 4.20 0.00
Unidentified fruit 10.03 1.32 3.46 0.00
Rubus cissoides 1.09 3.41 2.84 9.53
Coprosma taylorae 3.51 0.33 1.11 0.00
Aristotelia serrata 0.00 1.08 0.82 0.00
Collospermum microspermum 0.00 0.96 0.72 0.00
Schefflera digitata 0.00 0.39 0.29 0.00
Fuchsia excorticata 0.00 0.19 0.14 0.00
Prumnopitys ferruginea 0.00 <0.01 <0.01 0.31
Melicytus ramiflorus 0.00 0.00 0.00 1.05
Muehlenbeckia australis 0.00 0.00 0.00 0.01
Total fruit 34.45 23.75 26.39 14.64
Invertebrates
Total invertebrates 35.62 19.31 23.31 1.13
Other foods
Herbaceous foliage 0.01 1.64 1.24 4.77
Bark 1.83 0.20 0.60 0.29
Litter/moss 0.06 0.75 0.58 0.16
Unidentified material 0.00 0.30 0.23 0.00
Fungi 0.00 0.08 0.08 1.77
Wood 0.00 0.01 0.01 1.26
Feathers <0.01 <0.01 <0.01 0.00
Flowers 0.00 0.00 0.00 5.47
Woody foliage 0.00 0.00 0.00 32.98
Total other foods 1.90 2.98 2.78 46.70
Total 100 100 100 100
___________________________________________________________________________________________________________________________________
rate of increase 3 months after diet assessment (Table 3).
Comparison of possum and rat diet
Overall, possum and rat dietary overlap was 39% (Horn’s index: 0.39). Most of this overlap came from within the seeds and fruit food groups. Seeds and fruit made up 52.2% of possum diet and 74.0% of ship rat diet (Table 2), with a 55% overlap between the seeds and fruit that possums and rats ate (Horn’s index for fruit and seeds only = 0.55). There were also some notable
seed and fruit consumption differences between rats and possums. Examples include Prumnopitys ferruginea
seeds at 21.3% of rat diet but not eaten by possums and Podocarpus hallii seed at 6.9% of possum diet but not eaten by rats.
a. Year 1
b. Year 2
c. Years 1 & 2
70 60 50 40 30 20 10 0
70 60 50 40 30 20 10 0
70 60 50 40 30 20 10 0
Dry W
eight (%)
fruit seeds invertebrates other-foods
Food group
a a a a
a b b b
a b b b
a a a a
juveniles adult males non-breeding adult females breeding females
Percentage
100
80
60
40
20
0
Jun. Aug. Nov. Mar. Jun. Aug. Nov. Mar. Jun.
Year 1 (2001/02) Year 2 (2002/03)
Date
5 5 7 14 23 26 35 29 24
other foods invertebrates
fruit
seeds
Figure 4. Mean percentage of total ship rat diet for four food groups and four age-sex-breeding-status groups at Waihaha, in (a) year 1 (June 2001–June 2002), (b) year 2 (August 2002–June 2003) and (c) year 1 and 2, combined, of the diet study. Letters
at the top of bars in (c) indicate significant differences (P < 0.05) between age-sex-breeding status groups within food groups (Duncans’s multiple range tests).
Figure 5. Monthly percentage dry weight contribution of four food groups to adult (tooth wear class > 2) ship rat diet at Waihaha during the diet study (June 2001–June 2003). Numbers at the top of bars are sample sizes.
(predominantly dicotyledons), bark, litter/moss, fungi and wood made up 8.3% of possum diet and 2.5% of rat diet (Table 2). However, these accounted for only a minor proportion of total diet, even though most were commonly available.
Discussion
Impact of possum control on ship rat abundance
The strong correlation between lure-disturbance rates at baits and traps set for possums and ship rat trapping rates indicates that lure disturbance provides similar information on relative abundance of ship rats as does the frequently used snapback trapping index. Such indices are vulnerable to variations in rat activity over time (Blackwell 2002), and the lack of an experimental control prevents us from accounting for this, but the consistent nature of the low pre-control and high post-control indices over a period of years argues against these data resulting from fluctuations in rat activity at the time of measurement. Clout (1980) also observed a strong link between ship rat abundance and bait disturbance at possum traps.
Figure 6. Percentage dry weight of invertebrates in diet of breeding females (open symbols) and other adult rats (solid symbol) plotted against percentage breeding (percentage of all adult female rats pregnant or lactating) at Waihaha between 2001 and 2003. Linear regression lines are shown. The slopes of the two regressions are not
significantly different (F1,14 = 3.55,
P = 0.08).
Percentage adult females breeding 80
60
40
20
0
Invertebrates
in
diet
(%)
0 20 40 60 80 100
Breeding females
R2 = 0.65 Non-breeding adults
R2 = 0.67
removing birds and ungulates as potential candidates. It is unknown if mustelids or hedgehogs (Erinaceus europaeus occidentalis) disturb flour baits but their densities are generally low in montane rainforests. Last, close inspection of the litter surrounding disturbed baits usually revealed the presence of fresh rat faecal pellets (PS pers. obs.)
The significant increase in lure-disturbance rates after the 1994 possum control operation, therefore, indicates ship rats were more numerous (perhaps
fivefold more so) after possum control. Excluding the 18-month ‘recovery’ period following the 2000 poison operation, post-poison lure disturbance rates always exceeded those recorded before possum control in 1994. While post-possum-control recording of lure disturbance did not begin until August 1998, our (unquantified) field observations of lure disturbance and rat faecal pellets around traps and baits set for possums suggested high rat abundance in the study area since at least March 1996. Regardless of whether
Table 3. Correlation coefficients (r) for linear regressions between a range of food groups in ship rat diet and fecundity (%
adult females pregnant and lactating), instantaneous rates of increase of the whole population, or survival of population subgroups of ship rats, at Waihaha between 2001 and 2003. Rates of increase for the whole population were calculated from bait-disturbance rates. Juvenile survival was calculated as ln(number of animals in age-class 3 captured at the next assessment/ number of juveniles captured in the current month). Adult survival was calculated as the ln(number of animals of age-classes 4–6 captured at the next assessment/number animals of age-classes 3 and 4 captured in the current month). Positive r-values greater than 0.7 are in bold type.
___________________________________________________________________________________________________________________________________
Food group Correlation coefficents
Fecundity 3-month 3–6-month 3-month juvenile 3-month adult rate of increase rate of increase survival survival (n = 8) (n = 7) (n = 6) (n = 7) ( = 7) ___________________________________________________________________________________________________________________________________
Invertebrates (%) 0.91 0.07 0.20 −0.62 0.35
Seeds (%) −0.22 0.22 −0.82 0.75 0.63
Fruit (%) −0.39 −0.17 0.71 0.01 −0.81
Other (%) −0.64 −0.22 −0.56 0.43 0.05
Invertebrates + seeds (%) 0.29 −0.20 −0.66 0.04 0.83
Invertebrates + fruit (%) −0.22 0.14 0.85 −0.77 −0.58
Fruit + seeds (%) −0.89 0.17 0.07 0.60 −0.37
Total food (wet weight) 0.03 −0.11 −0.03 0.34 −0.31
it began in 1998, 1996 or earlier, this extended period of elevated abundance is unusual for rats, as the peaks in abundance reported in most other studies have typically been short lived (King et al. 1996; Gillies et al. 2003; Harper 2005). However, Efford et al. (2006) documented a gradual 4–5-fold increase in ship rat abundance between 1971 and 1985 in podocarp–hardwood forest in the Orongorongo Valley, although trap-catch rates remained within the pre-1994 Waihaha range (calculated from data in Efford et al. (2006)). The data suggest a sustained increase in rat carrying capacity at Waihaha within 4 years of possum control in 1994.
Lure disturbance rates before the 1994 poison operation suggest trap-catch rates of c. 11% for ship rats in the study area. This is similar to or greater than mean catch rates recorded elsewhere in mainland New Zealand podocarp–hardwood forest in the absence of possum control (Beveridge 1964; Best 1973; Innes 1977; Daniel 1978; Fitzgerald 1988; Brown et al. 1996; King et al. 1996; Gillies et al. 2003, Harper 2005, Harper et al. 2005). Short-lived peaks in ship rat abundance of up to 31−36% and 67% trap catch have been recorded in other North Island studies (Gillies et al. 2003, Wilson et al. 2007) and on Stewart Island (Harper 2005), respectively, but mean rat capture rates at Waihaha from 1998 to 2003 (excluding August 2000 to March 2002) were much higher than at other sites, averaging 28.2%, peaking at 49.1%, and up to 75.6% on an individual transect, with high capture rates (>15%) sustained throughout this period. Differences in habitat type and trapping protocols between different studies limit the comparability of these data, but nonetheless the Waihaha data provide strong evidence that rat abundance there, after 1997, was abnormally high compared with before 1995 and probably other New Zealand sites with uncontrolled possum populations.
In a 3-year study replicated in two other North Island forests (podocarp–Beilschmiedia tawa
(tawa)–hardwood forest in Taranaki and mataī–tawa forest in the Bay of Plenty), post-possum-control rat abundance reached levels up to six times higher in possum-controlled areas than in nearby untreated areas (Sweetapple et al. 2006). In the only other published study in which rat abundance has been monitored for more than a year after possum control, Powlesland et al. (2003) did not observe elevated rat numbers after 1080-poisoning of possums (and rats) in podocarp–hardwood forest at Whirinaki, Bay of Plenty. However, in their first post-control year, rat abundance declined markedly in a similar nearby unpoisoned area, and in the second and final year, possum abundance in the non-treatment area was reduced by commercial possum hunting to levels matching those in the poisoned area. These changes make the outcome of that study difficult to assess in terms of the impacts of possum control on rat abundance.
Overall, the available evidence suggests ship rat abundance may often exceed pre-control levels for extended periods after pulsed possum control in New Zealand podocarp–hardwood forest. In Norway, a similar relationship between a herbivore and a rodent has recently been identified: Microtus agrestis (field vole) abundance was inversely proportional to density of Ovis aries (domestic sheep), with which their diet overlaps (Steen et al. 2005).
Ship rat diet and demography
In line with our a priori prediction, fruit and seeds dominated post-possum-control ship rat diet. The importance of seeds and fruit (74% of total diet; Table 2) in this study exceeds that in all other New Zealand ship rat diet studies, which report annual diets that are usually dominated by invertebrates and green plant parts (Best 1969; Daniel 1973; Innes 1979; Miller & Miller 1995; Blackwell 2000). As fruit, and particularly seeds, provide rich sources of nutrients and energy (Grodziński & Sawicka-Kapusta 1970; Gysel 1971; Jensen 1982; Williams 1982; Murphy 1992; Ruscoe et al. 2004), they probably provided the main energy source over the entire 2-year period during which the rat population increased to high abundance levels. The nutritional importance of seeds in particular was highlighted by the strong correlation between seed consumption and rat survival (Table 3).
Fruit and seeds were not, however, the main determinant of rat fecundity. In contrast to our expectation, less fruit and seed was eaten in the first year of the diet study when fecundity was high than in the second year. Instead, invertebrate consumption by adult rats was greatest during the first year, and was strongly correlated with fecundity (Table 3). Ironically, breeding females ate proportionally fewer invertebrates than other adults (Fig. 4), although the greater total food consumption by breeding females (c. 60% greater than other adults) meant that their absolute invertebrate consumption was similar to other adults and absolute seed consumption was more than double that of other adults. This suggests that invertebrate consumption was driving breeding rather than vice versa, and breeding drove up seed consumption to support the increased energy demands of pregnancy and lactation. Invertebrate consumption driving breeding is also supported by the strong relationship between fecundity and invertebrate consumption in breeding females (Fig. 6) because if the reverse was true all breeding females would eat large quantities of invertebrates regardless of the overall level of fecundity.
with breeding activity elsewhere (Daniel 1972, 1973; Bunn & Craig 1989; Miller & Miller 1995). Total energy budget probably also plays an important role, as indicated by the c. 60% greater, seed-dominated, food consumption by breeding females than other adults at Waihaha. Judging by the dominance of fruit and seeds in both rat and possum diet these high-energy foods were abundant throughout the diet study and may have masked the importance of abundant high-energy foods, whatever their source, in regulating rat fecundity. It seems plausible to suggest that since breeding rates were driven mainly by invertebrate use, the major impact of fruit and seed use at Waihaha is likely to be the support of the high energy demands of pregnancy and lactation, and increased survival, and perhaps extending breeding into winter as was observed here, and elsewhere when seeds are abundant (Daniel 1978; King & Moller 1997).
The apparently important role of invertebrate consumption in driving ship rat breeding in this study has parallels with wild mouse (Mus spp.) breeding ecology. Tann et al. (1991) suggest that invertebrates provide the nutritional trigger for mouse (M. domesticus) breeding in Australian Mallee wheatfields and Fitzgerald et al. (1996, 2004) and Alley et al. (2001) provide evidence that litter-dwelling invertebrates are the primary drivers of mouse (M. musculus) breeding in beech (Nothofagus) mast seed years in the Orongorongo Valley, New Zealand.
Although ship rat breeding is strongly seasonal in New Zealand forests (Innes 1990) it is unlikely that breeding at Waihaha was primarily driven by annual cycles in abiotic factors (e.g. temperature, photo period) that coincides with seasonal invertebrate activity, because seasonal and annual fecundity during this study differed markedly between the two years investigated (Fig. 3), but invertebrate consumption explained 83% of this variation (Table 3).
While immigration also provides a potential demographic influence on Waihaha rat dynamics, the large-scale and uniform forest and pest control operation in which the study took place, and the distance to the nearest boundary, makes the likely role of immigration to be minor. Furthermore, Innes et al. (2001) ascribes non-commensal ship rat population fluctuations as primarily due to breeding and recruitment, while one study demonstrated that forest-dwelling ship rats dispersed evenly throughout the study area (Hooker & Innes 1995). Our seasonal shifting sampling design would also have reduced the degree to which local trapping-induced reductions in rat abundance created sinks that attracted immigrants.
Age-class differences in rat diet
Juvenile rats ate proportionally less seed and more invertebrates than adults during the diet study (Fig. 4).
This may reflect a greater demand for protein by growing animals than by adults (Clark 1980) and the declining efficiencies of feeding on invertebrates with increasing body size (Emmons 1980; Henry 1997). Therefore, rats within the study population appear to be optimising their diet selection between invertebrates and other high-quality foods depending on age and body size. A similar pattern has been observed for ship rats overseas (Clark 1980), but not in previous New Zealand studies where ship rat diets have been compared between age classes (Gales 1982; Blackwell 2000).
Drivers of rat abundance increase at Waihaha
We hypothesised that the apparent sustained increase in rat abundance following possum control at Waihaha was due to increased availability of fruit and seed, resulting from increased production and/or reduced competition from possums for these foods. However, the study design, lack of measurement of food availability, and correlative nature of the results do not permit us to draw a firm conclusion regarding this hypothesis. Instead, the study has observed trends and apparent relationships that provide circumstantial evidence in support of the hypothesis. Rat diet was dominated by fruit and seeds (74% of total diet) indicating that, energetically, it was these foods that primarily supported the initially rapid population increase, and then sustained the abundant rat population. Seed and fruit consumption was also positively correlated with rat survival, and breeding female total food intake was boosted primarily by increased seed consumption. Dietary overlap between possums and rats was high (Horn’s index: 0.39) with overlap almost exclusively in the fruit and seed food groups, demonstrating the potential for possums to compete with rats, especially when possum number are high. The high proportion of fruit and seed in rat and possum diet (52%) compared with other New Zealand sites (Best 1969; Daniel 1973; Innes 1979; Miller & Miller 1995; Blackwell 2000; Nugent et al. 2000), and for possums pre-control possum diet at Waihaha (9% of diet; Sweetapple & Nugent 1998), is at least consistent with these foods being more accessible to these consumers during the study than is usually the case in New Zealand forests. Whether the apparent increased accessibility of these foods resulted from increased production or reduced interspecific and intraspecific competition is unknown.
in the second year suggests that invertebrate availability was the primary factor limiting fecundity. The low possum density throughout the post-poison period and low consumption of invertebrates by possums argue against possums competing significantly with rats for invertebrates. Therefore, intraspecific competition among abundant rats for invertebrates appears a plausible explanation for the drop in fecundity during the second year.
The important role of invertebrates driving rat fecundity was unexpected and requires us to modify our hypothesis. We suggest rats were limited by fruit and seed availability before possum control, primarily through direct competition with possums or possum-induced suppression on fruit production. Rats then increased in abundance until intraspecific competition for invertebrates reduced fecundity in the presence of readily available fruit and seed following possum control.
Fruits and seed eaten by pests at Waihaha primarily came from long-lived tree species. Their mid-term (decades rather than centuries) abundance or potential to produce fruit would not be expected to change markedly as a result of possum control; therefore, we would not expect any long-term state change with regard to the Waihaha forest fruit-production potential. Consequently, in the absence of further possum control, we speculated that rat abundance will gradually return to pre-poison levels as possum numbers recover to their original level.
Although our results are in general agreement with the hypothesis that rat abundance at Waihaha increased following possum control due to release from limited fruit and seed availability, the circumstantial nature of the evidence means we need to carefully consider other possible causes for the observed increase in rat abundance. Reduced possum abundance may have affected ship rat population by means other than through the food supply. Competition for den sites is possible though unlikely between two species that are both highly adaptable in their selection of denning sites (Cowan 1990; Innes 1990) in a structurally complex habitat like mature podocarp–hardwood forest that provides abundant denning opportunities. Interference competition between possums and rats might be a factor contributing to rat dynamics during the study although this has never been reported in the literature. Possums exhibit predatory behaviour (Sadleir 2000), but rat predation by possums is unlikely to have suppressed Waihaha rat populations at any time during the study because no rodent remains were found in possum stomachs during this study or in another 634 stomachs from Waihaha analysed since 1989, or in any other published New Zealand possum diet study (Nugent et al. 2000).
Stoats (Mustela erminea) frequently prey on ship rats and large invertebrates (King 2005) and are often killed during possum poisoning (Murphy & Bradfield
1992; Gillies & Pierce 1999; Murphy et al. 1998, 1999), so stoat removal during possum control may have been a trigger for post-poison rat population growth. However, the evidence to date indicates that stoats may have some regulatory impact on rats during low phases of rat population cycles but they do not modulate rat population eruptions in New Zealand forests (Blackwell et al. 2003; Ruscoe et al. 2003) and stoat populations usually recover from possum control within c. 6 months (Murphy et al. 1998, 1999). Therefore, although we have no information on predator abundance in our study area, it seems that stoat by-kill is unlikely to explain the sustained elevation of rat numbers after control at Waihaha.
The only other significant predators of forest dwelling rats are feral cats (Felis catus) but their abundance at Waihaha both before and after possum control must at most be very low as no field sign of cats has been noted from the study area during at least 700 days of fieldwork spread over a 15-year period (unpubl. data). Although reduced cat abundance is postulated to account for the 1971–1986 increase in rat abundance in the Orongorongo Valley (Efford et al. 2006), this was accompanied by an increase in possum trapping activity, so reduced competition for food from possums might explain this increase in rat abundance. Therefore, we consider cats are unlikely to have significantly impacted on rat populations at Waihaha during this study.
Forest-dwelling mice mainly eat invertebrates and seeds (Ruscoe & Murphy 2005) as do ship rats and, therefore, may compete with ship rats for these foods. Possible poisoning of mice during possum control could have released rats from this competition, but the known facts do not support this. Mice were apparently less affected than rats by the 2000 poison operation and were common during the period in which rat densities were very low (Sweetapple & Nugent 2005). Furthermore, of these two rodent species, ship rats are considered the superior competitor and exhibit reciprocal abundance trends with mice in mainland New Zealand forests (Innes 2001).
Many New Zealand plants exhibit synchronised annual variability in fruit production over wide areas (Schauber et al. 2002), which can trigger ship rat eruptions (Daniel 1978; King & Moller 1997; Dilks et al. 2003; Harper 2005). Such intermittent masting behaviour of forest trees cannot, on its own, explain the apparently sustained elevation in ship rat abundance over several years at Waihaha.
hard beech (Nothofagus truncata) flowering (Alley et al. 2001). Any such increase in invertebrate populations would be likely to augment the response of the Waihaha ship rat population to possum control, given the apparent link there between invertebrate consumption and fecundity.
This study presents evidence that there was a substantial and sustained increase in ship rat abundance over several years in the podocarp–hardwood forests at Waihaha following the initiation of possum control. The available data point to the post-control accessibility of fruit and seed as the most plausible driver of this population increase, although the importance of invertebrates in driving fecundity is also highlighted. The source of the apparent unusually accessible fruit and seeds, whether through increased production resulting from reduced possum browsing or reduced interspecific and intraspecific competition, was not determined. However, the study could not discredit other potential drivers of increased rat abundance. Ongoing replicated studies of rat, mouse, stoat and possum population dynamics, invertebrate abundance, and fruit production, with and without possum control, will add considerably to our understanding of the interactions between ship rats and possums in New Zealand forests. Supplemental feeding trials could specifically test the relationships between ship rat demography parameters and invertebrate and seed abundance. In light of the predatory impacts of rats in New Zealand forests (Innes 1990; Innes et al. 1999; Dilks et al. 2003) the consequences for indigenous fauna of elevated post-possum-control rat abundance needs investigation.
Acknowledgements
Numerous people have assisted with fieldwork during the 14 years of this study, but we would particularly like to thank W. Fraser, J. Whitford and B. Curnow for their substantial involvement. The Department of Conservation, Pureora, provided logistical support during early phases of the study. We also thank G. Forrester for statistical analysis, C. O’Connor, J. Innes, W. Ruscoe, P. Cowan, C. Bezar and two anonymous referees for comments on earlier versions of the manuscript. The study was funded by the Department of Conservation and the Foundation for Research, Science and Technology, and permission to undertake the study was granted by the Department of Conservation, Te Kuiti.
References
Alley JC, Berben PH, Dugdale JS, Fitzgerald BM, Knightbridge PI, Meads MJ, Webster RA 2001.
Responses of litter-dwelling arthropods and house mice to beech seeding in the Orongorongo Valley, New Zealand. Journal of the Royal Society of New Zealand 31: 425–452.
Atkinson IAE 1973. Spread of the ship rat (Rattus r. rattus L.) in New Zealand. Journal of the Royal Society of New Zealand 3: 457–472.
Best LW 1969. Food of the roof-rat, Rattus rattus rattus
(L), in two forest areas of New Zealand. New Zealand Journal of Science 12: 258–267. Best LW 1973. Breeding season and fertility of the
roof rat, Rattus rattus rattus, in two forest areas of New Zealand. New Zealand Journal of Science 16: 161–170.
Beveridge AE 1964. Dispersal and destruction of seed in central North Island podocarp forests. Proceedings of the New Zealand Ecological Society 11:48–55.
Blackwell GL 2000. An investigation of the factors regulating house mouse (Mus musculus) and ship rat (Rattus rattus) population dynamics in forest ecosystems at Lake Waikairemoana, New Zealand. Unpublished PhD thesis, Massey University, Palmerston North, New Zealand.
Blackwell GL, Potter MA, McLennan JA, Minot EO 2003. The role of predators in ship rat and house mouse population eruptions: drivers or passengers? Oikos 100: 601–613.
Brockie B 1992. A living New Zealand forest. Auckland, David Bateman.
Brown KP, Moller H, Innes J, Alterio N 1996. Calibration of tunnel tracking rates to estimate relative abundance of ship rats (Rattus rattus) and mice (Mus musculus) in a New Zealand forest. New Zealand Journal of Ecology 20: 271–275. Bunn TJ, Craig JL 1989. Population cycles of Rattus
exulans: population changes, diet, and food availability. New Zealand Journal of Zoology 16: 409-418.
Caughley G 1977. Analysis of vertebrate populations. New York, John Wiley.
Clark DA 1980. Age- and sex-dependent foraging strategies of a small mammalian omnivore. Journal of Animal Ecology 49: 549–563.
Clout MN 1980. Ship rats (Rattus rattus L.) in a
Pinus radiata plantation. New Zealand Journal of Ecology 3: 141–145.
Corbett L 1995. Does dingo predation or buffalo competition regulate feral pig populations in the Australian wet–dry tropics? An experimental study. Wildlife Research 22: 65–74.
Cowan PE 1991. Effects of introduced Australian brushtail possums (Trichosurus vulpecula) on the fruiting of the endemic New Zealand nikau palm (Rhopalostylis sapida). New Zealand Journal of Botany 29: 91–93.
Cowan PE, Waddington DC 1990. Suppression of fruit production of the endemic forest tree, Elaeocarpus dentatus, by introduced marsupial brushtail possums, Trichosurus vulpecula. New Zealand Journal of Botany 28:217–224.
Daniel MJ 1972. Bionomics of the ship rat (Rattus r. rattus) in a New Zealand indigenous forest. New Zealand Journal of Science 15:313–341. Daniel MJ 1973. Seasonal diet of the ship rat (Rattus
r. rattus) in lowland forest in New Zealand. Proceedings of the New Zealand Ecological Society 20: 21–30.
Daniel MJ 1978. Population ecology of ship and Norway rats in New Zealand. In: Dingwall PR, Atkinson IAE, Hay C eds The ecology and control of rodents in New Zealand nature reserves. Department and Lands and Survey Information Series 4: 145–152.
Dilks P, Willans M, Pryde M, Fraser I 2003. Large scale stoat control to protect mohua (Mohoua ochrocephala) and kaka (Nestor meridionalis) in the Eglinton Valley, Fiordland, New Zealand. New Zealand Journal of Ecology 27: 1–9.
Efford MG, Fitzgerald BM, Karl BJ, Berben PH 2006. Population dynamics of the ship rat Rattus rattus
L. in the Orongorongo Valley, New Zealand. New Zealand Journal of Zoology 33: 273–297. Emmons LH 1980. Ecology and resource partitioning
among nine species of African rain forest squirrels. Ecological Monographs 50: 31–54.
Fitzgerald BM 1988. Diet of domestic cats and their impacts on prey populations. In: Turner DC, Bateson P eds The domestic cat: the biology of its behaviour. Cambridge, Cambridge University Press. Pp. 123–147.
Fitzgerald BM, Daniel MJ, Fitzgerald AE, Karl BJ, Meads MJ, Notman PR 1996. Factors affecting the numbers of house mice (Mus musculus) in hard beech (Nothofagus truncata) forest. Journal of the Royal Society of New Zealand 26: 237–249. Fitzgerald BM, Efford MG, Karl BJ 2004. Breeding
of house mice and the mast seeding of southern beeches in the Orongorongo Valley, New Zealand. New Zealand Journal of Zoology 31: 167–184. Gales RP 1982. Age- and sex-related differences in
diet selection by Rattus rattus on Stewart Island, New Zealand. New Zealand Journal of Zoology 9: 463–466.
Gillies CA, Pierce RJ 1999. Secondary poisoning of mammalian predators during possum and rodent control operations at Trounson Kauri Park,
Northland, New Zealand. New Zealand of Journal of Ecology 23: 183–192.
Gillies CA, Leach MR, Coad NB, Theobald SW, Campbell J, Herbert T, Graham PJ, Pierce RJ 2003. Six years of intensive pest mammal control at Trounson Kauri Park, a Department of Conservation “mainland island”, June 1996–July 2002. New Zealand Journal of Zoology 30: 399–420.
Grodziński W, Sawicka-Kapusta K 1970. Energy values of tree-seeds eaten by small mammals. Oikos 21: 52–58.
Gysel LW 1971. A 10-year analysis of beechnut production and use in Michigan. Journal of Wildlife Management 35: 516–519.
Harper GA 2005. Heavy rimu (Dacrydium cupressinum) mast seeding and rat (Rattus spp.) population eruptions on Stewart Island/Rakiura. New Zealand Journal of Zoology 32:155–162.
Harper GA, Dickinson KJM, Seddon PJ 2005. Habitat use by three rat species (Rattus spp.) on Stewart Island/Rakiura, New Zealand. New Zealand Journal of Ecology 29: 251–260.
Henry O 1997. The influence of sex and reproductive state on diet preference in four terrestrial mammals of the French Guianan rain forest. Canadian Journal of Zoology 75: 929–935.
Hooker S, Innes J 1995. Ranging behaviour of forest-dwelling ship rats, Rattus rattus, and effects of poisoning with brodifacoum. New Zealand Journal of Zoology 22: 291–304.
Horn HS 1966. Measurement of “overlap” in comparative ecological studies. American Naturalist 100: 419–424.
Innes JG 1977. Biology and ecology of the ship rat
Rattus rattus rattus (L.) in Manawatu (N.Z.) forests. Unpublished MSc thesis, Massey University, Palmerston North, New Zealand.
Innes J 1979. Diet and reproduction of ship rats in the northern Tararuas. New Zealand Journal of Ecology 2: 85–86.
Innes J 2001. Advances in New Zealand mammalogy 1990–2000: European rats. Journal of the Royal Society of New Zealand 31: 111–125.
Innes JG 2005. Ship rat. In: King CM ed. The handbook of New Zealand mammals. Melbourne, Oxford University Press. Pp. 187–203.
Innes J, Warburton B, Williams D, Speed H, Bradfield P 1995. Large-scale poisoning of ship rats (Rattus rattus) in indigenous forests of the North Island, New Zealand. New Zealand Journal of Ecology 19: 5–17.
87: 201–214.
Innes JG, King CM, Flux M, Kimberley MO 2001. Population biology of the ship rat and Norway rat in Pureora Forest Park, 1983−87. New Zealand Journal of Zoology 28: 57–78.
Jensen TS 1982. Seed production and outbreaks of non-cyclic rodent populations in deciduous forests. Oecologia 54: 184–192.
Karnoukhova NG 1971. Age determination of brown and black rats. Ekologiya 2: 71–76.
King CM 2005. The handbook of New Zealand mammals. Melbourne, Oxford University Press. King CM, Moller H 1997. Distribution and response
of rats Rattus rattus, R. exulans to seedfall in New Zealand beech forests. Pacific Conservation Biology 3: 143–155.
King CM, Innes JG, Flux M, Kimberley MO, Leathwick JR, Williams DS 1996. Distribution and abundance of small mammals in relation to habitat in Pureora Forest Park. New Zealand Journal of Ecology 20: 215–240.
Krebs CJ 1989. Ecological methodology. New York, Harper & Row.
Miller CJ, Miller TK 1995. Population dynamics and diet of rodents on Rangitoto Island, New Zealand, including the effect of a 1080 poison operation. New Zealand Journal of Ecology 19: 19–27. Murphy EC 1992. The effects of a natural increase in
food supply on a wild population of house mice. New Zealand Journal of Ecology 16: 33–40. Murphy E, Bradfield P 1992. Change in diet of stoats
following poisoning of rats in a New Zealand forest. New Zealand Journal of Ecology 16: 137–140. Ruscoe WA, Murphy EC 2005. House mouse. In:
King CM ed. The handbook of New Zealand mammals. Melbourne, Oxford University Press. Pp. 204–221.
Murphy EC, Clapperton BK, Bradfield PMF, Speed HJ 1998. Effects of rat-poisoning operations on abundance and diet of mustelids in New Zealand podocarp forests. New Zealand Journal of Zoology 25: 315–328.
Murphy EC, Robbins L, Young JB, Dowding JE 1999. Secondary poisoning of stoats after an aerial 1080 poison operation in Pureora Forest, New Zealand. New Zealand Journal of Ecology 23: 175–182. Nelson L Jr, Clark FW 1973. Correcting for sprung
traps in catch/effort calculations of trapping results. Journal of Mammalogy 54: 295–298.
Norbury G, Heyward R, Parkes J 2002. Short-term ecological effects of rabbit haemorrhagic disease in the short-tussock grasslands of the South Island, New Zealand. Wildlife Research 29: 599–604. Nugent G, Fraser KW, Sweetapple PJ 1997.
Comparison of red deer and possum diets and impacts in podocarp-hardwood forest, Waihaha
Catchment, Pureora Conservation Park. Science for Conservation 50. Wellington, Department of Conservation.
Nugent G, Sweetapple PJ, Coleman JD, Suisted PA 2000. Possum feeding patterns: dietary tactics of a reluctant folivore. In: Montague T ed. The brushtail possum: biology, impact and management of an introduced marsupial. Lincoln, Manaaki Whenua Press. Pp. 10–23.
Nugent G, Fraser W, Sweetapple P 2001. Top down or bottom up? Comparing the impacts of introduced arboreal possums and ‘terrestrial’ ruminants on native forests in New Zealand. Biological Conservation 99: 65–79.
Ostfeld RS, Jones CG, Wolff JO 1996. Of mice and mast: ecological connections in eastern deciduous forests. BioScience 46: 323–330.
Parkes J, Murphy E 2003. Management of introduced mammals in New Zealand. New Zealand Journal of Zoology 30: 335–359.
Pinheiro J, Bates D, DebRoy S, Sarkar D 2006. NLME: Linear and nonlinear mixed effects models. R package version 3. Pp. 1–77.
Powlesland RG, Wills DE, August ACL, August CK 2003. Effects of a 1080 operation on kaka and kereru survival and nesting success, Whirinaki Forest Park. New Zealand Journal of Ecology 27: 125–137.
Pucek Z, Jędrzejewski W, Jędrzejewska B, Pucek M 1993. Rodent population dynamics in a primeval deciduous forest (Białowieża National Park) in relation to weather, seed crop, and predation. Acta Theriologica 38: 199–232.
Ruscoe WA, Choquenot D, Heyward R, Yockney I, Young N, Drew K 2003. Seed production, predators and house mouse population eruptions in New Zealand beech forests. In: Singleton GR, Hinds LA, Krebs CJ, Spratt DM eds Rats, mice and people: rodent biology and management. ACIAR Monograph 96. Canberra, Australian Centre for International Agricultural Research. Pp. 334–337.
Ruscoe WA, Wilson D, McElrea L, McElrea G, Richardson SJ 2004. A house mouse (Mus musculus) population eruption in response to rimu (Dacrydium cupressinum) seedfall in southern New Zealand. New Zealand Journal of Ecology 28: 259–265.
Sadleir RMFS 2000. Evidence of possums as predators of native animals. In: Montague TL ed. The brushtail possum: biology, impact and management of an introduced marsupial. Lincoln, Manaaki Whenua Press.
Zealand plant species: the role of temperature as a sychronizing cue. Ecology 83: 1214–1225. Sinclair ARE, Krebs CJ 2002. Complex numerical
responses to top-down and bottom-up processes in vertebrate populations. Philosophical Transactions of the Royal Society London B 357: 1221–1231. Smale MC, Smale PN 2003. Dynamics of upland
conifer/broadleaved forest at Waihaha, central North Island, New Zealand.Journal of the Royal Society of New Zealand 33: 509–528.
Steen H, Mysterud A, Austrheim G 2005. Sheep grazing and rodent populations: evidence of negative interactions from a landscape scale experiment. Oecologia 143: 357–364.
Sweetapple PJ 2003. Possum (Trichosurus vulpecula) diet in a mast and non-mast seed year in a New Zealand Nothofagus forest. New Zealand Journal of Ecology 27: 157–167.
Sweetapple PJ, Nugent G 1998. Comparison of two techniques for assessing possum (Trichosurus vulpecula) diet from stomach contents. New Zealand Journal of Ecology 22: 181–188. Sweetapple P, Nugent G 2005. When the rats are away
the mice really do play! Kararehe Kino Vertebrate Pest Research 6: 9–10.
Editorial Board member: Kay Clapperton
Sweetapple PJ, Nugent G, Whitford J, Knightbridge PI 2002. Mistletoe (Tupeia antarctica) recovery and decline following possum control in a New Zealand forest. New Zealand Journal of Ecology 26: 61–71.
Sweetapple PJ, Nugent G, Poutu N, Horton P 2006. Effect of reduced possum density on rodent and stoat abundance in podocarp-hardwood forests. DOC Research & Development Series 231. Wellington, Department of Conservation. Tann CR, Singleton GR, Coman BJ 1991. Diet of
the house mouse, Mus domesticus, in the Mallee wheatlands of north-western Victoria. Wildlife Research 18: 1–12.
Williams CK 1982. Nutritional properties of some fruits eaten by the possum Trichosurus vulpecula
in a New Zealand broadleaf-podocarp forest. New Zealand Journal of Ecology 5:16–20.
Wilson DJ, Efford MG, Brown SJ, Williamson JF, McElrea, GJ 2007. Estimating density of ship rats in New Zealand forests by capture-mark-recapture trapping. New Zealand Journal of Ecology 31: 47-59.