Business Process Model and Notation:
The Current State of Affairs
Mateja Kocbek1, Gregor Jošt2, Marjan Heričko3, and Gregor Polančič4
Faculty of Electrical Engineering and Computer Science University of Maribor
Smetanova ulica 17, 2000 Maribor, Slovenia 1,2,3,4
{mateja.kocbek, gregor.jost, marjan.hericko, gregor.polancic}@um.si
Abstract. Context: With business process modelling, companies and organizations can gain explicit control over their processes. Currently, there are many notations in the area of business process modelling, where Business Process Model and Notation (BPMN) is denoted as the de facto standard. Aims: The aim of this research is to provide the state-of-the-art results addressing the acceptance of BPMN, while also examining the purposes of its usage. Furthermore, the advantages, disadvantages and other interests related to BPMN were also investigated. Method: To achieve these objectives, a Systematic Literature Review (SLR) and a semantic examination of articles’ citations was conducted. Results: After completing SLR, out of a total of 852 articles, 31 were deemed relevant. The majority of the articles analyzed the notation and compared it with other modelling techniques. The remainder evaluated general aspects of the notation, e.g. history and versions of the standard, usage of the notation or tools. Conclusion: Our findings demonstrate that there are empirical insights about the level of BPMN acceptance. They suggest that BPMN is still widely perceived as the de facto standard in the process modelling domain and its usage is ever-increasing. However, many studies report that only a limited set of elements are commonly used and to this end, several extensions were proposed. The main purpose of BPMN remains the description of business processes.
Keywords: business process modelling, BPMN, acceptance, use, systematic literature review.
1.
Introduction
standardization of processes inside and outside an organization is necessary to improve communication and optimize work [12].
From existing graphical languages for BPMo, the most robust communication between information technology (IT) and business was made with the Business Process Model and Notation (hereinafter referred to as BPMN) standard [2, 30]. BPMN was introduced in 2004, after several years of efforts at achieving standardization [40]. Examples of other visual process modelling languages, currently in use, are Flowcharts, UML Activity Diagrams, Petri nets, Event Process Chains (EPC).
BPMN is an ISO certified standard (ISO/IEC 19510:2013) for describing business process semantics, since its notation is generally easy to comprehend and is highly understandable for business and technical personnel [46]. BPMN also provides a high expressiveness and allows many extensions for different areas (e.g. security [47], business rules [26], business events [13], costs [24]). BPMN has also a wide support by several commercial and open source tools [40].
Because of the large variety of constructs, BPMN may be treated as a complex notation [27]. However, the fundamental question of ‘how and why is BPMN used?’ remains. According to Recker [40], the actual use of BPMN has not been fully examined. Additionally, there are no consistent findings, even though there are a wide range of articles in this area available from 2004, when the initial version of BPMN was published, until today.
Our research addresses the aforementioned issues by conducting research about the acceptance of BPMN. The findings were gathered based on relevant articles, which were gathered by applying a Systematic Literature Review (hereinafter referred to as SLR). In accordance with Kitchenham [22], an automated search did not find any software-related research that used a systematic review methodology.
While related works individually explored the significance of BPMN, our research gathered findings from existing literature together, with the aim of addressing the acceptance and use of BPMN in general. In order to achieve this goal, the article is organized as follows. The methodology and research details are given in section two. In section three, the results of the research are provided. In the fourth section, the acceptance, purposes of the use and advantages as well as disadvantages of BPMN are discussed in detail, within the scope of the research questions. Finally, the conclusion and implications are found at the end of the paper.
2.
Method
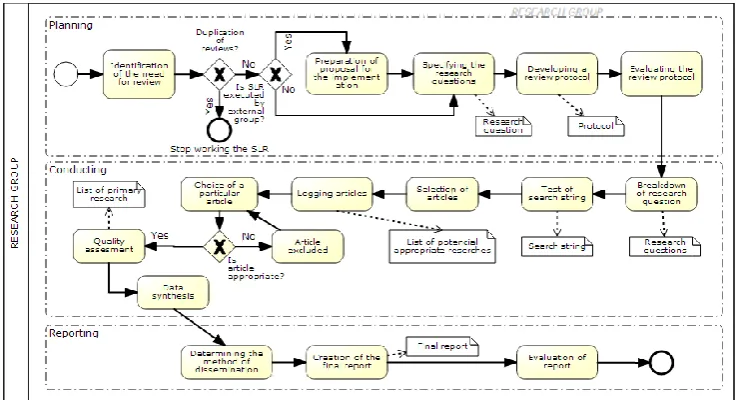
The second group of tasks represent conducting phase. The first step of the second phase is the identification of research, which means breaking down research questions and testing the suitability of a search string. Based on inclusion and exclusion criteria, relevant research is logged and quality assessments are made. At the end of this phase, a data synthesis is made by collecting and summarizing the results of the relevant articles [21].
The third group of tasks represent reporting phase, which needs to be determined whereas the evaluation of the report is made by external experts, which represents the last stage of SLR.
Figure 1. SLR represented in a BPMN diagram
SLR is a method that requires a high amount of strictness when conducting [21]. All planned steps of the methodology need to be accomplished. However, since every research has its own characteristics, it makes it impossible to carry them out precisely as instructed. So, in the following subsections, the research questions, the included and excluded criteria, the search process and data analysis are described in more detail and applied to the selected domain.
2.1. Research questions
Table 1. PICOC criteria
Criterion Acronym Meaning Our case
Population P Who? Organizations where BPMN is
applied
Intervention I What or how? Review BPMN acceptance
Comparison C Compared to
what?
/
Outcomes O What are you
trying to accomplish?
Degree of BPMN acceptance (advantages and disadvantages)
Context C In what kind of
circumstances?
Empirical studies from academic and business fields Notes: Criterion – naming of PICOC criterion, Acronym – short naming of PICOC criteria, Meaning – issues placed in order to obtain a criterion, Our case – PICOC criteria for our case
As mentioned in the introduction, BPMN is used to design typical business activities. The aim of BPMN designers was to provide a language that would be easy to understand and usable for people with different roles and training - from top managers to IT professionals [30]. Because of its wide set of goals, a broad acceptance and different purposes of BPMN use were expected. To this end, we formulated the following research questions:
RQ 1. Are there any empirical insights about the level of BPMN acceptance? RQ 2. For what purposes is BPMN used?
RQ 3. What are the advantages and disadvantages of BPMN use?
2.2. Search string and used digital sources
The search string was composed using the following steps: (1) identification of search terms from research questions, (2) identification of search terms in titles, keywords and in the abstracts of adequate articles, (3) identification of synonyms and alternate spellings of search terms. The search string was composed of search terms and logical operators, e.g. AND and OR. For the purpose of our research, the following search string was used:
("bpmn" OR "process modeling" OR "process modelling") AND
("study" OR "process" OR "modeling" OR "modelling" OR "practice" OR "comparison" OR "usability" OR "business" OR "users" OR "languages" OR "empirical" OR "exploratory" OR "ontological" OR "survey" OR "methodology" OR "analysis" OR "acceptance").
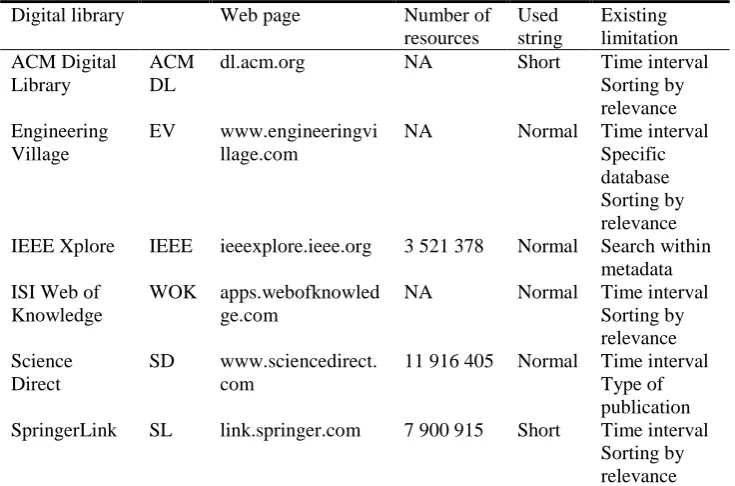
Science Direct. For our work we added two additional digital libraries: ISI Web of Knowledge and SpringerLink (Table 2).
Table 2. Included digital libraries
Digital library Web page Number of
resources
Used string
Existing limitation ACM Digital
Library
ACM DL
dl.acm.org NA Short Time interval
Sorting by relevance Engineering
Village
EV www.engineeringvi llage.com
NA Normal Time interval Specific database Sorting by relevance IEEE Xplore IEEE ieeexplore.ieee.org 3 521 378 Normal Search within
metadata ISI Web of
Knowledge
WOK apps.webofknowled ge.com
NA Normal Time interval Sorting by relevance Science
Direct
SD www.sciencedirect. com
11 916 405 Normal Time interval Type of publication SpringerLink SL link.springer.com 7 900 915 Short Time interval
Sorting by relevance Notes: Digital library – name of included digital library, Acronym – short naming of digital library, Web page – web page of digital library, Number of resources – total number of resources in digital library, Used string – used search string lengths in digital library, Existing limitations – limitations used in chosen digital library, NA – Not available
As evidenced from the fifth column in Table 2, different digital libraries support different lengths of search strings. In five cases out of six, an expert search was used, which allows the user to enter any string together with logical operators. The search can be limited as well by time interval, type of publication (book, journal, etc.) or with a specific database within the selected digital library. Additionally, since most search engines of the chosen digital libraries have the option of sorting results, we used sorting by relevance.
2.3. Inclusion and exclusion criteria
Table 3. Inclusion and exclusion criteria
Inclusion criteria Exclusion criteria
Articles that:
- included academic and industrial fields
- analyzed the use of BPMN
- analyzed the upgrade and transformation of BPMN
- did not mention BPMN - mentioned BPMN indirectly - were published before 2004 - represented grey literature - were not in English
Notes: Inclusion/exclusion criteria – criteria to include/exclude articles in/from SLR
2.4. Search process and evaluation
First, a pilot search was performed, by obtaining a list of ten relevant studies. When searching within digital libraries, ten out of ten articles were found. This represents a guarantee that the search string was adequately composed. The search process was conducted by three researchers. While the first two extracted the data from digital libraries, the third researcher validated the extraction. Based on the joint opinions, a list of suitable articles was established. If there was disagreement on a particular article, it was reviewed again and a final decision was made. This part of the search process was internally called the primary evaluation of articles. Additionally, there were another three evaluations. The percentage of excluded research in every evaluation is discussed in the following subsection.
2.5. Data analysis
To properly manage the chosen literature, we used a desktop application called Mendeley [25], which is a free reference manager. Details of the sources were identified according to the information available and properly analyzed in spreadsheets.
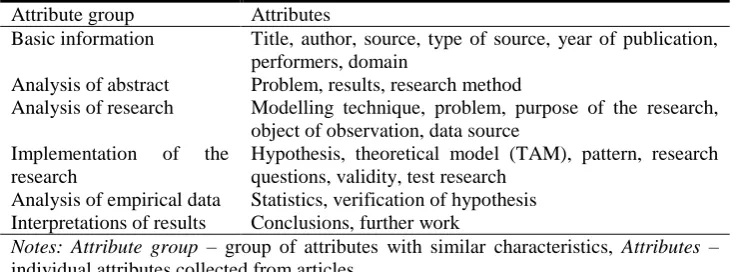
Table 4. Attributes of analyzed articles Attribute group Attributes
Basic information Title, author, source, type of source, year of publication, performers, domain
Analysis of abstract Problem, results, research method
Analysis of research Modelling technique, problem, purpose of the research, object of observation, data source
Implementation of the research
Hypothesis, theoretical model (TAM), pattern, research questions, validity, test research
Analysis of empirical data Statistics, verification of hypothesis Interpretations of results Conclusions, further work
For a data analysis it was necessary to collect all relevant information (attributes) from the chosen articles. They were divided into six parts, each of them differing substantially (Table 4).
3.
Results
To identify suitable articles in digital libraries, the given inclusion and exclusion criteria were applied. We took all available articles (so-called unfiltered articles) and discarded any that did not meet the inclusion criteria. Those that corresponded to the criteria and to the research questions, were the foundation for further research. They are called filtered articles. In Table 5, the distribution of articles is given.
Table 5. Unfiltered and filtered articles
ACM
DL EV IEEE WOK SD SL SUM
Unfiltered 681 7,340 7,939 8,899 9,288 650 34,797
Filtered 151 167 142 118 152 122 852
Notes: Unfiltered – all available articles from digital libraries, Filtered – articles that correspond to the criteria and to the research questions, SUM – the sum of all (unfiltered or filtered) articles from digital libraries
Furthermore, four phases of evaluation are presented. In every phase, each article was either relevant and was thus included or was considered irrelevant and was excluded from further evaluation. Selected articles from the first to third evaluation are further called first (or second or third) stage relevant. Similarly, excluded articles from first to third evaluation are called first (or second or third) stage irrelevant. The selected articles from the final evaluation are subject to a more detailed analysis and are uniquely called relevant articles. Finally, the excluded articles from the final evaluation are called irrelevant articles.
Graph 1 shows the relationships between first stage relevant and first stage irrelevant articles after primary, and before secondary evaluation. All six digital libraries were involved. As already mentioned and indicated in Table 5, 852 filtered articles were examined. The extraction process at this point was conducted based on the article’s title (the topic).
After the primary evaluation, 26.76% of the gathered articles were first stage relevant, meaning that 228 articles were selected from the primary evaluation. The other 624 articles were excluded at this point of the research. The ratio between first stage relevant and first stage irrelevant was 1:2.8.
Graph 1. Primary evaluation
Graph 2. Secondary evaluation
Second stage relevant articles in this evaluation represent 60.53% of all the articles at this stage, and 16.20% of all 852 articles. This means that 138 articles were selected as
31
81
40
12
44
20
120
86
102
106
108
102
0 20 40 60 80 100 120 140 160 180
ACM DL EV IEEE WOK SD SL
First stage relevant First stage irrelevant
14
46
34
8
23
13
17
35
6
4
21
7
0 10 20 30 40 50 60 70 80 90
ACM DL EV IEEE WOK SD SL
second stage relevant from the secondary evaluation. The majority, or 46 of second stage relevant articles, were found in the digital library Engineering Village.
After that, a third evaluation was conducted (Graph 3). The input was 138 second stage relevant articles from the secondary evaluation. The extraction process at this point was conducted based on the entire article’s content.
Graph 3. Tertiary evaluation
After tertiary evaluation, 26.81% of articles were left, which corresponded to 37 third stage relevant articles, which constitute 4.34% of all 852 articles. These articles were used as inputs for the final, quarterly evaluation (Graph 4). The extraction process at this point was conducted based on a detailed review of the entire content.
Graph 4. Final evaluation
1
16
3 3
10
4
13
30
31
5
13
9
0 5 10 15 20 25 30 35 40 45 50
ACM DL EV IEEE WOK SD SL
Third stage relevant Third stage irrelevant
13
3 3
8
4
1
3
2
0 2 4 6 8 10 12 14 16 18
ACM DL EV IEEE WOK SD SL
At this stage, only six articles were irrelevant and 31 articles were left for further research. This final group of relevant articles made up 83.78% of all the articles in this phase and 3.64% of all 852 analyzed articles.
To summarize our findings, all evaluation stages are presented in Figure 2. The first pie chart shows the number of all articles found when entering the search string, without any evaluation. Based on a pre-evaluation, 852 articles were selected and given to further evaluation. The other four pie charts represent each of the evaluations made and number of each stage’s relevant or irrelevant articles.
Figure 2. Evaluation process
The results were obtained in accordance with the SLR methods, thus no additional evaluation was performed. Furthermore, data from each article was recorded using the attributes from Table 4. The final result of the whole search process is presented in Table 6, which consists of the following columns: ID, author, date, study type, topic area, research method, and digital library.
Table 6. Systematic review studies
ID Author Date Study type Topic area Research
method
DL
A1 Aagesen and Krogstie [1]
2010 Presentation BP in general
*Case study SL
A2 Birkmeier and Overhage [2]
2010 Comparison, evaluation
BP in general
Experiment EV
A3 Börger [4]
2011 Analysis BP in
general *Analysis SL
A4 Bulander [6] 2010 Evaluation BP in practice
Questionnaire IEEE
A5 Chinosi and Trombetta [7]
2012 Evaluation BP in general
Questionnaire SD
A6 Cruz et al. [10] 2012 Analysis BP in general
*Case study IEEE
A7 Dubani et al. [16] 2010 Analysis BP in practice
Case study EV
A8 Figl et al. [18] 2013 Comparison BP in general
Experiment SD
A9 Kruczynski [23] 2010 Evaluation BP in general
Experiment, interview
EV
A10
Kumar et al. [49] 2014 Presentation Extension
of BP *Analysis IEEE
ID Author Date Study type Topic area Research method
DL
Montesi [24] analysis of BP
A12 Muehlen and Recker [28]
2008 Evaluation BP in general
*Analysis EV
A13 Muehlen et al. [27]
2007 Evaluation BP in general
*Case study EV
A14 Müller and Rogge-Solti [29]
2011 Presentation BP in practice
*Case study EV
A15 Ottensooser et al.[33]
2012 Comparison, evaluation
BP in general
Experiment SD
A16 Recker [38] 2008 Evaluation BP in general
Questionnaire EV
A17 Recker [44] 2012 Comparison, evaluation
BP in general
Questionnaire SD
A18 Recker [40] 2010 Evaluation BP in general
Questionnaire, interview
EV
A19 Recker [42] 2010 Analysis BP in
general
Questionnaire SD
A20 Recker [41] 2010 Analysis BP in
general
Questionnaire WOK
A21 Recker [39] 2009 Comparison BP in general
*Analysis WOK
A22 Recker [43] 2012 Analysis BP in
general
*Analysis SL
A23 Recker and Rosemann [36]
2010 Evaluation BP in general
Questionnaire SD
A24 Recker et al. [34] 2010 Evaluation BP in general
Interview EV
A25 Recker et al. [37] 2006 Comparison BP in general
*Case study EV
A26 Recker et al. [35] 2011 Evaluation BP in practice
Questionnaire EV
A27
Reisig [45] 2013 Analysis
BP in
general *Analysis SL
A28 Ritter et al. [46] 2011 Presentation BP in practice
*Case study EV
A29 Rosemann et al. [48]
2006 Comparison BP in general
*Analysis WOK
A30 Solís-Martínez et
al.[50] 2014 Presentation
Extension
of BP *Analysis SD
A31 Verdouw et al. [51]
2010 Presentation BP in practice
Interview SD
results, the collaboration between researchers varies, therefore some of the authors occur several times.
Collected data from relevant articles was analyzed and the results are presented below (Graph 5 to Graph 9). Each article has its own publishing source. We introduced an attribute Source that has the following range of values: journals, conferences, and books (Graph 5).
Graph 5. Source type
The most articles (i.e. 19) are journal contributions. Conference articles also constitutes a large share (i.e. 8).
The second analyzed attribute is Number of articles by year. The attributes’ values range from the years 2006 to 2014, as can be seen in Graph 6. The search was limited from the year 2004 onwards, since the first version of the BPMN was published that year. The graph represents a distribution of articles by year after two different evaluation phases (second and final evaluation). As previously mentioned, the extraction process of second evaluation was conducted by reviewing the whole content of articles, while the year of the publication was also collected at that point.
Graph 6. Number of articles by year
8
19 4
0 5 10 15 20
Conference Journal Book
9
16
21
18
28
31
7
2 2
2 2 2
1
11
4 5
0 5 10 15 20 25 30 35
2006 2007 2008 2009 2010 2011 2012 2013 2014
As can be seen, the number of articles regarding BPMN differs depending on the year of publication. After the second evaluation, the distribution was growing equally, especially from 2006 to 2011. The results after the final evaluation are slightly different. The maximum number was reached in 2010, with 11 suitable articles.
The next attribute we examined was the Research domain. Every suitable article was categorized into one of the predefined domains with the following range of values: business processes in general, business processes in practice, and the extensions of business process (Graph 7). The domain Business process in general deals with general aspects of the BPMN. The second domain refers to articles, where the practical use of BPMN was introduced. Possible extensions in BPMN are covered in the third domain.
Graph 7. Research domain
The domain Business process in general is best represented, with 70.96%. Articles within this domain discuss the frequency of use of a certain element of BPMN, modelling tools, advantages and disadvantages of BPMN, etc.
The research methods that were used in articles are shown in Graph 8. The identified methods that occurred were case study, interview, experiment, questionnaire and analysis.
As can be seen, the most used method was questionnaire. However, it should be stressed that 48.38% of research did not explicitly specify the research method they used (marked as not explicitly specified in the graph).
Furthermore, we also explored the Purpose of the research, where the main reason for the research was examined. As is evident from Graph 9, the purpose was mainly to present, evaluate, compare or analyze BPMN.
8
1
3
6
4
4
1
1 1
1
1
0 2 4 6 8 10 12 14
EV IEEE WOK SD SL
Graph 8. Research method
Graph 9. Purpose of research
Our research included 37% of articles that addressed BPMN evaluation. The authors were primarily evaluating the suitability for use, the biggest issues of users, evaluating the modelling tools, etc.
1
4 4
9
7
1
8
0 2 4 6 8 10 12
Case study Interview Experiment Questionnaire Analysis
Explicitly specified Not explicitly specified
Presentation 20%
Evaluation 37% Comparison
20% Analysis
3.1. Analysis of references
The connection between the 31 relevant articles obtained during SLR is represented in Figure 3. Connections (arrows) represent citations between articles, where each article (node) can have either an incoming or outgoing connection, or both. If a connection goes from node A to node B, this means that article A quoted article B. The graph designed from references of articles, was made with Prefuse – the information visualization toolkit [15].
It should be noted, that from the set of all relevant articles, only 12 of them have incoming and outgoing connections. Furthermore, three articles have incoming connections and another 10 articles have outgoing connections. There are also six articles that have no reference to other relevant articles and were also not cited in other articles. These articles are: A4, A7, A10, A11, A28, A31 and are not shown in Figure 3.
Figure 3. Network of relevant articles
Articles with the maximum number of incoming connections are as follows: A12, A21, A18 and A29. These connections clearly illustrate the frequency of referencing of articles. Article A12 has 12 incoming connections and is the most frequently cited article of our SLR. It is followed by article A21, with 10 incoming connections. The articles with the highest number of outgoing connections are A17 (seven connections), A18 and A26 (each with five connections).
all connections. All four of the most cited articles together account for 63.79% of all connections.
Citations between articles were investigated also from the perspective of self-citations. While there are several different types of self-citations, we analyzed the relevant articles according to [9], which defines self-citation also as a citation, where ‘the papers share the first author’.
The results of our analysis indicate, that 41% of all citations are made up of self-citations, which is in accordance with the number of self-citations as reported by Couto et al. [9]. In research [8], authors reported that the scientific work tends to receive between 20% and 40% of self-citations. This is also visualized in Figure 3, where dashed arrows represent self-citations, which share the first author.
Self-citations enable researchers to connect their present work with the previous findings without too much repetition [9] and are also a natural part of the communication process [8].
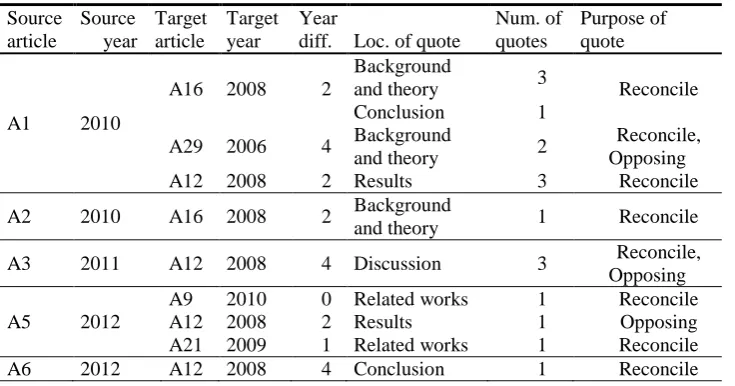
To complement the graph in Figure 3, a deeper examination of each connection between relevant articles was made. The objective was to determine in which part the article was quoted, e.g. in the introduction, related work, research method, etc. Table 7 presents the result of this analysis. The attributes Location of quote and Number of quotes are the most essential attributes. The allowed values of the attribute Location of quote are Introduction, Background and theory, Related works, Research method, Results, validation of Hypotheses/RQ, Discussion, Conclusion, Implications for the future, and Limitations. The allowed values of the attribute Purpose of quote are: Reconcile (largely explained indication of Target article), Opposing (Source article opposes to Target article), Direct quote (direct indication of Target article), and Example (presentation of an example from Target article).
Only 22 articles were marked as Source articles. Another six out of 31 did not contain any quotes from a relevant article, whereas another three articles were included indirectly, because they have only been quoted by other relevant articles, but did not quote any of them.
Table 7. Locations of quotes Source
article
Source year
Target article
Target year
Year
diff. Loc. of quote
Num. of quotes
Purpose of quote
A1 2010
A16 2008 2
Background
and theory 3 Reconcile
Conclusion 1
A29 2006 4 Background
and theory 2
Reconcile, Opposing
A12 2008 2 Results 3 Reconcile
A2 2010 A16 2008 2 Background
and theory 1 Reconcile
A3 2011 A12 2008 4 Discussion 3 Reconcile,
Opposing
A5 2012
A9 2010 0 Related works 1 Reconcile
A12 2008 2 Results 1 Opposing
A21 2009 1 Related works 1 Reconcile
Source article Source year Target article Target year Year
diff. Loc. of quote
Num. of quotes
Purpose of quote
A8 2013
A26 2011 1 Discussion 1 Opposing
A21 2009 3 Research
method 1 Reconcile
A12 2008 A29 2006 2 Introduction 1 Reconcile
A13 2007 A29 2006 1 Introduction 1 Reconcile
Results 1
A14 2011 A1 2010 1
Background
and theory 1 Reconcile
A15 2012
A19 2010 2 Related works 1 Reconcile
A18 2010 2 Introduction 1 Reconcile
A21 2009 3
Introduction 1
Reconcile Background
and theory 1
Related work 1
A17 2012
A24 2010 2
Background
and theory 4
Example, Direct Quote
Discussion 1
Reconcile
Limitations 1
A26 2011 1
Introduction 1
Reconcile Background
and theory 3
Discussion 1 Direct quote
Conclusion 1 Reconcile
A21 2009 3 Introduction 1 Reconcile
A20 2010 2
Introduction 2 Reconcile
Background
and theory 4
Reconcile, example
Results 3
Reconcile
Conclusion 2
A12 2008 4
Introduction 1
Reconcile Background
and theory 1
A18 2010 2
Introduction 1
Reconcile Background
and theory 1
Research
method 1
A19 2010 2
Introduction 1
Reconcile Background
and theory 1
Results 1
A18 2010
A29 2006 4
Background
and theory 1 Reconcile
A13 2007 3
Background
and theory 1 Reconcile
Source article Source year Target article Target year Year
diff. Loc. of quote
Num. of quotes
Purpose of quote
A16 2008 2
Background
and theory 1 Reconcile
A12 2008 2
Background
and theory 1
Reconcile
Results 2
Conclusion 1
A21 2009 1
Introduction 1
Reconcile Background
and theory 1
A19 2010
A20 2010 0
Introduction 1
Reconcile Background
and theory 1
A18 2010 0 Introduction 1 Reconcile
A21 2009 1 Background
and theory 1 Reconcile
A20 2010
A21 2009 1
Introduction 1
Reconcile Implications
for future 1
A18 2010 0
Introduction 1
Reconcile Background
and theory 1
A29 2006 4
Background
and theory 2 Reconcile
A12 2008 2
Background
and theory 1 Reconcile
A21 2009 A29 2006 3 Introduction 1 Reconcile
A12 2008 1 Results 1 Reconcile
A22 2012
A12 2008 4
Background
and theory 1 Reconcile
A18 2010 2 Introduction 1 Reconcile
A14 2011 1
Background
and theory 1 Reconcile
A23 2010
A18 2010 0
Background
and theory 1 Direct quote
A20 2010 0
Validation of
hypotheses/RQ 1 Direct quote Implications
for future 2 Reconcile
A21 2009 1
Introduction 1
Example Background
and theory 3
Limitations 1
A24 2010
A20 2010 0 Background
and theory 1 Reconcile
A18 2010 0 Introduction 1 Reconcile
Source article
Source year
Target article
Target year
Year
diff. Loc. of quote
Num. of quotes
Purpose of quote and theory
A21 2009 1
Background
and theory 4
Reconcile Validation of
hypotheses/RQ 3
A12 2008 2
Background
and theory 1 Reconcile
Results 1
A25 2006 A29 2006 0 Related work 1 Reconcile
Results 2 Opposing
A26 2011
A24 2010 1
Background
and theory 1
Reconcile
Discussion 1
Implications 1
A21 2009 2
Introduction 1
Reconcile Background
and theory 1
A20 2010 1
Background
and theory 1
Reconcile
Results 1
Discussion 1
A18 2010 1 Research
method 1 Reconcile
A12 2008 3 Discussion 1 Reconcile
A27 2013 A3 2011 1 Discussion 2 Opposing
A30 2014
A5 2012 2
Introduction 2 Direct quote
Background 1 Direct quote
Results 1 Reconcile
A12 2008 6 Results 2 Reconcile
A16 2008 6 Background 1 Reconcile
Results 1 Reconcile
Notes: Source article – articles, where the references were reviewed, Source year – the year when the source article was published, Target article – cited article, Target year – the year when the target article was published, Year differential – difference in years between source and target article, Location of quote – represents the location, where the target article was quoted, Number of quotes – represents the number of quotes of target article in source article, within certain location, Purpose of quote – represents the purpose of the use of the quote
locations, the percentages are lower: Conclusion (5.47%), Discussion (7.03%), Related works (3.91%), Validation of hypothesis/RQ (3.13%), Implications for future work (3.13%), Research method (2.34%), and Limitations (1.56%). The purpose, of the great majority (77.94%) of citations, was Reconcile. The percentages of the other purposes are: Opposing (8.82%), Direct quote (8.82%) and Example (4.41%).
4.
Discussion
In the first part of this section, we discuss three main issues, covered in our research questions. In the second part of this section, other fields of interest, identified through research, are discussed.
4.1. Answers to research questions
Based on the relevant articles (Table 6), the answers to the RQ, defined in section 2.1 are provided.
Are there any empirical insights about the level of BPMN acceptance?
In order to answer the stated research question, the subset of relevant articles, which addressed the level of acceptance of BPMN were further analyzed.
The earliest known research regarding the acceptance of BPMN was conducted in 2006, which is reasonable, since the standard was first introduced in 2004. In light of this, [A29] and its earlier study [A25] stated that BPMN was a recently proposed standard driven by the demand for a graphical notation that complements the BPEL4WS standard for executable business processes. This gave BPMN a technical focus although the intention of the BPMN designers was to develop a modelling technique that could be applied to typical business modelling activities as well.
Three years after the introduction of BPMN, an article [A4] from 2007 presented a business process modelling game to learn BPMN 1.0 notation. The article reported that serious games could be a good opportunity to enrich higher education, to simulate scenarios of the real world and to enhance didactics for students. This was once again addressed in a 2008 [A16], where authors argued that BPMN is accepted and used among business people as well as among academics. This was again confirmed in 2010 [A1], where authors reported that BPMN seeks to serve both: (1) a broad audience in the business segment and (2) to reach out to the technical community. An example of the use of BPMN in the educational field was demonstrated in article [A4], where once again, a business process modelling game to learn BPMN notation was presented.
discussed in [A13], where the authors concluded that, in some cases, an increase in constructs did not always lead to better modelling results.
The acceptance of BPMN is also reflected in a number of modelling tools that support BPMN, which are clearly defined in BPMN 2.0 specification [32]. BPMN 2.0 states that a software can claim compliance or conformance with BPMN if and only if the software fully matches the applicable compliance points, defined in the specification. On the other hand, if a software only partially matches such compliance points, a software can claim only that it is based on BPMN. In this light, authors specified ten modelling tools and exposed the most popular tool, namely Microsoft Visio [A18]. However, according to BPMN 2.0 specification, Microsoft Visio cannot be classified into BPMN process modelling tools. Instead, it is only a diagraming tool [31] since it does not implement BPMN abstract and DI meta-models. As such, diagraming tools do not ensure any syntax check and do not enable implementation or simulation, which can be achieved by meta-model based tools (e.g. Bonita, Signavio, BizAgi, IBM WebSphere).
An article [A24] from 2010 performed an analysis of BPMN using a theory of ontological expressiveness and explored actual grammar use. Their research uncovered five contextual factors that appear to influence the usage of BPMN: the use of modelling tools, the use of modelling conventions, the modeller experience, the modelling role and the modelling purpose. As stated by authors, BPMN satisfies these conditions. Therefore, BPMN is justifiably proclaimed as the de facto standard for process modelling [A18]. A high degree of acceptance is also indicated in [A19] from 2010, where the results show that in average, BPMN users do not undergo any formal training in grammar usage. In total, 418 participants learned BPMN via self-education, while 109 attended any kind of formal training. Modellers from IT found BPMN grammar to be particularly useful for their (IT-oriented) process modelling tasks, as reported by [A20], [A23].
More recently, research [A15] conducted in 2012 analysed the success in interpreting a business process description. In light of the experiment, participants used an established graphical notation (BPMN) and an alternative textual notation (based on written use-cases). The best results came from presenting the business process twice: in form of a written use-cases, followed by equivalent BPMN diagrams. As the authors concluded, this was the most effective way to build up a comprehensive process.
A few months after the BPMN 2.0 specification was published (2012), article [A5] reported that BPMN was still being perceived as the leading standard with respect to business process and workflow modelling languages. It also reported that BPMN 2.0 was being used by nearly 40% of the interviewed users, while almost 30% of them used BPMN 1.2 and 15% used a combination of both.
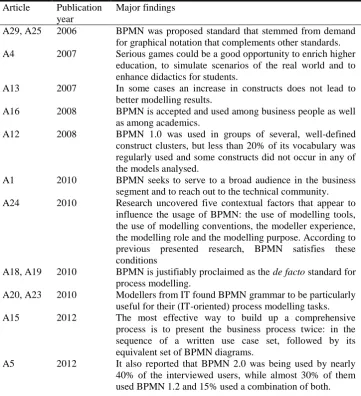
The above results of the first research question are summarized in Table 8.
Table 8. Findings for 1. RQ Article Publication
year
Major findings
A29, A25 2006 BPMN was proposed standard that stemmed from demand for graphical notation that complements other standards. A4 2007 Serious games could be a good opportunity to enrich higher
education, to simulate scenarios of the real world and to enhance didactics for students.
A13 2007 In some cases an increase in constructs does not lead to better modelling results.
A16 2008 BPMN is accepted and used among business people as well as among academics.
A12 2008 BPMN 1.0 was used in groups of several, well-defined construct clusters, but less than 20% of its vocabulary was regularly used and some constructs did not occur in any of the models analysed.
A1 2010 BPMN seeks to serve to a broad audience in the business segment and to reach out to the technical community. A24 2010 Research uncovered five contextual factors that appear to
influence the usage of BPMN: the use of modelling tools, the use of modelling conventions, the modeller experience, the modelling role and the modelling purpose. According to previous presented research, BPMN satisfies these conditions
A18, A19 2010 BPMN is justifiably proclaimed as the de facto standard for process modelling.
A20, A23 2010 Modellers from IT found BPMN grammar to be particularly useful for their (IT-oriented) process modelling tasks. A15 2012 The most effective way to build up a comprehensive
process is to present the business process twice: in the sequence of a written use case set, followed by its equivalent set of BPMN diagrams.
A5 2012 It also reported that BPMN 2.0 was being used by nearly 40% of the interviewed users, while almost 30% of them used BPMN 1.2 and 15% used a combination of both.
Graph 10. BPMN acceptance by Google Trends*
According to Graph 6, where the relevant articles are ordered by the year of publication, this data can be compared to Google trends (Graph 10). An increase between 2008 and 2011 can be noted in both graphs. However, the validity of this conclusion might be impacted due to the low number of relevant articles.
Additionally, the value from Graph 10, can be mapped to Gartner’s Hype Cycle [19]. We can say with great certainty that BPMN has already passed the first phase, called “Technology Trigger.” The high level of popularity in the years 2009, 2010, and 2011 and subsequent decrease in popularity over the last two years, indicates that BPMN is now somewhere in the second phase of Gartner’s Hype.
After all the given facts from relevant articles and other given criteria, we can provide a response to the first research question. Empirical insights about the level of acceptance are present and the number of insights (i.e. Google Trends) grows through the years. We can confirm that, with respect to all existing and reviewed literature, BPMN is now a strongly accepted standard in the field of business process modelling. However, the degree of acceptance may be subject to further research.
For what purposes is BPMN used?
In addition to analysing the acceptance of BPMN, we also investigated for what purposes the standard used was used. To this end, it was concluded that BPMN appears to have been designed to fit a wider variety of process modelling purposes, beyond the typical communication and requirements specification [A21]. BPMN is generally used for typical AS-IS application areas such as: business analysis, workflow specification, requirements analysis, and system configuration [A18]. Article [A5] indicates that BPMN can also be used for description, e.g. documenting (52%), simulation (11%), and execution of processes (37%).
* Assessed on: 4 November 2014
30 41
51
71 74
79
87 91 85
81 90
25 35 45 55 65 75 85 95
2004 BPMN
1.0
2005 2006 2007 2008 BPMN
1.1 2009 BPMN
1.2
2010 2011 BPMN
2.0
Graph 11. Purpose of use
This numbers are confirmed with states from article [A18] from 2010, which said that Microsoft Visio is the most popular tool for modelling. There we see that the purpose of the use is more than half of the cases, writing the documentation. There is actually no need for syntax checks and execution or simulation.
Furthermore, the authors stated that BPMN was probably the best choice for descriptive purposes at the time of the research (2011) in academia and other organizations [A6].
BPMN has also been used for modelling processes in the industry. Article [A31] presents the practical uses of BPMN in a reference model for designing business processes in a demand-driven fruit supply chain. The BPMN was chosen in order to ensure a smooth connection to SOA-based information systems. The authors further discussed that the developed model in BPMN makes a valuable starting-point for the implementation of the designed process models in an SOA platform.
BPMN is also often used in combination with other technologies. Article [A8] focused on a concrete example with an IT background. The experiment showed that YAWL notation suffered from weak discriminability of the XOR and AND routing symbols. In contrast, BPMN offers various options for XOR routing symbols. In [A28] it was shown how a network model1 can be derived from BPMN, which was selected based on the expectations of using a widely adopted standard.
Despite many different purposes for the use of the BPMN, we concur that the basic and most important purpose of use remains the description of business processes.
1Network model is defined as subset of BPMN 2.0 by mapping it onto the basic entities of the network.
Documenting 52%
Simulation 11% Execution of
What are the advantages and disadvantages of the use of BPMN?
The advantages of BPMN identified in relevant articles are as follows. At its core, BPMN allows for the creation of a Business Process Diagram, which represents the activities of the business process and the flow controls that define the order in which they are performed [A7]. According to [A9], BPMN is considered easy to understand and apply. BPMN also supports the transformation of business models in execution languages, like BPEL, which is a definite advantage of BPMN. Also, organizational structures are modelled in manageable pools or swim-lanes. Thus, a good optical representation of the B2B (business-to-business) and B2C (business-to-consumer) sector can be achieved.
When comparing BPMN to EPC, which is an alternative notation for business process modelling, the comparison in [A19] notes that both notations differ considerably in their ability to define real world domains in a complete and clear manner. Specifically, they found BPMN to be more ontologically complete than EPC. One of the most important advantages is also the composition of BPMN. Article [A25] shows that BPMN performs well in terms of capturing the control flow and handling data in a process.
A different perspective is presented by the authors in [A11], where extensions of BPMN are proposed. They define relevant subsets of BPMN, extend them with the concept of cost, which enables process re-engineering and analysis. On the basis of the article, we can assume that BPMN is commonly used in combination with other technologies and is also very extensible.
In article [A30] an approach capable of adapting a simplified version of BPMN to different specific domains, generating simpler BPMN notations specifically adapted to the given domain. Another adoption of BPMN is reported in [A10], where author introduce a concept of configurable BPMN to model and represent all the possible variations of the Enterprise domain.
With regard to the tools that support BPMN modelling, article [A17] examines how the use of seven different features of modelling tools affects usage beliefs. The authors stress that, in general, tool functionality can positively contribute to usefulness and ease-of-use perceptions as well as general satisfaction with the modelling language. Similar issues are discussed in [A26].
The relevant articles, obtained by the SLR, also address the disadvantages of BPMN. Specifically, in [A14] authors try to adjust BPMN to the needs of the medical/health domain. In the paper, the idea of incorporating role information in colours of tasks in the BPMN model, is presented. They state that the utilization of BPMN as modelling language in a specific domain may be difficult.
Article from 2011 [A3] extensively highlights the weak points in BPMN. Author exposes that BPMN fails to guarantee that standard-confirming business process models are interoperable, further it fails to constitute a basis for reliable communication of business models between different stakeholders, etc. In contrast, article [A27] argues that criteria in [A3] overemphasize less important aspects, while ignoring some decisive ones.
notations. One very specific disadvantage, detected in the article, is that the semantics of the UML Activity Diagram in version 2.x has been more clearly defined than in BPMN and the separation of control and data flow introduces additional complexity.
In [A11], it is reported that BPMN is very powerful with respect to the representation of activities and their cooperation, but it does not natively support the concept of cost in process, which would enable process re-engineering and analysis.
It can be concluded that the rapid spread of BPMN would suggest that advantages outnumber the disadvantages. When taking the aforementioned disadvantages into consideration, the standard is still perceived as the de facto standard in the business process modelling field [A5].
4.2. Others fields of interest
Our research aprioristically includes the aforementioned research questions. Posteriorly, we also came across relevant topics, which are presented below.
To use BPMN in practice, the use of modelling tools is strongly encouraged. There is also the option of drawing a business process by hand, but it is not a common practice. Modelling with tools is much easier for the user, because it usually offers a certain (core or full) range of elements and supports the validation of end-models. Some tools also provide model repositories in which models can be stored and also imported into different notations for process modelling. In 1993, the first work sequences appeared to aid users describe the workflows and to document the process steps [7]. Nowadays, the situation is different in the following manner. Article [7] reports that 60% of interviewees used a tool with an embedded simulation environment. The most preferred BPMN editor is BizAgi [3], but the best open-source software is Bonita, according to [7]. Another article [44], which also deals with modelling tools, reports that they became very sophisticated and provided extended functionality. In the scope of our SLR, the most frequently reported tools were identified, where Microsoft Visio was by far the most popular tool.
As previously mentioned, one tool can enable few different notations for process modelling. One modelling language can complement the other, in order to achieve the best modelling results possible. During our SLR research, the extensions for BPMN were identified. In [47] the authors concur that a great part of the success of the modelling has to do with the ability to express the different needs of a business as well as to have a notation in which the needs can be described. BPMN provides an opportunity to incorporate, e.g. security requirements, which allows us to improve this aspect of the system from the early stages of software development. The other example of extending BPMN is described in [14], where the weaknesses of BPMN are identified, regarding its suitability for choreography modelling. To this end, several extensions are proposed to overcome these limitations.
Some users identified BPMN as complex [17], and see the solution of this in simplifying the BPMN notation. They change the elements that could provoke confusion and came to the conclusion that their proposed solution, SBPMN (Simple BPMN), allows users of all levels to model or design the processes without any technical knowledge.
[2] the usability of BPMN 1.1 and UML AD 2.x was analysed. The authors agreed that UML AD is at least as usable as BPMN. Another comparable notation to BPMN is EPC (Event-driven Process Chain). In [23] an acceptance comparison between BPMN and EPC was made. The analysis show that BPMN leads to more stringent modelling, which diminishes the number of modelling errors. The authors also highlighted that BPMN was developed ten years later than EPC and could be based on existing experiences. It is also important to remember that the transformation from EPC into BPMN is still possible.
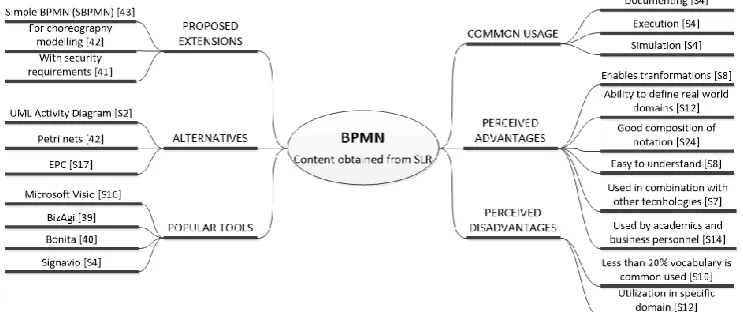
Figure 4 shows the current chapter and provides a quick summary of important content of BPMN discussed in this section. All six concepts are further specified and rely only on conclusions made in the context of this research.
Figure 4. A summary of relevant content
5.
Conclusions
BPMN still holds the title as the de facto standard in the process modelling field. This can be confirmed with articles from our SLR. It can be also stated that BPMN is suitable for modelling many different types of processes. Also, BPMN is readable even for those without any knowledge of the notation. An important aspect of existing literature is an analysis of BPMN elements. Some findings suggest that only a limited set of elements are used more frequently. It was also reported that some users might not understand all the elements and consequently do not use them. Considering such limitations, BPMN is still often used, especially in combination with other languages/notations for process modelling.
different information when searching (e.g. abstract, authors, title, keywords), where the majority (67%) had several options to manage the results. The second limitation is choosing adequate digital libraries. Digital libraries have been selected in relation to source [21]. We used: ACM Digital Library, Engineering Village, IEEEXplore, ISI Web of Knowledge, Science Direct and SpringerLink. To access the desired literature, we relied on access provided by the University of Maribor, which represents a third limitation.
5.1. Implications and future work
The presented results have implications in both theory and practice. From a theoretical point of view, there is still a lot of potential for research in the field of BPMN. For example, in [29] the authors presented a BPMN notation, where instead of lanes, they used different colours to distinguish different roles. Additional research from different business perspectives (e.g. with colouring lanes) could help optimize the notation. This could help to additionally raise the level of usage. As stated in [43], there are “known knowns” about BPMN and, on the other hand, “unknown unknowns”, meaning that several fields of research remain unknown. To reveal a small part of these unknowns, we plan on conducting a survey on the acceptance of BPMN on the basis of current research. Additionally, in order to better judge the usability of BPMN for business users, a deeper understanding of its advantages and disadvantages has to be reached.
In practice, the widespread use of the BPMN standard is a clear sign for companies to at least partially start adopting the standard. As previously mentioned, BPMN can ensure a bridge between IT and the business sector. BPMN models can ensure transparent business processes and obligate the company to optimize processes, reduce costs, and increase productivity. All the identified purposes of use, advantages and disadvantages in our research can also be a benefit to vendors of BPMN modelling tools. They can upgrade their product with an extended set of elements, or even add features to entice users (for example, allowing colour at all levels of the model). Another proposal for vendors would also be to enable extensions in tools (e.g. extensions for choreography modelling [14] or security requirements [47]).
Reference
1. Aagesen, G., Krogstie, J. Analysis and Design of Business Processes Using BPMN. Handb. Bus. Process Manag. 1 (2010). DOI: 10.1007/978-3-642-00416-2
2. Birkmeier, D., Overhage, S. Is BPMN Really First Choice in Joint Architecture Development? An Empirical Study on the Usability of BPMN and UML Activity Diagrams for Business Users. QoSA.
3. Bizagi. BizAgi [Online]. http://www.bizagi.com/ [30 May 2014]
4. Börger, E. Approaches to modeling business processes: a critical analysis of BPMN, workflow patterns and YAWL. Softw Syst Model 11: 305–318, (2011).
6. Bulander, R. A Conceptual Framework of Serious Games for Higher Education. E-bus. (ICE-B), Proc. 2010 Int. Conf.
7. Chinosi, M., Trombetta, A. BPMN: An introduction to the standard. Comput Stand Interfaces 34: 124–134, (2012).
8. Costas, R., van Leeuwen, T.N., Bordons, M. Self-citations at the meso and individual levels: effects of different calculation methods. Scientometrics 82: 517–537, (2010). 9. Couto, F.M., Pesquita, C., Grego, T., Veríssimo, P. Handling self-citations using Google
Scholar. Int J pf Sci Inf Bibliometr 13, (2009).
10. Cruz, E.F., Machado, R.J., Santos, M.Y. From Business Process Modeling to Data Model: A Systematic Approach. 2012 Eighth Int. Conf. Qual. Inf. Commun. Technol. (September 2012). DOI: 10.1109/QUATIC.2012.31
11. Curtis, B., Kellner, M.I., Over, J. Process modeling. Commun ACM 35: 75 – 90, (1992). 12. Davenport, T.H. The Coming Commoditization of Processes. Harv. Bus. Rev.
13. Decker, G., Grosskopf, A., Barros, A. A Graphical Notation for Modeling Complex Events in Business Processes. 11th IEEE Int. Enterp. Distrib. Object Comput. Conf. (EDOC 2007) (October 2007). DOI: 10.1109/EDOC.2007.41
14. Decker, G., Puhlmann, F. Extending BPMN for Modeling Complex Choreographies. In: OTM’07 Proceedings of the 2007 OTM Confederated international conference on On the move to meaningful internet systems: CoopIS, DOA, ODBASE, GADA, and IS. (2007), p. 24–40.
15. Design, B.I. of. Prefuse [Online]. (2007). http://prefuse.org/
16. Dubani, Z., Soh, B., Seeling, C. A Novel Design Framework for Business Process Modelling in Automotive Industry. 2010 Fifth IEEE Int. Symp. Electron. Des. Test Appl. (2010). DOI: 10.1109/DELTA.2010.48
17. Fernández, H.F., Palacios-González, E., García-Díaz, V., G-Bustelo, B.C.P., Martínez, O.S., Manuel, J., Lovelle, C. SBPMN - An easier business process modeling notation for business users. Comput Stand Interfaces 32: 18–28, (2010).
18. Figl, K., Recker, J., Mendling, J. A study on the effects of routing symbol design on process model comprehension. Decis Support Syst 54: 1104–1118, (2013).
19. Gartner. Gartner [Online]. http://www.gartner.com/ [30 May 2014]
20. Google. Google Trends [Online]. http://www.google.com/trends/ [30 May 2014]
21. Kitchenham, B., Charters, S. Guidelines for performing Systematic Literature Reviews in Software Engineering. EBSE 2007-001.
22. Kitchenham, B., Pearl Brereton, O., Budgen, D., Turner, M., Bailey, J., Linkman, S. Systematic literature reviews in software engineering – A systematic literature review. Inf Softw Technol 51: 7–15, (2009).
23. Kruczynski, K. Business process modelling in the context of SOA – an empirical study of the acceptance between EPC and BPMN. World Rev Sci Technol Sustain Dev 7: 161 – 168, (2010).
24. Magnani, M., Montesi, D. BPMN: How Much Does It Cost? An Incremental Approach*. BPM’07 Proc. 5th Int. Conf. Bus. Process Manag.
25. Mendeley. Mendeley - Reference management software [Online]. http://www.mendeley.com/ [30 May 2014]
26. Milanović, M., Gašević, D., Wagner, G. Combining Rules and Activities for Modeling Service-Based Business Processes. 2, (2008).
27. Muehlen, M., Recker, J., Indulska, M. Sometimes Less is more: Are Process Modeling Languages Overly Complex? EDOC Conf. Work. 2007. EDOC ’07. Elev. Int. IEEE (2007). DOI: 10.1109/EDOCW.2007.30
28. Muehlen, M., Recker, J. How Much Language is enough? Theoretical and Practical Use of the Business Process Modeling Notation. Proc. 20th Int. Conf. Adv. Inf. Syst. Eng.
30. OMG (Object Management Group). Business Process Model and Notation Specification [Online]. http://www.omg.org/spec/BPMN/2.0
31. OMG. BPMN.ORG [Online]. www.bpmn.org [30 May 2014] 32. OMG. OMG Unified Modeling Language Specification. , (2011).
33. Ottensooser, A., Fekete, A., Reijers, H.A., Mendling, J., Menictas, C. Making sense of business process descriptions: An experimental comparison of graphical and textual notations. J Syst Softw 85: 596–606, (2012).
34. Recker, J., Indulska, M., Rosemann, M., Green, P. The ontological deficiencies of process modeling in practice. Eur. J. Inf. Syst. (June 15, 2010). DOI: 10.1057/ejis.2010.38
35. Recker, J., Rosemann, M., Green, P., Indulska, M. Do Ontological Deficiencies in Modeling Grammars Matter? Mis Q 35: 57–79, (2011).
36. Recker, J., Rosemann, M. The Measurement of Perceived Ontological Deficiencies of Conceptual Modeling Grammars. Data Knowl Eng 69: 516–532, (2010).
37. Recker, J., Wohed, P., Rosemann, M. Representation Theory versus Workflow Patterns - The Case of BPMN. ER’06 Proc. 25th Int. Conf. Concept. Model. (2006). DOI: 10.1007/11901181_7
38. Recker, J. BPMN Modeling – Who, Where, How and Why. BPTrends.
39. Recker, J. Business Process Modeling - A Comparative Analysis. J Assoc Inf Syst 10: 333– 363, (2009).
40. Recker, J. Opportunities and constraints: the current struggle with BPMN. Bus Process Manag J 16: 181–201, (2010).
41. Recker, J. Continued use of process modeling grammars: the impact of individual difference factors. Eur J Inf Syst 19: 76–92, (2010).
42. Recker, J. Explaining usage of process modeling grammars: Comparing three theoretical models in the study of two grammars. Inf Manag 47: 316–324, (2010).
43. Recker, J. BPMN Research: What We Know and What We Don’t Know. 4th Int. Work. BPMN 2012 (2012). DOI: 10.1007/978-3-642-33155-8_1
44. Recker, J. “Modeling with tools is easier, believe me” The Effects of Tool Functionality on Modeling Grammar Usage Beliefs. Inf Syst 37: 213–226, (2012).
45. Reisig, W. Remarks on Egon Börger: “Approaches to model business processes: a critical analysis of BPMN, workflow patterns and YAWL, SOSYM 11:305–318.” Softw Syst Model 12: 5–9, (2013).
46. Ritter, D., Ackermann, J., Bhatt, A., Hoffmann, F.O. Building a Business Graph System and Network Integration Model Based on BPMN. Bus. Process Model Not. - Third Int. Work. BPMN 2011.
47. Rodriguez, A., Fernandez-Medina, E., Piattini, M. A BPMN Extension for the Modeling of Security Requirements in Business Process. IEICE Trans Inf Syst E90-D: 745–752, (2007). 48. Rosemann, M., Recker, J., Indulska, M., Green, P. A Study of the Evolution of the
Representational Capabilities of Process Modeling Grammars. 18th Int. Conf. CAiSE 2006 (2006). DOI: 10.1007/11767138_30
49. Sharma, D.K., Rao, V. Configurable Business Process Modeling Notation. In: 2014 IEEE International Advance Computing Conference (IACC), p. 1424–1429.
50. Solís-Martínez, J., Espada, J.P., Pelayo G-Bustelo, B.C., Lovelle, J.M.C. BPMN MUSIM: Approach to improve the domain expert’s efficiency in business processes modeling for the generation of specific software applications. Expert Syst Appl 41: 1864–1874, (2014). 51. Verdouw, C.N., Beulens, a. J.M., Trienekens, J.H., Wolfert, J. Process modelling in
demand-driven supply chains: A reference model for the fruit industry. Comput Electron Agric 73: 174–187, (2010).
Mateja Kocbek is teaching assistant at Institute of Informatics and Ph.D. student at Faculty of Electrical Engineering and Computer Science at the University of Maribor, Slovenia. Her main research interests include Business Process Management and mobile technologies.
Gregor Jošt received BSc in Computer Science & Informatics from the University of Maribor, Slovenia in 2010. Currently he is a Ph.D. student and a teaching assistant at the University of Maribor. His main research interests include empirical investigations of Process Modeling and Automation, Cloud Computing, Web technologies and Mobile solutions. He has participated in several research and applied projects and appeared as an author or co-author in several scientific and conference papers.
Marjan Heričko is a full professor at the Institute of Informatics. He is the head of the Information systems laboratory and Deputy Head of the Institute of informatics. He received his PhD in Computer Science from University of Maribor in 1998. His main research interests include all aspects of information systems development, software and service engineering, agile methods, process frameworks, software metrics and business process modelling. Dr. Heričko has been a project or work co-ordinator in several applied projects, project or work co-ordinator in several international research projects and committee member and chair of several international conferences.
Gregor Polančič is an assistant professor in Computer Science & Informatics at University of Maribor, Slovenia. He received his Ph.D. in Computer Science & Informatics from the same university in 2008. His main research interests include empirical investigations of Business Process Modeling and Management, IT management, IT acceptance, e-communication and e-collaboration. He has appeared as an author or co-author in more than 15 peer-reviewed scientific journals. In all, his bibliography contains more than 200 records.