In vivo Observation of the Release of Norepinephrine and In Vivo Optical Studies on the Direct and Indirect Paths of the Striatum
Samuel Clark
Submitted in partial fulfillment of the requirements for the degree of Doctor of
Philosophy under the Executive Committee of the Graduate School of
Arts and Sciences
COLUMBIA UNIVERISTY
© 2018 Samuel Clark All rights reserved
ABSTRACT
In vivo Observation of the Release of Norepinephrine and in vivo Optical Studies on the Direct and Indirect Paths of the Striatum
Samuel Clark
This thesis focuses on my work using optical techniques to study different brain regions in vivo. The ability to optically study neurons and the circuits they comprise in vivo is an important method to better understand their role in the healthy brain and their dysfunction in disease.
The first part of my thesis focuses on my work using on a collaborative project using a new optical probe to study norepinephrine synapses in vivo. In this work we were able to observe the effects of
amphetamine on norepinephrine release in vivo and observed some evidence of potential silent synapses.
I also describe a new method of cranial window surgery I developed for optical imaging. This technique called PHASOR, is faster, and has a higher success rate, than traditional surgical methods. The improvements demonstrated in this new surgical technique may enable more widespread use of optical imaging methods.
In the second part of my thesis, I used optical techniques to study the dorsal striatum in vivo in awake behaving mice. The direct and indirect paths of the dorsal striatum play an important role in motor
behavior and motor learning. Dysfunction in these paths has been implicated in motor diseases as well as in mood disorders. In this thesis, I provide a review of the anatomy and physiology of the neurons that comprise the dorsal striatum, and the circuits that they form. The next chapters describe my work using optical techniques to record from these neurons in vivo.
In my first set of experiments, I recorded from the direct and indirect paths during a behavioral task of anxiety and observed differential firing depending on the anxiety state of the mouse.
Finally, in a preliminary set of experiments, I record from the direct and indirect paths during tasks of motor learning. I found that both paths show changes in firing during motor learning and that these changes differ between the dorsolateral and dorsomedial striatum.
i
TABLE OF CONTENTS
LIST OF FIGURES………...…………...v
ACKNOWLEDGEMENTS……….…….…....viii
DEDICATION………...ix
PART 1: IN VIVO STUDY OF NOREPHINEPHRINE__________________________________________ CHAPTER 1: GENERAL INTRODUCTION TO NOREPINEPHRINE AND FFNS____________________ OVERVIEW………..……….……….1
THE ROLE OF NOREPINEPHRINE……….….………....…1
NOREPINEPHRINE DYSFUNCTION IN DISEASE.………...…2
NOREPINEPHRINE AND AMPHETAMINE.………...……...3
FLUORESCENT FALSE NEUROTRANSMITTERS.………...………...….4
CHAPTER 2: PRELIMINARY AND CONTROL STUDIES WITH FFNS____________________________ OVERVIEW………..……….………….6
FFN LOADING……….….………....…6
ECN127 PRETREATMENT BLOCKS LOADING.………...….7
METHODS……….….…….…………...…11
ii
CHAPTER 3: DESIGN OF A NOREPINEPHRINE OPTICAL TRACER FOR IMAGING INDIVIDUAL NORADRENERGIC SYNAPSES AND THEIR ACTIVITY IN VIVO_______________________________
ABSTRACT………...….14
INTRODUCTION……….……..………15
MATERIALS AND METHODS……….……….………..18
RESULTS AND FIGURES ……….………..………..25
DISCUSSION……….…..…..…43
CHAPTER 4: PIEZO HIGH ACCURACY SURGICAL OSTEAL REMOVAL (PHASOR): A TECHNIQUE FOR IMPROVED CRANIAL WINDOW SURGERY IN MICE___________________________________ ABSTRACT……….…………...46
INTRODUCTION……….………..47
PROTOCOL……….……..……48
RESULTS AND FIGURES ……….……….51
DISCUSSION………..……….………..57
PART 2
:
OPTICAL EXPERIMENTS IN THE STRIATUM__________________________________
CHAPTER 5: GENERAL INTRODUCTION_________________________________________________ OVERVIEW……….………...60THE BASAL GANGLIA……….…..…60
iii
THE DIRECT AND INDIRECT PATHS OF THE STRIATUM………..……….…….62
STRIATAL INTERNEURONS………...………..…65
DOPAMINE AND CANABINOID NEUROMODULATION OF THE STRIATUM………67
THE ROLE OF THE STRIATUM IN MOTOR BEHAVIOR………..………...68
STRIATAL DYSFUNCTION IN MOTOR DISEASE. ……….……….70
CHAPTER 6: IN VIVO RECORDING FROM THE DIRECT AND INDIRECT PATH CIRCUITS REVEALS INCREASED FIRING IN A MOUSE MODEL OF ANXIETY ____________________________________ ABSTRACT………..……..72
INTRODUCTION……….….……….…73
MATERIALS AND METHODS……….………..…….76
RESULTS AND FIGURES………..….…80
DISCUSSION……….…...……….………87
CHAPTER 7: GENERAL DISCUSSION____________________________________________________ DISCUSSION AND FUTURE DIRECTIONS………...89
REFERENCES_____________________________________________________________________98
APPENDIX _______________________________________________________________________116 PRELIMINARY WORK: THE STRIATUM IN MOTOR SKILL LEARNING__________________________
iv
ABSTRACT………..116
INTRODUCTION………..………...117
MATERIALS AND METHODS………..………119
RESULTS AND FIGURES ………..……….….…...122
v
LIST OF FIGURES
CHAPTER 1: GENERAL INTRODUCTION TO NOREPINEPHRINE AND FFNS____________________
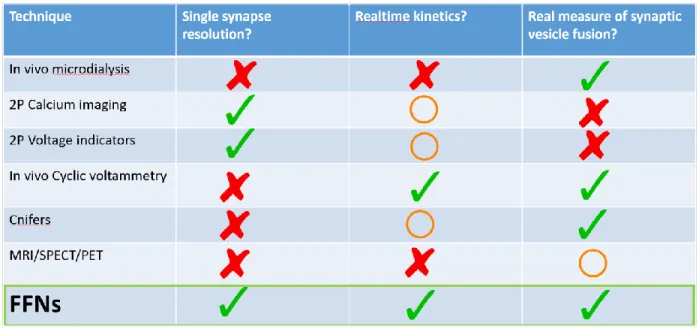
Figure 1: Limitations of different in vivo imaging techniques..………...……….5
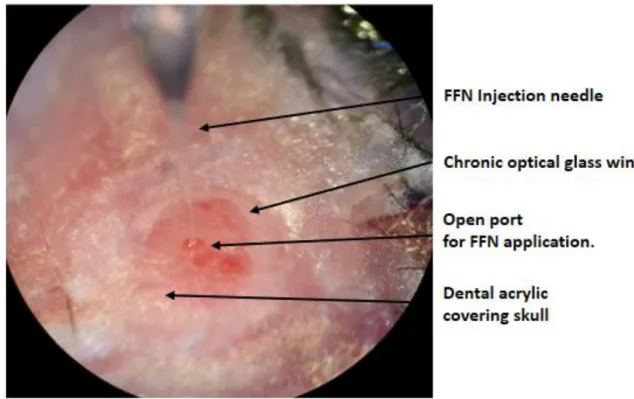
CHAPTER 2: PRELIMINARY AND CONTROL STUDIES WITH FFNS____________________________ Figure 2: Diagramed image of an implanted cranial window with a chronic glass port for nanoinjecting FFN ……...……….6
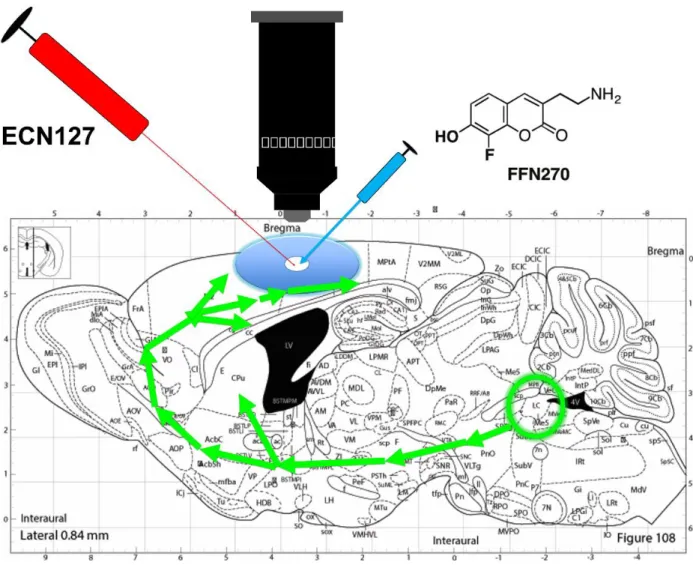
Figure 3: Diagram of ECN127 experiment………..……….………8
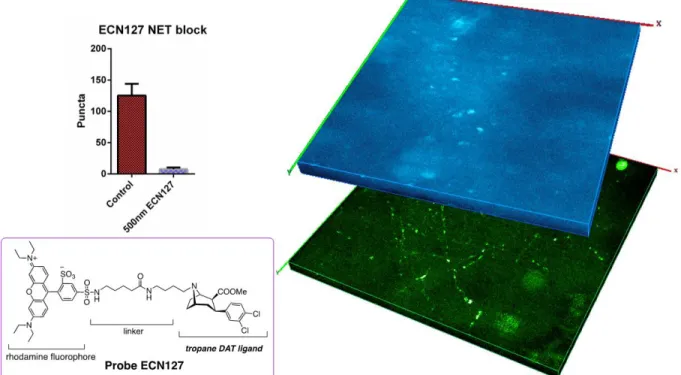
Figure 4: Pretreatment with NET inhibitor ECN127 blocks FFN270 loading…...………..9
Figure 5: Immunostaining of viral injection into the LC ………..………10
CHAPTER 3: DESIGN OF A NOREPINEPHRINE OPTICAL TRACER FOR IMAGING INDIVIDUAL NORADRENERGIC SYNAPSES AND THEIR ACTIVITY IN VIVO_______________________________ Figure 6: Design of NE-FFNs………..……….….34
Figure 7: FFN270 is a VMAT2 substrate………..……….……….35
Figure 8: FFN270, but not FFN102, labels noradrenergic neurons in the locus coeruleus (LC)..….36
Figure 9: FFN270 is located in NE axons of the barrel cortex ……….……….……….37
Figure 10: Axonal FFN270 release under electrical and optogenetic stimulation reveals two populations of NE release sites in the cortex ……….…………..….38
Figure 11: Examining NE axons and release sites in living animals……….………..…….40
Figure 12: Amphetamine releases FFN270 from cortical NE projections in vivo .…….…………..….41
CHAPTER 4: PIEZO HIGH ACCURACY SURGICAL OSTEAL REMOVAL (PHASOR): A TECHNIQUE FOR IMPROVED CRANIAL WINDOW SURGERY IN MICE. ___________________________________ Figure 13: Pictures of PHASOR………..……….………...………53
vi
Figure 14: Comparison of success rate in training for PHASOR or dental drill surgery.………54 Figure 15: Multiphoton imaging in vivo through a cranial window thinned with PHASOR …………55 Table 1: Equipment List……….………...….……55 CHAPTER 5: GENERAL INTRODUCTION TO THE BASAL GANGLIA___________________________ Figure 16: Direct and indirect paths of the striatum…..………63 Figure 17: Four types of SPN axon collaterals in order of most commonly observed to least
commonly observed.………..………64 Figure 18: Different types of interneurons and microcircuit interactions in the striatum.…..………64 CHAPTER 6: IN VIVO RECORDING FROM THE DIRECT AND INDIRECT PATH CIRCUITS REVEALS INCREASED FIRING IN A MOUSE MODEL OF ANXIETY_____________________________________ Figure 19: Tim’s algorithm to detect Ca2+ peaks …….………...….……82 Figure 20: Time spent in each zone of the elevated plus maze ……….83 Figure 21: Rate of calcium peaks per minute in the different zones of the elevated plus maze.…..84 Figure 22: Annotation of different calcium peaks………….……….85 Figure 23: Behaviors displayed by mice in the elevated plus maze….………...………….86 APPENDIX: THE STRIATUM IN MOTOR SKILL LEARNING___________________________________ Figure 24: Diagram of experimental technique………...……….……….…124 Figure 25: Mouse on the treadmill………...……….…125 Figure 26: Synchronous and asynchronous behaviors correlate with different types of peaks…126 Figure 27: Treadmill motor skill learning in the direct and indirect paths ………127 Figure 28: Rotarod D1 (direct path) and A2A (indirect path) calcium peaks per minute……..….…128 Figure 29: Parallel bars calcium peaks per minute A2A mice……….……….…129
vii
viii
Acknowledgements
First, I would like to thank Dr. David Sulzer who has been an amazing mentor. He provided excellent support and always encouraged scientific curiosity. Dave has maintained an open door policy and has always been easy to approach and to discuss scientific projects at any time of the day. I appreciated Dave’s flexibility, interest in my work, and invaluable input into all of the different ideas we discussed. I enjoyed working in Dave’s lab and he has motivated me to develop my scientific creativity.
I would like to thank the members of my thesis committee, Drs. Steven Siegelbaum, Atila Losonczy, and Rui Costa for their extremely valuable advice that helped guide me through these projects. I would also like to thank the external member of the thesis committee, Dr. Mark Wightman for joining the committee and sharing his valuable expertise. I would also like to thank all of the undergraduate students in the Sulzer lab who helped contribute to the work described in this thesis. I would like to thank Dr. Timothy Chen and Dr. Clay Lacefield for providing me with invaluable help in analyzing the data in this thesis. Finally, I would like to thank Ellen Kanter from the Sulzer lab for helping manage the technical logistics and protocols necessary for these experiments.
ix
Dedication
I would like to dedicate my dissertation to my family. The support and encouragement of my parents and three sisters has been invaluable in enabling me to pursue higher education.
1
PART 1: IN VIVO STUDY OF NOREPHINEPHRINE__________________________________________
CHAPTER 1: GENERAL INTRODUCTION TO NOREPINEPHRINE AND FFNS OVERVIEW
In this chapter I provide a brief review of the role of norepinephrine (NE) in the CNS and its dysfunction in disease. I also introduce a new optical method to enable direct observation of release in vivo. The following chapters describe the collaborative studies I and other members of the Sulzer, Sames, and Kandel labs performed on this system. These studies provide the first optical observation of release in vivo and the first optical observation of the effects of amphetamine in vivo.
THE ROLE OF NOREPINEPHRINE
NE plays important roles in both the central nervous system (CNS) and peripheral nervous system (PNS). It is synthesized from dopamine (DA) by DA beta hydroxylase (DBH). In the cortex and hippocampus, NE modulates cognitive functions including working memory, attention, decision making, and sensory
processing (Mehta et al. 2001, Clayton et al. 2004, Sara 2009). The major CNS population of neurons that release NE reside in the locus coeruleus (LC) in the brain stem and project to both cortical and subcortical areas, and can release DA as well as NE (Berridge and Waterhouse 2003, Kempadoo et al. 2016).
NE signals through three major G-protein coupled receptors, known as alpha 1, alpha 2, and beta receptors. Alpha 1 receptors are located post synaptically and increase calcium influx through Gq signaling, while alpha 2 receptors are chiefly located presynaptically and function as auto receptors to reduce NE release (Nguyen et al. 2017). The neurons of the LC exhibit tonic firing that modulate arousal levels and wakefulness. In response to salient stimuli, the LC neurons display phasic bursting (Berridge and Devilbiss 2011). NE released through phasic bursting plays an important role in attention through actions in the prefrontal cortex (PFC). Rodent studies of lesions of the NE projections to the PFC have shown deficits in cognitive processing. In primates, reduced NE release by application of an alpha 2 agonist impairs attention and working memory (Ramos and Arnsten 2007).
2
Both DA and NE play important roles in modulating attention through activity at the PFC (Campo et al. 2011). NE and the NE transporter (NET) work to modulate DA signaling and attention. Interestingly, DA binds to the NET transporter with a higher affinity than to the DA transporter DAT. In the PFC, there are very low levels of DAT and high levels of NET that modulate extracellular DA levels (Moron et al. 2002). In addition, the enzyme catechol-o-methyltransferase (COMT) breaks down DA in the PFC (Scheggia et al. 2017). Thus, DA signaling is regulated by both COMT mediated breakdown as well as by NET mediated reuptake.
NOREPINEPHRINE DYSFUNCTION IN DISEASE
NE dysfunction plays an important role in the cognitive deficits of several disorders. Parkinson’s disease is characterized by the loss of DA neurons in the substantia nigra pars compacta (SNc), resulting in the loss of the nigrostriatal DA path. This results in changes in output of the medium spiny neurons of the dorsal striatum and severe motor deficits (Hoehn and Yahr 1967, Dickson et al. 2009). However, Parkinson’s disease also results in severe cognitive deficits such as impairment in attention, working memory, and cognitive flexibility (Halliday et al. 2008, Leverenz et al. 2009). These cognitive symptoms can precede the motor symptoms by many years (Keri 2010). In addition to the loss of dopaminergic neurons, there is also substantial loss of the NE neurons of the LC (Sulzer and Surmeier 2013). It is thought that the loss of the NE neurons projecting to the frontal cortex plays a significant role in the cognitive symptoms of Parkinson’s disease (Vazey and Aston-Jones, 2012).
Individuals with genetic DBH deficiency from birth possess normal NE receptors, but lack the ability to synthesize NE. This results in problems with the autonomic nervous system and symptoms such as hypotension and dizziness. Interestingly, cognitive tests in DBH deficient individuals have not found any cognitive deficit. This suggests that if NE is absent from birth, other neurotransmitter systems are able to completely compensate in cognitive processing (Jepma et al. 2011).
Attention deficit hyperactivity disorder (ADHD) is the most common childhood mental disorder affecting, 5% of children in the US (Danielson et al. 2017). One of the most commonly prescribed first line
treatments is amphetamine (AMPH) (administered as Dexedrine or Adderall), a stimulant with both therapeutic effect and a high potential for abuse and addiction. While amphetamine’s potential for abuse
3
is dependent on its action on the dopaminergic synapses of the striatum, it also exerts potent actions at noradrenergic synapses of the cortex.
NOREPINEPHRINE AND AMPHETAMINE
It has been hypothesized that AMPH’s ability to increase cortical levels of NE and, indirectly cortical DA, is due to actions at the NE transporter (NET), and that this may underlie much of its therapeutic effect for ADHD (Berridge and Devilbiss 2011, Campo et al. 2011) in a manner independent from its effects on striatal DA levels.
The mechanism by which AMPH increases DA levels has been extensively studied. The major
mechanism by which AMPH raises DA levels is by redistributing vesicular DA to the cytosol, followed by reverse transport of cytosolic DA through DAT, and to more controversially, by causing vesicular fusion, as well as blocking reuptake through DAT and NET (Sulzer 2011). Despite its widespread therapeutic use, the mechanism by which AMPH raises cortical levels of NE is controversial. This controversy led a recent review (Berridge and Devilbiss 2011) to conclude that at clinically relevant concentrations, AMPH only increases NE levels by reuptake blockade, and that only very high concentrations can AMPH cause NE release. In contrast, other studies show that AMPH responses in vivo are consistent with driving NE release. The effects of AMPH occur quickly and increase NE levels far beyond traditional NE uptake blockers (up to 450%) followed by a rapid decrease (Heal et al. 2013).
This controversy spans several decades. In one of the first studies of the mechanism of AMPH on NE, Raiteri (1975) used radiotracers to show that AMPH had little effect on NE release compared to DA. They concluded that reuptake block was amphetamines primary mechanism by which it increases NE, while AMPH acts on DA terminals to both inhibit reuptake as well as to stimulate release.
Kuczenski and Segal (1992), used in vivo microdialysis to show that AMPH causes an increase in NE at dosages of 2.5mg/kg. They conclude that this may be mostly due to reuptake block and possibly release, but only at very high dosages. Florin (1994) used microdialysis in rats to measure NE levels. They administered clonidine, an alpha2 receptor agonist, and AMPH to examine AMPH induced increases in NE. They concluded that at 0.5mg/kg, clonidine reduced NE neuronal firing, and that AMPH-induced
4
increase in NE levels was dependent on AMPH blockade of reuptake. In contrast, higher dosages of 5.0 mg/kg were not sensitive to clonidine, and they concluded that AMPH caused NE release from vesicular storage sites at these concentrations. In contrast, Rothman (2001) used in vitro measurement of radiolabeled NE in synaptosomes prepared from rat caudate tissue. By administering AMPH in the presence and absence of reserpine, they found that AMPH caused NE release. However, these in vitro results were not verified in vivo.
FLUORESCENT FALSE NEUROTRANSMITTERS
Many of the mechanisms governing NE release and the action of AMPH have not been addressed in vivo due to previous limitations of in vivo tools for imaging neurotransmission (NT) (Figure 1). FFNs are fluorescent substrates for the catecholamine/serotonin vesicular transporters (VMATs), and for some FFNs including FFN270, for DAT and NET. FFNs including 270 are thus accumulated into the presynaptic synapse and loaded into synaptic vesicles. When concentrated in the vesicle, they fluoresce brightly, providing a means for visualization of their accumulation into the presynaptic bouton. When vesicle fusion occurs, the FFNs are released into the synaptic cleft and diffuse from the synapse, causing destaining of the bouton. This allows imaging of NT from dopaminergic and noradrenergic synapses in real time (Gubernator et al. 2009). The use of FFNs overcomes several limitations common to other in vivo techniques. For instance, in vivo microdialysis provides a bulk measurement of the overall sum of synaptic release and reuptake in an area over a slow time frame (typically > 20 min per sample). While cell-based neurotransmitter fluorescent engineered reporters (CNiFERs) have rapid response times, they provide a summed measurement of DA or NE in the area of the implanted reporter cell (Muller et al., 2014). Cyclic voltammetry in vivo may measure release of hundreds of synapses and therefore does not allow for single synapse resolution, nor can it distinguish between DA and NE, both of which are present in the mPFC. Finally, calcium indicators (GCaMPs and GECIs) provide a measure of cell firing rate, and an indirect measure of calcium transients in axon terminals, but do not show the kinetics of synaptic vesicle fusion and neurotransmitter release (Chen et al. 2013).
While FFNs have been used in acute brain slice preparations (Rodriguez et al. 2013, Pereira et al. 2016), their use in vivo is a novel application. In this research project, I optimized the use of fluorescent false
5
neurotransmitters (FFNs) in vivo and have characterized AMPH-induced release of DA and NE in wild type (WT) mouse cortex. Here we report the first in vivo optical observation of synaptic vesicle exocytosis in the mammalian brain, as well as a means to determine AMPH’s action at noradrenergic synapses with single synapse resolution.
Figure 1. Limitations of different in vivo imaging techniques. In vivo microdialysis measures a signal from numerous synaptic sites and at best has a temporal resolution of minutes. Multiphoton calcium imaging has single synapse resolution but measures calcium as a proxy for neuronal activity. Similarly, voltage indicators do not measure actual synaptic vesicle fusion. In vivo cyclic voltammetry does not have single synapse resolution. Cnifers signal from multiple synapses and lack real time kinetics. Other
imaging methodologies such as MRI, SPECT, and PET measure activity over large brain regions. Only FFNs can resolve single synapses with real time kinetics. Because they are released when vesicles fuse, they have the potential to measure vesicle fusion.
6
CHAPTER 2: PRELIMINARY AND CONTROL STUDIES WITH FFNS
OVERVIEW
In this chapter, I describe several preliminary experiments that I performed to optimize the technique of using FFNs in vivo. Because FFNs had not previously been used in vivo, there were a number of preparations that were necessary to optimize this novel system.
FFN LOADING
FFN270 can be loaded into the brain through a chronic implanted optical glass window. For this set of experiments, I used the novel FFN, FFN270. This new FFN was designed to have a high specificity as a substrate for the NE transporter (NET). The first step to optimize FFN270 for use in vivo was to develop an optimal method by which they could be introduced into the brain tissue prior to imaging. Multiphoton
Figure 2. Diagramed image of an implanted cranial window with a chronic glass port for nanoinjecting FFN. The FFN injection needle is lowed through the open port in the optical glass window allowing loading of the FFN. The window is affixed to the skull with dental acrylic.
7
imaging through a cranial window often uses a surgically implanted glass coverslip. However, this coverslip would impair the loading of the FFN via nanoinjection into the tissue. This problem was solved by using a diamond tipped drill bit to bore a hole into the cranial window glass coverslip. This allowed the FFN to be loaded through the microwindow into the brain tissue (Figure 2). The hole in the cranial window was then plugged with silicone glue that could be removed allowing reloading of the FFN at different time points and chronic imaging experiments.
Novel fluorescent cocaine analogue ECN127 pretreatment blocks loading of FFN270
The next in vivo experiment was conducted in collaboration with members of the Sames lab. We
performed a control experiment to verify that loading of the FFN could be blocked by pretreatment with a NET inhibitor. We nanoinjected FFN270 twenty minutes after we first pre-injected a fluorescent NET antagonist ECN127 (Figure 3). This control allowed realtime visualization of the specificity of FFN270 for NET, allowing us to visualize if FFN270 would load into the puncta through other mechanisms that were not mediated by NET. ECN127 is a rhodamine fluorophore linked to a tropane analog of cocaine. The resulting compound is a fluorescent DAT/NET inhibitor. We found that pretreatment with ECN127 blocked FFN270 loading (Figure 4). This confirmed specificity of FFN270 loading to NET.
Targeting the LC with a viral vector
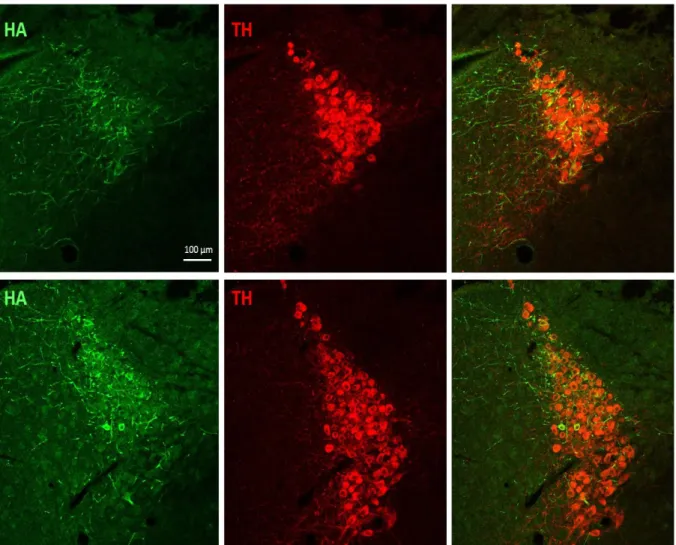
Finally, we performed an experiment to verify that we could target the LC with a viral vector. In a later experiment channelrhodopsin was injected into the LC and we released FFN270 from the cortex with optical stimulation. The details of the channelrhodopsin experiment are described in chapter 3. In this preliminary experiment we injected AAV virus expressing a hemagglutinin (HA) tag. We then performed immunostaining against tyrosine hydroxylase (TH) and hemagglutinin to double label the brain sections and verify expression of the virus in the LC. We found that we were able to successfully target the LC and achieve 40% colocalization with TH (Figure 5).
8
Figure 3. Diagram of ECN127 experiment. The NE projections to the cortex from the LC are shown in green. A cranial window was performed an ECN127 was injected into the cortex prior to FFN270. (modified from the Mouse Brain Atlas, Panxinos and Franklin 2001).
9
Figure 4. Pretreatment with NET inhibitor ECN127 blocks FFN270 loading. Pretreatment with ECN127 results in fewer visualized FFN270 puncta than a control animal injected with only FFN270 (top left). Brain tissue injected with ECN127 (blue 3D projection) shows very few puncta. In contrast, brain tissue injected with only FFN270 shows significant amounts of puncta (green 3D projection). ECN127 is comprised of a rhodamine fluorophore linked to a tropane DATA/NET ligand (bottom left).
10
Figure 5. Immunostaining of viral injection into the LC. A viral vector expressing the epitope HA was injected into the LC. Six weeks post injection, the mice were perfused and the brain was sectioned. Sections were immunostained for HA (left) and TH (middle). The right panels show the overlap between the two signals. We found approximately 40% colocalization between HA and TH (right).
11
METHODS
Mice
Adult 8 week old male wild type C57BL/6J mice were used for the imaging experiments here. . All procedures were conducted in accordance with Institutional Animal Care and Use Committee (IACUC) of the New York State Psychiatric Institute.
Cranial window surgery
Mice were anesthetized with isoflurane (1-4%). The depth of anesthesia was monitored by both the animal’s response to toe-pinch every 5 min and observation of respiratory rate. Once the proper depth of anesthesia was reached, the animal was placed in a small animal stereotactic apparatus on top of a heating pad and Puralube vet ointment was applied to the eyes to prevent vision loss. All surgical procedures were performed in a sterile manner. Marcaine (0.5%) with saline 1:2 (0.25%) (2 mg/kg), was injected subcutaneously along the midline of the scalp as a local anesthetic. Before the incision, the hair over the scalp area was removed with NAIR and sterilized with a gentle scrub with Betadine on a sterile cotton swab, followed by 70% ethanol, repeated 3 times. The scalp was then removed with surgical scissors, membranes over the skull were removed by scraping, and the exposed bone was dried with compressed air. A 3 mm cranial imaging window was then made over the barrel cortex with a high speed dental drill (Midwest Stylus 360). The meninges were inspected to make sure there was no damage. Any bleeding from the bone was stopped with an application of collagen foam (Avitene Ultrafoam, Bard Davol). A cranial window with a microinjection port was then affixed over the window with dental acrylic. A glass pipette attached to a Nanoject II (Drummond Scientific) was filled with a 1 500nnM solution of ENC127 and was then injected through the microinjection port in the cranial window into the brain at coordinates AP: -0.9 mm to -1.0 mm and ML: 3.0 mm, over several depths (DV: 100 µm, 50µm, and 20 µm) with 3 minutes of delay per depth. After 30 minutes, 100 nl of 1mM solution of FFN270 diluted in ACSF was then injected into the same coordinates. The glass pipette was then withdrawn from the brain and the mouse was then injected with ketamine (100 mg/kg) and xylazine (10 mg/kg) i.p. and then weaned off of isoflurane while making sure to maintain depth of anesthesia. The mouse was then
12
headfixed under the multiphoton microscope for imaging. The body temperature of the mouse was maintained for the duration of imaging with a heating pad.
Viral injection surgery
Mice were injected with buprenorphine (0.05- 0.1 mg/kg) prior to anesthesia and anesthetized with isoflurane (1-4%). Marcaine diluted 50% in saline was injected under the scalp to provide local anesthetic. The body temperature of the mouse was maintained for the duration of imaging with a heating pad. The depth of anesthesia was monitored by both the animal’s response to toe-pinch every 5 min and
observation of respiratory rate. Once the proper depth of anesthesia was reached, the animal was placed in a small animal stereotactic apparatus on top of a heating pad and Puralube vet ointment was applied to the eyes to prevent vision loss. All surgical procedures were performed in a sterile manner. Marcaine (0.5%) with saline 1:2 (0.25%) (2 mg/kg), was injected subcutaneously along the midline of the scalp as a local anesthetic. Before the incision, the hair over the scalp area was removed with NAIR and sterilized with a gentle scrub with Betadine on a sterile cotton swab, followed by 70% ethanol, repeated 3 times. The scalp was then removed with surgical scissors, membranes over the skull were removed by scraping, and the exposed bone was dried with compressed air. A 1 mm hole was then made over the dorsal striatum with a high speed dental drill (Midwest Stylus 360). Any bleeding from the bone or dura was stopped with an application of collagen foam (Avitene Ultrafoam, Bard Davol). A glass pipette attached to a Nanoject II (Drummond Scientific) was filled with AAV virus expressing hemagglutinin (300 nl of 1013
viral units/ml), and attached to the stereotax. A volume of 300ul of virus was injected into the LC with 3 minutes of delay per depth. The glass pipette was then withdrawn from the brain and the scalp was sutured closed. The mouse was then transferred to a heated cage to recover.
Immunohistochemistry
Brain tissue preserved with paraformaldehyde was cut into 100um sections on a vibratome. Immunohistochemistry was performed as described in Clark et al. 2017.
Discussion
13
vivo through a cranial window. We also found that FFN270 labeling of puncta could be blocked by
pretreatment with a novel fluorescent DAT/NET antagonist. Finally, we were able to successfully transfect the LC with an AAV viral vector, which is the first step before attempting viral transfection with
channelrhodopsin expressing viruses. The experiments described here formed the basis for the more advanced studies described in the following chapter. Through this preliminary work, we were able to introduce FFN270 into an in vivo system and perfect the technique.
14
Chapter 3: Design of a Norepinephrine Optical Tracer for Imaging Individual
Noradrenergic Synapses and Their Activity in vivo
Matthew Dunn*,
1Adam Henke*,
1Samuel Clark*,
2,3,4Yekaterina Kovalyova,
1Kimberly A.
Kempadoo,
5Richard J. Karpowicz, Jr.,
1Eric R. Kandel,
3,5,6,7David Sulzer
†,
2,3,4Dalibor Sames
†1* These authors contributed equally.
†
Corresponding authors: [email protected] and [email protected]
1Department of Chemistry, Columbia University, New York, NY 10027, USA.
2Department of Neurology, Columbia University, New York, NY 10032, USA.
3Department of Psychiatry, Columbia University, New York, NY 10032, USA.
4Department of Pharmacology, Columbia University, New York, NY 10032, USA.
5 Department of Neuroscience, Columbia University, New York, NY 10032, USA.
6 Kavli Institute for Brain Science, New York, NY 10032, USA.
7 Howard Hughes Medical Institute, New York, NY 10032, USA.
ABSTRACT
NE is a monoamine neurotransmitter with a wide repertoire of physiological roles in the peripheral and central nervous systems. Despite major strides in understanding the noradrenergic system, there are no experimental means to study functional properties of individual noradrenergic synapses in the brain. As learning and behavior adaptation depend on the ability of specific synapses to undergo changes in transmission efficiency, development of new approaches for imaging synaptic neurotransmission is of
15
fundamental importance. Here we introduce fluorescent false neurotransmitter 270 (FFN270), an organic dye-based tracer of NE that integrates key structural features of NE with the coumarin fluorophore. FFN270 is a fluorescent substrate of the NE transporter and vesicular monoamine transporter, and thus labels noradrenergic neurons and their synaptic vesicles. FFN270 enables imaging of synaptic vesicle content release from single release sites in living rodents. Combining FFN270 imaging and optogenetic stimulation, we found heterogeneous release properties of noradrenergic synapses in the somatosensory cortex, identifying populations of low and high releasing synapses. We also observed rapid release of synaptic vesicle content induced by systemic AMPH administration, yielding insight into the drug’s effect on cortical noradrenergic synapses.
INTRODUCTION
NE is the major neurotransmitter of the sympathetic peripheral nervous system and regulates most visceral organs and glands, thermoregulation, and the immune system NE is also a key
neurotransmitter in the central nervous system (CNS) (Wassall 2009). Brain NE neurons primarily originate in the locus coeruleus (LC) and project axons throughout the CNS, including to the cortex, hippocampus, hypothalamus, amygdala, cerebellum, and spinal cord (Fig. 1C) (Foote et al 1983, Schroeter et al. 2000, Berridge and Waterhouse 2003 Accordingly, the NE system plays numerous physiological roles, such as brain-wide regulation of neurovascular coupling and cerebrospinal fluid flux (Bekar 2012), and local effects such as modulation of cortical neuronal circuitry (Sara 2012).
While it is well established that the LC-NE system regulates stress responses, arousal, and sleep-wake cycles, more recent reports also suggest specific functions in cognition (Sara 2007, Sara and Bouret 2012). Shifts in LC neuronal firing between tonic and phasic activity control decision-making processes and facilitate optimization of behavior in a changing environment. In the “adaptive gain and behavior optimization hypothesis,” LC neuronal firing controls the balance between exploitation of the ongoing task versus exploration of new ones (Aston-Jones and Cohen 2005) NE synaptic inputs reset the activity states and firing patterns of ensembles of cortical neurons, presumably by modulating the
16
The NE system has also been implicated in numerous neurodegenerative and psychiatric disorders. For example, in Parkinson’s disease, degeneration of LC-NE neurons often precedes loss of DA neurons in the substantia nigra; (Vazey and Aston-Jones 2012) in Alzheimer’s disease, the most extensive loss of sub-cortical neurons occurs in the LC (Zarow et al. 2003, Braak and Del Tredici 2011, Iba et al. 2015). Modulators of NE neurotransmission represent an important class of widely used therapeutics, including adrenergic receptor agonists/antagonists, and modulators of NE storage, release, and reuptake. For example, the antidepressant mirtazapine is an α2 receptor blocker, and the
antidepressant reboxetine is an inhibitor of the plasma membrane NE transporter, NET (Moret and Briley 2011, Zhou 2004). AMPH, presently administered under the tradename Adderall, is used for treating attention deficit hyperactivity disorder (ADHD) (Zhour 2004), and is prescribed to hundreds of thousands of children in the US, and self-administered by millions worldwide (Degenhardt and Hall 2012). AMPH enhances NE (and DA) transmission (Amara 1998, Rothman and Baumann 2003, Ventura et al. 2003), although, whether the effects are due to NET inhibition or the redistribution of stored NE content (e.g. via reverse transport) at physiological concentrations has long been debated (Rothman et al. 2001, Spencer 2015). However, despite the growing importance of the LC-NE system, there previously have been no experimental tools to study NE release at the level of discrete synapses, and thus the release properties of sparse cortical NE axons and synapses in vivo remained unknown.
The synaptic hypothesis of learning – which posits that ongoing alteration of synaptic
transmission underlies an organism’s ability to learn and change behaviors – is gathering experimental support (Nabavi 2014). Further, even individual synapses formed by the same axon (Bamford et al. 2004), are presumably regulated by ongoing expectation and experience to be more or less likely to participate in subsequent neurotransmission. To determine how behavior and sensory input alter specific synapses, novel tools to measure neurotransmission at individual synapses in vivo must be developed and implemented.
The current approaches for measuring NE lack the spatial and temporal resolution to discern individual synapses in the living brain. While electrochemical detection can distinguish DA from NE in some contexts (Park et al. 2011, Bian et al. 2010, Lu et al. 2004), these approaches have insufficient
17
spatial resolution to detect NE release from individual synapses (Sames et al. 2013), and are not useful in sparsely innervated regions of the CNS like the neocortex (Herr et al. 2012). New fluorogenic cell-based sensors can detect changes in the cortical NE in vivo with high sensitivity; however, these approaches also lack the spatial resolution to distinguish individual synapses (Nguyen et al. 2010, Muller et al. 2014). Fluorogenic receptor-based sensors have been developed to selectively detect glutamate concentration changes in the brain with single synapse resolution (Marvin et al. 2013, Namiki et al. 2007, Okubo et al. 2010, Hires et al. 2008), but similar sensors for monoamine neurotransmitters have not yet been developed. Chemical labels can be used for detection of NE with adequate spatial resolution, such as glyoxalic-acid-induced fluorescence histochemistry in fixed tissues (Carelsson et al. 1962, Lindvall and Bjorklund 1974) and more recently, fluorogenic chemosensors that react with NE in large dense core vesicles of cultured cells( Secor and Glass 2004, Hettie et al. 2013), but these techniques have not been adapted to living tissue.
Here we introduce the use of the fluorescent false neurotransmitter (FFN) concept to provide an optical tracer of NE neurotransmission (Gubernator et al. 2009). Several generations of fluorescent DA mimetics have been developed in our laboratories, which revealed the heterogeneous nature of dopaminergic presynaptic activity in mouse brain tissue (Rodriguez et al. 2013, Pereira et al. 2016). FFN102 is an exemplar dopaminergic FFN (Fig. 6), deriving its labeling selectivity for dopaminergic neurons as a substrate of the plasma membrane DA transporter (DAT) (Rodriguez et al. 2013, Lee et al. 2010). As shown below, however, FFN102 is not a substrate for the NET, and thus a poor optical tracer for NE.
We now expand the scope of the FFN concept by introducing the first NE-FFN, probe FFN270 (Fig. 6). This compound is designed as a fluorescent NET substrate and also a substrate of the neuronal vesicular monoamine transporter (VMAT2), the transporter responsible for packaging neurotransmitter in monoaminergic synaptic vesicles. The probe is taken up along with NE into synaptic vesicles within NE axonal varicosities and enables measurement of synaptic vesicle content release by destaining during exocytosis. FFN270 enables both an examination of noradrenergic microanatomy and an observation of synaptic activity in the cortex of intact neuronal circuits in vivo. The use of FFN270 also demonstrated
18
that exposure to pharmacologically relevant concentrations of AMPH has a dramatic effect on cortical NE axons, providing new insights to the drug’s mechanism of action.
METHODS
Synthesis and Preparation of NE-FFN Leads
Detailed synthetic routes and confirmation of compound identities is included in Supplementary Information.
Photophysical Characterization and Measurement of log D values
General – Photon absorption and emission spectra were measured using a BioTek H1MF plate reader on bottom read mode.
Absorption - UV absorption spectra were taken by adding probe (4 μL of 10 mM stock solution in DMSO) to 996 μL of PBS buffer at different pH values (final probe conc. = 40 μM) in a clear-bottom white 96-well plate.
Emission/Excitation - Excitation/emission spectra were taken by adding probe (5 μL of 40 μM solution in PBS) to 995 μL of PBS buffer of different pH values (final probe conc. = 0.2 μM) in a clear-bottom white 96-well plate.
pKa - The pKa values of probes were determined from the absorption spectra. The absorbance λabs, max of
the red-shifted peak was plotted versus pH of the PBS solution; the data were fit to a sigmoid curve using GraphPad Prism 5 software to determine the pKa value.
log D - The log D values were determined by a traditional shake flask method. Each measurement was performed in duplicate as follows. First, 20 μM probe solution in 1 mL PBS (pH 7.4) was prepared to which 1 mL of n-octanol was added and mixed thoroughly. The mixture was kept in dark for 3 days for complete equilibrium, and the concentrations of probe in each layer were determined based on the UV absorbance. Log D values were determined based on the following equation; log D = log[probe]oct –
log[probe]PBS, where [probe]oct and [probe]PBS are the concentrations of the probe in n-octanol and PBS,
19
Characterization and Measurement of probe uptake in transfected cell culture Fluorometric assay for evaluation of hNET substrate activity
Stably hNET-transfected HEK cells were seeded at a density of 0.08-0.09 x 10⁶ cells/well in white
solid-bottom 96-well plates and allowed to proliferate in growth medium for ~2 days at 37 ºC to reach confluence. On the day of the experiment, the complete growth medium was aspirated, wells were washed with 200 μL PBS, and treated with 100 μL experimental medium with DMSO (vehicle, 0.02% v/v) or nomifensine (2μM). The cells were incubated for 60 min at 37 °C, and experimental compounds (100 μL /well of 10 μM solution in experimental medium with DMSO (vehicle) or nomifensine 2μM) was added for a final concentration of 5μM compound in wells. Cells were then incubated for 30 min at 37 ºC. The experiment was terminated by two rapid PBS washes (200 μL/well) followed by addition of fresh PBS buffer (120 μL/well). The fluorescence uptake in cells was immediately recorded using a BioTek H1MF plate reader (3x3 area scan, bottom read mode) with excitation and emission wavelengths set at 370 nm and 460 nm respectively.
Quantification of hNET substrate activity
Substrate activity was determined using signal to basal ratio (S/B): mean fluorescence uptake (with DMSO vehicle) divided by that in the presence of nomifensine. Data presented as normalized uptake ± SEM from three independent experiments (eight separate measurements per condition per experiment).
Fluorescence microscopy imaging of probes in hNET-HEK cells
hNET-HEK cells or their respective controls, HEK293, were plated onto poly-D-lysine (Sigma Aldrich, conc. = 0.1 mg/mL) coated clear bottom six-well plates at a density of 0.15-0.20 x 10⁶cells per well and
grown at 37° C in 5% CO2. Following ~4 days of growth, the cells had reached 80-90% confluence. The culture medium was removed by aspiration, and the cells were washed with PBS (Invitrogen, 1.0 mL/well). To investigate the inhibitory effects of nomifensine maleate salt (Sigma-Aldrich) and cocaine hydrochloride salt (Sigma-Aldrich) on probe uptake, cells were incubated in 0.9 mL of experimental media containing the inhibitor (2 μM prepared from 10 mM stock solution in DMSO) or DMSO vehicle as a control at 37° C in 5% CO2 for 1 h. The compound uptake was initiated by adding 0.1 mL of experimental media containing probe (200 μM, prepared from a 10 mM stock solution in DMSO, with a final probe
20
concentration of 20 μM in the uptake assay) with and without nomifensine (2 μM) or cocaine (1 μM). Following incubation at 37° C in 5% CO2 for 30 min, the media was removed by aspiration and the cells were washed with PBS (1 mL/well) and maintained in fresh experimental media (1 mL/well). Fluorescence images (at least 3 images/well in duplicate wells) were acquired with a Leica FW 4000 imaging system (Leica Microsystems) equipped with a Chroma custom filter cube (ex = 350 ± 25 nm, em = 460 ± 25 nm; Chroma Technology Corporation) and a Leica DFC-360FX camera. Fluorescence and bright field images were acquired with exposure time set at 600 ms and 37 ms respectively. All images were adjusted using the same contrast and brightness level using ImageJ software (National Institutes of Health).
Fluorescence microscopy imaging of probes in VMAT-HEK cells
Epifluorescence microscopy of the small library of experimental coumarins reported here was conducted as previously reported using VMAT-HEK and control tetR-HEK cells. Briefly, VMAT-HEK and TetR-HEK cells were plated at a density of 0.15-0.20 x 10⁶cells per well on poly-D-lysine coated 6-well optical plates
(Falcon) and grown at 37° C in 5% CO2. Following ~4 days of growth, the cells had reached 80-90% confluence. The culture medium was removed by aspiration, the cells were washed with PBS (Invitrogen, 1.0 mL/well), and the wells were pretreated with experimental medium with or without the VMAT2
inhibitors reserpine (1 µM, Sigma-Aldrich) or dihydrotetrabenazine (DTBZ, 2 µM; Sigma-Aldrich) for approximately 60 minutes. To initiate uptake, solutions of experimental probe with or without inhibitor were added to the appropriate wells for a final concentration of 20µM probe with or without reserpine (1 µM) or DTBZ (2 µM). Cells were incubated at 37˚C for 2 h, at which point the probe solutions were removed by aspiration and wells were gently washed with PBS (2 mL). Wells were maintained in fresh experimental medium and were imaged as described above.
Quantification of VMAT2 substrate activity
The Multiple Thresholds ImageJ plug-in (created by Damon Poburko, Simon Fraser University, Burnaby, BC, Canada) was used for quantification of fluorescent puncta in images of VMAT2-HEK cells obtained from fluorescence microscopy. Puncta were identified as objects conforming to defined parameters: brightness (> 0.6 SDs above background), appropriate size (0.5 – 4 µm2), rounded shape (min circularity:
21
image, normalized to uptake by tetR-HEK cells as background ± SEM from four independent experiments (six images per condition per experiment).
Determination of FFN Loading and Release in Acute Murine Brain Slices Preparation of acute murine brain slices
All animals used for slice preparation were C57BL/6 mice obtained from the Jackson Laboratory (Bar Harbor, ME). For slices containing the locus coeruleus, animals were sacrificed at 20 days due to peak NET expression at an early age (Sanders et al. 2005). For all other experiments mice were used at 7-9 weeks. All animal protocols were approved by the IACUC of Columbia University. Mice were decapitated and acute 300 µm thick coronal slices were cut on a Leica VT1200 vibratome (Leica Microsystems) at 4oC and allowed to recover for 1 h in oxygenated (95% O2, 5% CO2) artificial cerebrospinal fluid (ACSF)
containing (in mM): 125 NaCl, 2.5 KCl, 26 NaHCO3, 0.3 KH2PO4, 2.4 CaCl2, 1.3 MgSO4, 0.8 NaH2PO4, 10
Glucose (pH 7.2-7.4, 292-296 mOsm/l). Slices were then used at room temperature for all imaging experiments.
Application and 2-photon imaging of FFNs
Slices were incubated with the FFN (10 µM) for a 30 min bath incubation and then transferred to an imaging chamber (QE-1, Warner Instruments, Hamden, CT) and held in place by platinum wire and nylon string custom made holder and superfused (1 ml/min) with oxygenated ACSF (Wong et al. 2011). Slices were allowed to wash in the perfusion chamber for at least 10 min before imaging. For any inhibition experiments, slices were first pre-incubated with the inhibitor (1 µM nomifensine or 500 nM reboxetine) for 15 min, and then co-incubated with the FFN for the 30 min loading period. Inhibitor was also added to the perfusing ACSF solution. Fluorescent structures were visualized at depths of at least 25 µm from the slice surface using a Prairie Ultima Multiphoton Microscopy System (Prairie Technologies, Middleton, WI) with a titanium-sapphire Chameleon Ultra II laser (Coherent) equipped with a 60 X 0.9 NA water immersion objective. FFN270 was excited at 760 nm and 440-500 nm light was collected. Images were captured in 16-bit 112 x 112 µm2 field of view at 512 x 512 pixel2 resolution and a dwell time of 10 µs/pixel using
Prairie View software. For imaging the sparse noradrenergic cortical projections 20 µm thick z-stacks (1 µm/image) were collected and then compressed using a maximum z-projection.
22
Colocalization of FFN270 and TH-GFP
Colocalization of FFN270 and noradrenergic structures was performed in animals that express GFP under the tyrosine hydroxylase promoter (TH-GFP) (Sawamoto et al. 2001). Acute slices from the LC or barrel cortex were incubated with FFN270 as described above and imaged using interlaced scanning with two separate lasers. FFN was imaged using 740 nm excitation and an emission range of 435-485 nm, and GFP was imaged using 920 nm excitation and an emission range of 500-550 nm. To quantify the number of GFP-positive cells in the LC that colocalize with FFN, cells were manually selected if they contained fluorescence in either channel that was greater than 2 standard deviations above background, and reported as the percentage of GFP-positive cells that also contain FFN270 signal. Quantification of the colocalization of noradrenergic projections in the barrel cortex was determined by identifying FFN270 puncta using the Multiple Thresholds plug-in for the ImageJ software. Any ROIs that corresponded to fluorescence in blood vessels were manually discarded. The identified ROIs were then considered to positively colocalize if greater than 50% of the pixels overlapped with GFP signal that was greater than 2 standard deviations above background, and reported as the number of visibly discernable GFP axons with FFN270-postive puncta.
Electrical stimulation of FFN270 loaded cortical projections
For better temporal resolution (15 s/frame), imaging during electrical stimulation experiments used a smaller 54 x 54 µm2 area and 5 µm thick z-stack. At the start of electrical stimulation, a 10 Hz stimulation
train (6 min total, each pulse 200 ms x 180-200 mA) was applied locally to the barrel cortex by a bipolar stainless steel electrode using an ISO-Flex stimulus isolator triggered by a Master-8 pulse generator (AMPI, Jerusalem, Israel). Quantification of fluorescent changes in destaining puncta was performed as described in a previous publication from our laboratory using a custom made Matlab script available from our laboratory’s website at http://sulzerlab.org/.41 The kinetics of release were then determined from the
fluorescent traces using GraphPad Prism 5 by fitting with a single exponential decay function.
Channelrhodopsin-2 expression, colocalization, and release
Channelrhodopsin-2 (ChR2) was selectively expressed in noradrenergic neurons using TH-IRES-Cre (Jackson Laboratory) animals and a Cre-Lox adenoassociated virus (AAV/2/5.EF1a.DIO.hChR2(H134R)-EYFP.WPRE.hGH, obtained from Penn Vector) injected into the locus coeruleus (AP: -5.45, ML: +1.30,
23
DV: -3.80) unilaterally as described by our laboratories previously.54 Animals were then allowed to
recover for 4 wk prior to use in FFN experiments. To measure colocalization in the barrel cortex, FFN270 was imaged using 760 nm excitation and an emission range of 435-485 nm, and EYFP was imaged using 950 nm excitation and an emission range of 500-550 nm. Quantification of colocalization between EYFP-positive axons and FFN270 puncta was conducted as described above and reported as percentage of FFN axons that also contain EYFP signal greater than 2 standard deviations above background. Stimulation of ChR2 was achieved using a 470 nm LED source (LED4D067 and DC4100 driver,
Thorlabs) to provide blue light pulses (10 Hz, 5 ms duration, 2,400 pulses total) locally to the brain slice. Due to the overlap between FFN270 emission and the ChR2 excitation source, changes in fluorescence were measured only before and after stimulation. The before and after image stacks were registered using the Correct 3D Drift plug-in (Parslow et al. 2014). For quantification, puncta from the pre-stimulation stack were selected using the Multiple Threshold plug-in. The mean fluorescence from puncta of a visually continuous axon were then compared to the mean fluorescence post-stimulation. Each FFN270-positive axon was then grouped based on whether there was colocalization with EYFP signal as
determined by signal greater than 2 standard deviations above background. Slices from both the injected and non-injected brain hemispheres were used for analysis.
AMPH release in acute brain slice
To measure changes in FFN270 following AMPH treatment, acute brain slices containing the barrel cortex were prepared and loaded with FFN270 as described above. 20 µm thick z-stacks were imaged every 60 s for 15 min total. AMPH (10 µM) was added to the ACSF and then perfused over the slice starting at 5 min. These z-stacks were then registered using the Correct 3D Drift plugin and the AMPH-dependent fluorescent changes were quantified by both the number of puncta selected by the Multiple Threshold plug-in and the average fluorescent intensity of those puncta over time.
FFN270 Loading and Release in vivo FFN270 loading in vivo
Mice were anesthetized with isoflurane (1-4%). The depth of anesthesia was monitored by both the animal’s response to toe-pinch every 5 min and observation of respiratory rate. Once the proper depth of
24
anesthesia was reached, the animal was placed in a small animal stereotactic apparatus on top of a heating pad and Puralube vet ointment was applied to the eyes to prevent vision loss. All surgical procedures were performed in a sterile manner. Marcaine (0.5%) with saline 1:2 (0.25%) (2 mg/kg), was injected subcutaneously along the midline of the scalp as a local anesthetic. Before the incision, the hair over the scalp area was removed with NAIR and sterilized with a gentle scrub with Betadine on a sterile cotton swab, followed by 70% ethanol, repeated 3 times. The scalp was then removed with surgical scissors, membranes over the skull were removed by scraping, and the exposed bone was dried with compressed air. A 3 mm cranial imaging window was then made over the barrel cortex with a high speed dental drill (Midwest Stylus 360). The meninges were inspected to make sure there was no damage. Any bleeding from the bone was stopped with an application of collagen foam (Avitene Ultrafoam, Bard Davol). A glass pipette attached to a Nanoject II (Drummond Scientific) was filled with a 1 mM solution of FFN270 diluted in ACSF and attached to the stereotax. 100 nL of FFN270 was injected into the brain at coordinates AP: -0.9 mm to -1.0 mm and ML: 3.0 mm, over several depths (DV: 100 µm, 50µm, and 20 µm) with 3 minutes of delay per depth. The glass pipette was then withdrawn from the brain and a plastic ring was glued around the window with Loctite 454 to hold ACSF for imaging. A metal headmount was then glued to the nearby exposed bone with Loctite 454. The mouse was then injected with ketamine (100 mg/kg) and xylazine (10 mg/kg) i.p. and then weaned off of isoflurane while making sure to maintain depth of anesthesia. The mouse was then headfixed under the multiphoton microscope for imaging. The body temperature of the mouse was maintained for the duration of imaging with a heating pad.
Channelrhodopsin-2 stimulated release in vivo
ChR2 animal preparation, blue light stimulation parameters, and analysis were conducted as described above for acute brain slice experiments. The ChR2-positive animals that were used for ChR2
colocalization and FFN270 release in brain slice were also used for the in vivo experiments. Due to a larger degree of z-shift that was present in vivo, the imaging parameters for this experiment were modified slightly to collect from a larger z-stack (30 µm, 1 µm/image), while all other imaging parameters remained the same. The noradrenergic projections of the barrel cortex were then locally stimulated 35 min post FFN270 injection (waited 30 min after initial injection to allow NET-dependent accumulation and natural clearance of unloaded FFN270 probe from background tissue, followed by 2 pre-stimulation image
25
stacks). For these experiments, cranial windows were only created on the same hemisphere as the viral injection, and the data from both the ChR2-positive and -negative populations came from the same hemisphere.
AMPH induced FFN270 release in vivo
For AMPH experiments, after FFN270 was loaded, 30 µm z-stacks were collected every 5 min starting from 30 min post-FFN270 injection. After 2 image stacks, AMPH (0, 1, or 10 mg/kg) in Dulbecco's phosphate-buffered saline was injected into the intraperitoneal cavity. Images stacks were collected for 30 min post-injection. These stacks were registered using the Correct 3D Drift plug-in, and then puncta were selected using the Multiple Threshold plug-in using ImageJ. For the z-planes that remained consistent across the entire time course, the number of identified puncta were compared for each time point and normalized to the z-stack collected just before AMPH injection.
Statistics
Data is presented as mean ± SEM and standard parametric tests were used for statistical analysis. For the comparison of two different conditions a two-tailed t-test was used, while a one-way ANOVA was used for comparing conditions of three or more. A two-way ANOVA was used to compare changes between two different traces over time. The sample size was chosen based on similar studies in the field and based on our previous studies, the exact sample size for each result is incorporated in the text. To determine the normality of a particular distribution we used the D-Agostino & Pearson test. Data collection and analysis were not randomized or performed blind to the conditions of the experiments.
RESULTS
Design, lead identification, synthesis, and photophysical properties of NE-FFNs.
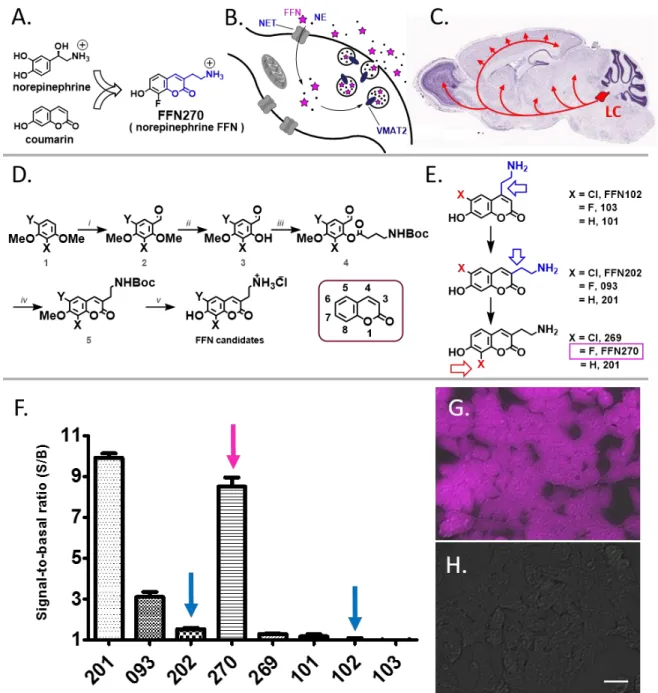
We approached the global design of NE-FFN probes by incorporating the key structural feature of NE, the arylethylamine fragment, into the coumarin fluorophore (Fig. 1A). We chose this design as the FFN probe must act as a substrate of both NET on the plasma membrane of NE neurons and VMAT2 on
26
the NE synaptic vesicles. Selective binding of these compounds to their protein targets is not sufficient; they need to be actively transported like the native neurotransmitter across the plasma and vesicular membrane via ion gradient-coupled processes. Thus, a major portion of the structural space of molecular fluorophores was not applicable owing to their large size. The relatively small coumarins, however, proved excellent fluorophores for this purpose due to their high brightness-to-size ratio, photostability, and biocompatibility. Aided by the relative substrate permissiveness of NET (Rothman 2003, Bonisch et al. 1999, Rorres et al. 2003), we pursued the discovery of coumarin-based NET substrates.
Lead identification was initiated by examining the DA-FFNs, FFN102 and FFN202, which have been successfully used to study dopaminergic projections in the striatum of acute murine brain slices (Rodriguez et al. 2013). To test the applicability of FFNs in vivo, the compounds were applied (50 µM, 30 min) to the frontal cortex of mice through exposed cranial windows. Whereas FFN102 showed no
appreciable uptake above background, we observed numerous punctate axonal strands with FFN202 (Supplementary Fig. S2). Since FFN102 did not label these same axons, we hypothesized that they did not express DAT, but instead the closely related NET, and thus represented NE axons. Indeed, NET activity of FFN202 was confirmed using human embryonic kidney cells stably transfected with human NET (hNET-HEK). Further, the simpler analog 201, sharing the 3-aminoethyl core of FFN202, was identified as an excellent substrate for NET (Fig. 6E). Despite its favorable transporter properties at NET, 201 is not a well-suited fluorescent probe for brain tissue, due to its insufficient brightness and due to the pKa of the phenolic group (pKa = 8.0) being outside of the desired physiological pH range to allow
distinction between localization in the vesicles (pH 5.5) and the extracellular space (pH 7.4). Both limitations can be addressed by introducing an electron-withdrawing group in the adjacent position to the coumarin phenol, thus providing the rationale for the development of a series of related,
halogen-substituted coumarins.
Synthesis of this library of fluorophores with desirable photophysical properties and phenol pKa
values was accomplished with a 5-step synthetic sequence using 2- and 4-haloresorcinols as
commercially available starting materials (Fig. 6D). The presence of an electron-withdrawing chlorine or fluorine atom in the 6- and 8- position (Fig. 6E) increased acidity of the phenolic group (pKa = 5.9 – 6.3)
27
and shifted the pKa to the desired physiologically relevant pH range (5.5-7.4, Supplementary Table S1).
At the cytosolic pH of ~ 7.4, the haloanalogs are mostly in a phenolate form, which is considerably brighter than the protonated phenol form. As a result of this acidification, all newly prepared FFN candidates bearing a halogen atom displayed greater brightness than FFN201 (pKa = 8.0). These
compounds, including FFN270, exhibit two resolved absorption/excitation maxima depending on solvent pH (FFN270 ex: 320 nm or 365 nm, em: 475 nm, Supplementary Fig. S1) and thus can function as ratiometric fluorescent pH-sensors.
Development of fluorescent coumarin substrates of NE transporter
The collection of 7-hydroxycoumarin compounds (Fig. 6E) was examined for possible NET substrates using a multi-well fluorometric assay to measure NET-dependent uptake in hNET-HEK cells. The cells were grown in 96-well plates and incubated with the experimental compounds (5 µM, 30 min) in the absence and presence of the NET inhibitor, nomifensine (2 µM). The activity of the compounds at NET was determined by comparing the fluorescence intensity between the uninhibited wells (signal S; dependent and independent/nonspecific uptake) and the inhibited wells (basal signal B; only NET-independent/non-specific uptake) and expressed as a signal-to-basal ratio (S/B) (Fig. 6F).
The 4-series hydroxycoumarin fluorophores (bearing the aminoethyl group in the 4-position of coumarin), including the dopaminergic tracer FFN102 (Rodriguez et al. 2013, Pereira et al. 2016, Lee et al. 2010), showed insignificant activity at NET; whereas 201, the parent compound of 3-series
regioisomers, showed robust transporter-dependent fluorescence accumulation (~ 10-fold S/B, Fig. 6). Introducing the fluorine atom in position 6 of the 3-series coumarin ring, affording compound 093, improved the photophysical properties, but negatively affected the ability of the fluorophore to act as a substrate for NET. Increasing size of the halogen atom in this position caused a further decrease in NET activity (H (201) > F (093) > Cl (FFN202)), with FFN202 showing only weak NET uptake (< 2-fold S/B). In contrast, placing the fluorine atom in position 8, generating FFN270, led to a small reduction in specific uptake (8.5 ± 0.4) compared with the lead compound 201 (9.9 ± 0.4, n = 3, p = 0.04, Fig. 6F), while still improving photophysical properties (pKa = 6.25). However, additional increase in size of the halogen atom
28
To confirm the hNET substrate activity of FFN270 demonstrated in the fluorometric study, we used epifluorescence microscopy to visually compare cellular uptake and labeling morphology of
uninhibited and inhibited hNET-HEK cells using nomifensine (2 µM) or cocaine (1 µM), as well as control HEK293 cells. In hNET-transfected cells, FFN270 exhibited a homogeneous staining pattern indicative of cytosolic distribution (Fig. 6G), while only negligible uptake was found in nomifensine treated (Fig. 6H), cocaine treated (Supplementary Fig. S3), and null-transfected cells (Supplementary Fig. S3), confirming the NET-dependent uptake identified from the initial screen. We also examined hDAT and hSERT-transfected HEK cells, and found that FFN270 is selective for hNET (Supplementary Fig. S4)
.FFN270 is also a substrate of the Vesicular Monoamine Transporter-2
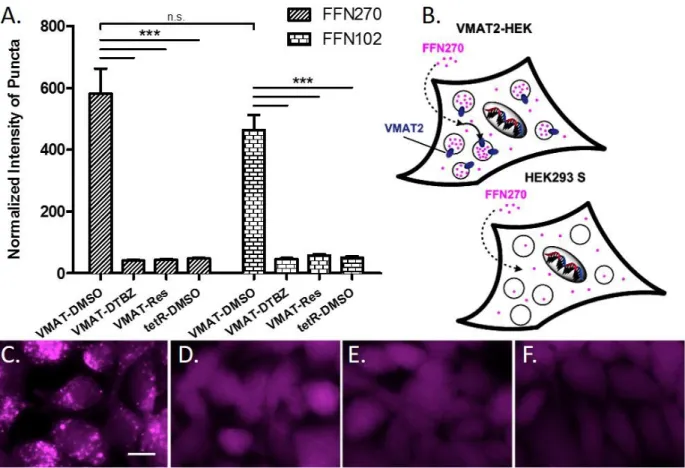
To determine the potential of FFN270 to load NE synaptic vesicles and therefore trace NE neurotransmission, we examined VMAT2-dependent transport using a protocol employing HEK cells stably transfected with rat VMAT2 (VMAT2-HEK). This system, where VMAT2 is expressed and active on acidic intracellular organelles of HEK cells, has been employed extensively by our laboratories. (Adam, Edwards, & Schuldiner, 2008; Hu et al., 2013; Lee, Gubernator, Sulzer, & Sames, 2010) VMAT2 activity was evaluated using wide-field epifluorescence microscopy, which enables visualization of individual cells and the intracellular distribution of the fluorescent compounds (Fig. 7C-F). In comparison to NET-HEK cells, these cells do not over-express NET on the plasma membrane, and as a result, higher
concentrations of the probe (20 µM) and longer incubation times (2 h) are used in this experiment to facilitate passive diffusion.
VMAT2-HEK cells that were treated with FFN270 displayed a bright punctate fluorescent pattern consistent with accumulation of the compound in acidic organelles expressing VMAT2 (Fig. 7C). This VMAT2-dependent accumulation was expressed as normalized total puncta fluorescence (number of puncta multiplied by average puncta fluorescence intensity, Fig. 7A). In contrast, only general cytosolic fluorescence was observed in the null-transfected HEK cell line (not expressing VMAT2, Fig. 7F) or in VMAT2-HEK cells pretreated with a VMAT inhibitor, either dTBZ (2 M, Fig. 2D) or reserpine (2 M, Fig. 7E). Comparing the VMAT2-uptake of FFN270 with FFN102, a previously confirmed VMAT2 substrate
29
used to measure DA vesicular exocytosis ex vivo (Lee et al. 2010), confirmed that FFN270 accumulated in acidic organelles in a VMAT2-dependent manner with similarly normalized intensity (n = 4, p = 0.26, Fig. 7A), indicating that this probe is a dual NET-VMAT2 substrate.
FFN270 labels NE neuronal soma and axons in murine brain tissue ex vivo
After reaching the in vitro criteria of an NE-FFN – including dual transporter substrate activity (NET and VMAT2), favorable photophysical properties (sufficient brightness and phenol pKa within vesicle
physiological pH range), and low basal cellular labeling – we examined whether FFN270 is suitable for labeling neurons by applying the probe to the LC region of acute mouse brain slices (Fig. 8), the primary region for noradrenergic cell bodies in the brain. Using a mouse line expressing green fluorescent protein (GFP) under the tyrosine hydroxylase promoter (TH-GFP) (Matsushita et al. 2002), GFP is expressed in catecholamine neurons, and can be used as a reference marker for noradrenergic neurons in the LC, since this region does not contain dopaminergic cell bodies (Ungerstedt 1971). We observed that 72% of noradrenergic cells expressing GFP were also labeled with FFN270 (greater than 2x SD of the
background, 62/86 cells, 6 animals, Fig. 8B-D), while previous generation DA-FFN probes, such as FFN102, showed no measurable uptake by any GFP-labeled cells in this region (Fig. 8E-G).
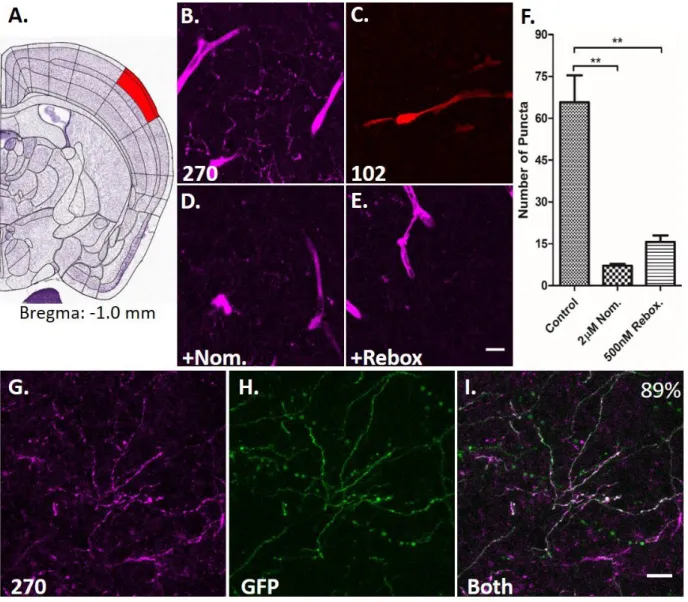
We next determined the degree to which FFN270 labels the projections of these noradrenergic cell bodies by measuring uptake in the outer layers (Layer 1-3) of the barrel cortex (Fig. 9A). This brain region receives extensive noradrenergic innervation (Robertson et al. 2013), and NE-dependent
neuromodulation has been shown to affect the strength and temporal patterns of sensory input-activated barrel cortical networks (Devilbiss and Waterhouse 2004, Constantinople and Bruno 2011, Motaghi et al. 2006). After FFN270 incubation in acute brain slice, we observed significant staining of noradrenergic axons, as well as some blood vessels (Fig. 9B). Due to the relatively sparse density of labeled projections, the representative 2D images shown are maximum Z-projections of 20 μm thick volumes. Consistent with observations in the LC, FFN102 did not label these cortical noradrenergic projections (Fig. 9C), and as predicted by preliminary in vivo results, FFN202 showed minor uptake (Supplementary Fig. S5). FFN270 loading of these structures was inhibited with nomifensine (2 μM), or the selective NET