Cleveland State University
EngagedScholarship@CSU
ETD Archive2019
The Effect of the I-ready Reading Program on
Student Scores on the Northwest Evaluation
Association (NWEA®) Measures of Academic
Progress (MAP) Reading Assessment
Ricardo A. Torres
Follow this and additional works at:https://engagedscholarship.csuohio.edu/etdarchive Part of theLanguage and Literacy Education Commons
How does access to this work benefit you? Let us know!
This Dissertation is brought to you for free and open access by EngagedScholarship@CSU. It has been accepted for inclusion in ETD Archive by an authorized administrator of EngagedScholarship@CSU. For more information, please [email protected].
Recommended Citation
Torres, Ricardo A., "The Effect of the I-ready Reading Program on Student Scores on the Northwest Evaluation Association (NWEA®) Measures of Academic Progress (MAP) Reading Assessment" (2019).ETD Archive. 1167.
THE EFFECT OF THE I-READY READING PROGRAM ON STUDENT SCORES ON THE NORTHWEST EVALUATION ASSOCIATION (NWEA®) MEASURES
OF ACADEMIC PROGRESS (MAP) READING ASSESSMENT
RICARDO ALBERTO TORRES
Bachelor of Science in Business Administration Ohio Northern University
May 2003
Master of Business Administration Baldwin-Wallace University
August 2007
Master of Science
The City University of The City College of New York June 2011
Master of Education Bank Street College of Education
May 2014
submitted in partial fulfillment of the requirements for the degree DOCTOR OF PHILOSOPHY IN URBAN EDUCATION
at the
CLEVELAND STATE UNIVERSITY May 2019
We hereby approve the dissertation of
RICARDO ALBERTO TORRES
Candidate for the Doctor of Philosophy in Urban Education Degree This Dissertation has been approved for the
Office of Doctoral Studies,
College of Education and Human Services and
CLEVELAND STATE UNIVERSITY,
College of Graduate Studies by
______________________________________________________ Dissertation Chairperson: Frederick Hampton
Counseling, Administration, Supervision, and Adult Learning
______________________________________________ Methodologist: Karla Hamlen-Mansour
Curriculum and Foundations
_______________________________________________ Member: Mark Freeman
Counseling, Administration, Supervision, and Adult Learning
________________________________________________ Member: Elizabeth Domholdt
School of Health Sciences
________________________________________________ Member: Wendy Green
Counseling, Administration, Supervision, and Adult Learning
April 22, 2019 Candidate’s Date of Defense
DEDICATION
For my immediate family…Mom (Liz), Dad (Al), and Sister (Brenda)…The fact that this accomplishment is taking place is a testament to our work as a whole to go from the bottom to the top.
ACKNOWLEDGEMENTS
Without the support and dedication of many colleagues, teachers, staff, and friends this dissertation would not have become a reality. First, I would like to recognize my committee chairperson, Dr. Frederick Hampton. He not only pushed to provide consistent guidance, and feedback, he moved to keep me motivated and driven throughout this process. Second, I would like to thank Dr. Karla-Hamlen Mansour. She was nothing short of a hero when it came to reviewing and discussing methods. Her responsiveness, patience, and genuine feedback helped push me throughout this study. Next, I want to thank the members of my dissertation committee; Dr. Mark Freeman, Dr. Wendy Green, and Dr. Elizabeth Domholdt. The authentic feedback the committee was able to provide pushed my thinking in many different directions, and ultimately led to the creation of a stronger more polished study. I would also like to give a special note of gratitude to Ms. Rita Grabowski. Her consistent support and patience with any questions that came up along the way was very much noted and appreciated. Finally, I would like to thank Jose Morales for providing the moral support needed for me to complete this process. His ability to handle things allowed me the freedom to write and research. It was very much noticed and appreciated, and I am not certain I would have been to complete this study without his support.
v
THE EFFECT OF THE I-READY READING PROGRAM ON STUDENT SCORES ON THE NORTHWEST EVALUATION ASSOCIATION (NWEA®) MEASURES
OF ACADEMIC PROGRESS (MAP) READING ASSESSMENT RICARDO ALBERTO TORRES
ABSTRACT
The purpose of this study was to examine the effect on student scores on the Northwest
Evaluation Association (NWEA®) Measures of Academic Progress (MAP) Reading Assessment when students are engaged with on-line adaptive diagnostics and instruction via the Curriculum Associates (CA) i-Ready Reading on-line platform. Outcomes were explored based on usage of the i-Ready program, ethnicity (Hispanic, or Non-Hispanic), and sex (male, or female) of the participant. Participants were students in a K-8 environment in an urban setting in the Mid-West United States. There were two groups of students: one group who used the i-Ready Reading program by CA, and the other who did not. The students who used the program did so based on the discretion of the school principal. Students who were chosen were exposed to the same core curriculum and quality of teacher was controlled for using 2015-2016 summative teacher ratings. Data collection included baseline spring 2016 NWEA® MAP Reading scores, and summative spring 2017 NWEA® MAP Reading scores. The data used were from the 2016-2017 school year. Fixed Effect (FE) Linear Regression was used for the analysis. In general, students who used the i-Ready Reading Program by CA demonstrated lower spring 2017 NWEA MAP Reading Assessment scores than students who did not use the program.
vi TABLE OF CONTENTS ABSTRACT ...v LIST OF TABLES ... ix LIST OF FIGURES ...x CHAPTER I. INTRODUCTION ... 1
Statement of the Problem ... 3
Purpose of the Study ... 4
Significance of the Study ... 4
Background on the i-Ready Program ... 5
Background on NWEA® MAP Reading Assessment ... 5
Overview of Methodology ...6
Research Questions ...7
Limitation and Delimtations of the Study ...8
Definition of Key Tearm ...9
Summary ...9
II. LITERATURE REVIEW ...11
Introduction ... 11
The Cleveland Plan and School Turn-Around ... 12
i-Ready Adaptive Technology, On-line Instruction, and Diagnostic Assessment.14 Real World Scenarios ... 16
Explicit Instruction and Feedback ... 16
vii
Foundational Reading Skills ...18
Use of Technology with Students in Urban Settings ...19
Summary ...21
III. METHODOLOGY ...23
Rationale for Quantitative Methods ... 24
Ex Post Facto Design for Quantitative Research ... 24
Setting and Participants for Quantitative Design ... 25
Data Analysis Procedure for the Quantitative Study ... 27
Limitations and Delimitations for the Quantitative Study ... 28
Summary ...29
IV. RESULTS ...31
Quantitative Data Analysis ... 31
Assumptions of Regression... 32
District and Study Sample Demographics ... 34
Mean Score Changes... 37
Fixed Effect Linear Regression Model ... 38
Question One: Change in NWEA® MAP Reading Assessment Scores ... …..39
Question Two: Difference in NWEA® MAP Reading Assessment Scores Based on Ethnicity (Hispanic or Non-Hispanic) ... 41
Question Three: Difference in NWEA® MAP Reading Assessment Scores Based on Sex ... 41
Summary ...42
viii
Introduction ... 44
Summary of the Study ... 44
Discussion of the Findings ... 46
Implications for Practice ... 48
Recommendation for Further Research ... 49
Conclusion ...50
ix
LIST OF TABLES
Table Page
I. Frequency and percentages of sample data by sex, ethnicity, and school (n =530)…...37
II. Group statistics for mean change score by school and year (n =530)...………38
III. Descriptive Statistics for Change in NWEA® MAP Reading Assessment scores……....40
x
LIST OF FIGURES
Figure Page
1. Histogram depicting distribution of spring 2017 NWEA® MAP Reading assessment scores………...33
2. Scatterplot depicting standardized residual of spring 2017 NWEA® MAP Reading assessment scores……….……….34
1
CHAPTER I
INTRODUCTION
At the start of the 2016-2017 school year, the Luis Munoz Marin Dual Language
Academy (LMM), a school in the Cleveland Metropolitan School District (CMSD) in Cleveland, Ohio, began to use the i-Ready program from Curriculum Associates (CA). According to their website, the i-Ready program is grounded in the use of an adaptive diagnostic using the Rash Model of Item Response Theory (IRT), in addition to on-line instruction. Essentially, students take an adaptive diagnostic, and then spend time engaging in on-line lessons aligned to their needs as determined through the adaptive diagnostic. CA provides guidance as to the minimum amount of time a student should spend engaging in content via the on-line platform, and also provides guidance and information about passage rates with regard to embedded assessments. If a student is not passing lessons within the program, it is suggested that a teacher intervene with the student. Many schools around the country use the program as a form of intervention.
Intervention refers to providing supplemental instruction to students to close skill and knowledge gaps that may exist.
During the 2016-2017 school year, principals within the CMSD were allowed to
2
intervention and enrichment programs. This was seen as a continuation of the Cleveland Plan (CP), which was originally set to end at the end of the 2016 academic year. Starting in 2012, the CP was law adopted by the State of Ohio as a means to turnaround schools in the CMSD,
without undergoing state takeover. As is the case, principals could review programs and options and make decisions regarding what they wanted to use for intervention and / or enrichment. At LMM, during the 2016-2017 academic year, the administrative team decided to use the i-Ready program as a means of intervention and enrichment for students. The administrative team was composed of the school principal, other school based administrators, and teacher leaders. The administrative team made the decision based on the need for individualized intervention and / or enrichment for students, and a search into programs able to provide these needed supports. It was determined that all students who take state standardized assessments would use the program as determined by CA. Since the program uses an adaptive diagnostic, it determines placement of students based on current performance. Thereafter, the on-line lessons should provide
enrichment for students who may be performing above grade level, and intervention for students who may be performing below grade level.
While CA provides schools and their administrative teams with reports and data indicating the effectiveness of the program, they use data points from their own internal data measures to make this justification. As noted in CA’s impact study released in 2017, increases in i-Ready diagnostic scores, based on use of the program as directed, were used to explain an increase in student achievement. While CA states the i-Ready diagnostic scores are valid and reliable based on their sample size and IRT statistical analysis, considering the cost associated with the program, it is beneficial to consider student growth and achievement via another
3
NWEA® MAP Reading Assessment, the data gleaned from the NWEA® MAP Reading
Assessment, may be used to further refute or confirm positive effects from the use of the i-Ready
program.
Statement of the Problem
CMSD has been one of the lowest performing school districts in the state of Ohio since state report cards were introduced for public schools based on 2003-2004 academic year results. In 2012, as means to combat looming state takeover and continued poor performance, in
conjunction with the state of Ohio, CMSD had legislation passed with the state titled the Cleveland Plan (CP). The overall goal of the CP was to remove low performing schools and create new schools in the hopes that this would create a district of high performing schools (The Cleveland Plan, 2012). The CP was set to run until 2016, at which point the plan was to be fully realized and the district deemed no longer to be failing. In 2016, the plan was extended by the state of Ohio and further time was granted to CMSD, as it was said that progress was being made, but that the district was still not quite where it needed to be.
The CP held that school autonomy was of utmost importance in the race towards school reform. Within these school autonomies, school leadership teams are charged with developing the instructional models that best fit their schools and the particular needs of their students. As such, in general, core curricular decisions are made by the district, but programs for enrichment and / or intervention could be chosen at the building level. The problem exists where within this autonomy, there does not exist a repertoire of research at the district level to provide guidance and / or limitations with regard to program selections for school leaders and their leadership teams. The question this poses is whether certain programs are effective at closing gaps with CMSD students? Of particular interest to this study is the i-Ready Reading program.
4
While the i-Ready program has reports and an established research base, much of that data used to justify the effectiveness of the program is based solely in their own diagnostic, assessment, and data tools (Curriculum Associates, 2017). While CA states that their diagnostic scores are valid and reliable based on sample size and statistical methods used, this begged the question as to the program’s effectiveness should another assessment measure be used as the means of determining achievement. Ultimately, there is great cost and responsibility associated with intervention, decision making, and implementation of programs in CMSD, and the need to know if the program was truly viable for the CMSD students required further research.
Purpose of the Study
Along with flexibility in curricular choices, comes accountability. In considering the implications of the CP, much confidence is placed on school leaders and their teams to make decisions that will increase student achievement. In the absence of an increase in student achievement, a gap exists in the implementation of the CP, and should be addressed.
Furthermore, given cost considerations for intervention and enrichment programs, the ability to have research that confirms a program’s effectiveness is important for schools.
Significance of the Study
Given the intent of the CP to create high performing schools district-wide, and the autonomies provided to school leaders, research on instructional programs was necessary. Of particular interest was the i-Ready Reading program from CA, as it is widely used across the district. This study compared a school using the program vs. a school not using the program within CMSD, to determine the effectiveness of the program. The results of this study were important as there exists great financial, and professional responsibility on schools and their leadership teams, and the results can be used to help make decisions around instructional
5
programs in their efforts to fulfill the intent of the CP.
Background on the i-Ready Program
The i-Ready program was developed by CA as a means of on-line assessment and instruction. The program uses an adaptive diagnostic to find exactly where a student is performing academically, and then creates a learning path for the student. This learning path includes on-line instruction that provides lessons and embedded assessments for students As students complete lessons, and pass embedded assessments, they then move forward on to the next set of skills they should master to be considered proficient. The program is used as a blended learning model by many school districts, and is seen as means to provide individualized intervention, and / or enrichment to students. Blended learning refers to the use of face-to-face teacher instruction, and on-line instruction. When implemented with fidelity, students take a baseline diagnostic in the fall, a growth check assessment approximately eight weeks later, a second diagnostic in the winter, followed by another growth check, and a final diagnostic in the spring. Additionally, CA suggests that students spend a minimum of 45 minutes a week using the program, and teachers are charged with checking students’ passage rates in the lessons and embedded assessments with which they engage. Ultimately, usage of the program with fidelity is said to close student skill gaps and be an individualized instruction tool leading to higher student achievement.
Background on the NWEA® MAP Reading Assessment
According to their website, the NWEA® is a research-based, not-for-profit organization. They work to develop Pre-K–12 assessments to measure student growth and proficiency. The results gleaned from these assessments can, in turn, be used to predict student proficiency on state assessments, and student growth. For this study the NWEA® MAP Reading Assessment
6
was used as a measure of student achievement. NWEA® (2016) describes MAP as interim assessments that are administered in the form of a computerized adaptive test (CAT). The assessments can be used from grades K-12 in the areas of Math, Reading, Language Usage, and Science. For the purpose of this study the reading assessment was utilized. Additionally, it is important to note that MAP are vertically scaled across grades, which allows for academic achievement growth to be measured. The MAP assessment scores are reported using a Rasch Unit (RIT) scale with a range from 100 to 350. Each subject area assessment has its own RIT score scale, and studies are periodically conducted to ensure RIT scores align to grade level equivalents for the purpose of measuring growth (NWEA®, 2016). For example, in 2015 a RIT Scale norming study was conducted using multi-level growth models on approximately 500,000 longitudinal test scores from over 100,000 students in order to establish nationally representative norms (Thum, & Hauser, 2015). Based on the established set of national norms and vertical alignment of the NWEA® MAP Reading Assessment, the score results can be used from pre to post-tests to gauge student academic growth in reading.
Overview of Methodology
This study used quantitative methods. An ex post facto research design was used with a causal-comparative approach. The study examined the effect of the i-Ready Reading program on student scores on the NWEA® MAP Reading Assessment. A comparison was conducted
between students who were exposed to, and used, the i-Ready Reading program, and students who did not. Baseline data were taken from the spring 2016 NWEA® MAP Reading
Assessment, and growth measured using spring 2017 NWEA® MAP Reading Assessment. In order to control for teacher effectiveness, the 2015 – 2016 teacher’s final summative overall effectiveness ratings were used. This measure included both a combination of quantitative
7
student growth measures (SGMs), and the results of qualitative teacher observations. Teachers can receive a final summative rating of accomplished, skilled, developing, or ineffective. With regard to core English Language Arts (ELA) curriculum and instruction, both schools sampled used the same core curriculum, and followed the district’s literacy block. The district’s literacy block included elements of modeled instruction, shared practice, and independent work, which includes digital literacy. Scranton school was selected as a peer model based on similarities to LMM in terms of percent of Special Education, percent of English Language Learners, number of students per class, location on the West Side of Cleveland, and Socio-Economic Status (SES). To ensure appropriate sample size, effect size software was used. This was done as an a priori power analyses (Cohen, 1988), whereby sample size n =91was computed as a function of the required power level of .80 and an alpha of .05 (Faul, Erdfelder, Lang, & Buchner, 2007).
Statistical analysis via Fixed Effects (FE) Linear Regression was conducted. The FE model was utilized as it permits the individual to be used as their own control to see the effect in score changes on the NWEA® MAP Reading Assessment between the two groups of students on two occasions. Additionally, sex (male, or female) and ethnicity (Hispanic, or non-Hispanic) were considered in the statistical analysis. Particular attention was given to Hispanic student results as they formed a large part of the sample, and data are limited when considering ethnicity and achievement, and specifically examining the Hispanic demographic. In order for the
difference in NWEA® MAP Reading Assessment scores to be considered statistically significant, a value of p <.05 was used.
Research Questions
The three quantitative research questions were as follows:
8
the Curriculum Associates i-Ready Reading program, compared to students who did not use the program?
2. Is there a difference in the amount of change in NWEA® MAP Reading Assessment scores based on ethnicity (Hispanic vs. non-Hispanic) when using the Curriculum Associates i-Ready Reading program, as compared to students who did not use the program?
3. Is there a difference in the amount of change in NWEA® MAP Reading Assessment scores based on sex when using the Curriculum Associates i-Ready Reading program, compared to students who did not use the program?
Limitations and Delimitations of the Study
The most relevant limitation of this study was the testing conditions for the
administration of the NWEA® MAP Reading Assessment. While CMSD has established rules and policies for administering the NWEA® MAP Reading Assessment, a centralized proctoring team does not exist to ensure implementation occurs in exactly the same way across and within schools. Another limitation of this study was the subjective nature of teacher performance via the TDES process, or the qualitative observation portion of the summative rating. While training and calibration exercises were conducted to standardize the process, there is an air of subjectivity that exists within the process, and ultimately the observation results rely on an evaluator’s
opinion against a rubric standard. While this is true, the study also included a quantitative component via a teacher’s Student Growth Measures (SGMs) to help combat this construct. The researcher chose to impose some delimitations on the study itself. Since the study is specifically looking at groups of students within the CMSD on the West Side of Cleveland, there existed a narrowed and targeted population of students. As such, to a certain extent, the final analysis and
9
results of this study may not be generalizable beyond the schools studied.
Definition of Key Terms
On-line Adaptive Technology: Adaptive technology is used a means to adjust questions and / or instructional paths for each individual students based on how they answer or perform on
assessments and lessons.
NWEA®: “Northwest Evaluation Association”. A research-based, not-for-profit organization that creates assessment solutions to measure student growth and proficiency. (NWEA, 2016).
i-Ready Program: Program developed from CA that combines the results of an adaptive diagnostic, and on-line individualized K-8 instruction to move students towards mastery of content.
Fixed Effect Linear Regression: “FE Linear Regression.” Linear model in which the individual is used as their own control.
CMSD: “Cleveland Metropolitan School District.” School district serving the City of Cleveland located in Northeast Ohio.
Summary
The purpose of this study was to examine the effect on student scores on the NWEA® MAP Reading Assessment when students were engaged with on-line adaptive diagnostics and instruction via the CA i-Ready program. Student groups from LMM and Scranton school were used as the sample. The student groups consisted of two groups of students: one was exposed to the i-Ready program by CA, and the other was not. Students who were chosen were exposed to the same core curriculum, and literacy block, with the only exception being use of the i-Ready program. Teacher quality was controlled for via the use of 2015 – 2016 final summative teacher ratings. Data collection included baseline spring 2016 NWEA® MAP Reading Assessment
10
scores, and summative spring 2017 NWEA® MAP Reading Assessment scores. The data used were from the 2016-2017 school year. In order to conduct the statistical analysis, FE Linear Regression was used.
11
CHAPTER II LITERATURE REVIEW
Introduction
School performance and student achievement remain important topics of discussion throughout the United States. Theories abound as to how to turn around underperforming schools. Places such as the Cleveland Metropolitan School District (CMSD) have undertaken legislation such as the Cleveland Plan (CP) to provide an answer to these questions. Within the CP is the autonomy for school level leaders to determine how to best serve the needs of their specific population of students. One such way certain leaders are looking to turn around low performing schools within the CMSD is through the use of the i-Ready Reading program from CA. The program provides on-line intervention and/or enrichment to students, in addition to assessment. Curriculum Associates (CA) asserts that the program is based on the use of adaptive technology, and that it incorporates the best practices of: real world scenarios, explicit instruction and feedback, and interactivity and a gradual release of responsibility. Furthermore, in
specifically looking at their on-line reading program, CA puts a focus on foundational skills such as phonological awareness, phonics, and high frequency words, in addition to vocabulary
12
In conducting a review of literature, a deeper look into the CP was necessary. Additionally, a clearer understanding around CA’s i-Ready Reading program, including indicated best practices and skills taught, and an examination of the use of technology with students in urban settings was necessary. Furthermore, a search for relevant studies specifically addressing the i-Ready program served as evidence to the lack of current research and evaluation of the program. In searching Cleveland State University’s library and academic databases, such as Education Resources Information Center (ERIC), only one article appeared that dealt with the i-Ready program, and that article revolved around action research, and specifically looked at math programming. Understanding the key elements of school turn-around, and the lack of research into the i-Ready Reading program, a review of literature was conducted to expand and detail these concepts.
The Cleveland Plan and School Turn-Around
The CP was legislation enacted in 2012 as means to combat what was seen as consistent failure in the CMSD, and also prevent state mandated takeover. Essentially, the goal was to engage in school-turnaround, or in the larger conversation, eliminate low performing schools. In general, school-turnaround is an umbrella term used to describe the ability to take schools that historically perform poorly on standardized test-based performance, and increase their results. (Dee, 2012). The actual piece of legislation is known as House Bill (HB) 525 from the 129th Ohio General Assembly. HB 525’s intended purpose was to amend certain sections of the Ohio Revised Code (ORC). Specifically, HB 525 (2012) was enacted to:
Revise the management of municipal school districts and community schools located within municipal school districts; to permit the establishment of a Municipal School District Transformation Alliance; to expand the offense of bribery to cover directors, officers, and employees of the Alliance; and to authorize municipal school districts to
13
levy property taxes the revenue from which may be shared with partnering community schools (p. 1).
While this statement does not seem as if it is referring to district or school turn-around,
embedded within the legislation were certain provisions and revision to the ORC, which allowed flexibility for change. In delving deeper into the specific sections of HB 525, it becomes
apparent that the intent was actually school-turn around. Some of the specific areas addressed within HB 525 include:
access to community school enrollment data
parental involvement and a requirement that parents of students in the district attend one annual parent teacher conference or similar event
the Chief Executive Officer’s (CEO) authority on low performing schools, and the ability to take corrective action on the district’s lowest performing schools
measures of accountability which requires the district to create performance measures of student achievement, progress, and college and career readiness
the creation of Student Advisory Committees for schools with grades 9 - 12.
the use of proceeds from the sale of district facilities being used for the district’s general funds
the ability to exercise waiver authority to request to have certain rules or statutes waived by the state superintendent
contract flexibility with regard to contracts offered to teachers to include changes to timelines for renewing and continuing contract decisions for teachers, reduction in force, and termination language
the establishment of a differentiated salary schedule based on performance
14
a change to the teacher and principal evaluation system focused on academic performance
the creation of a Transformation Alliance
the sharing of local property ax
As is evidenced via this extensive list, many provisions were embedded in HB 525 to try to provide further autonomy at the local level to the CMSD (The Cleveland Plan, 2012). One of the hallmarks granted the CEO was the decision making ability to grant further autonomy at the school level. The intent and thought was that through stronger autonomy at the building level, principals and their leadership teams would be able to better address the needs of students and experience the intended turn-around.
Embedded within these autonomies at the school level, was a control over budgets, and intervention and enrichment programming. Many principals in the CMSD began to use the i-Ready program from CA to fulfill this need. The i-i-Ready program is an on-line assessment and instruction tool that includes individualized learning pathways and an adaptive diagnostic. The end goal of building level administrators was to increase student achievement, and in effect realize school turn-around. Specifically, the i-Ready Reading program purports the use of evidence-based practices, adaptive technology, and foundational skill acquisition. Herein, further research on these elements of the program will be examined.
i-Ready Adaptive Technology, On-line Instruction, and Diagnostic Assessment
The i-Ready program states that it uses adaptive technology during its assessment process. When students begin to use the i-Ready program, they are initially administered a diagnostic assessment that levels the student. This leveling is aligned to a vertical progression of standards from Kindergarten through 12th grade. The results of the adaptive diagnostic
15
assessment create an individualized learning pathway for students aligned to the standard progression. Furthermore, the results of the diagnostic allow for baseline measurement to track student growth against standards, and can be used to assist teachers in designing classroom instruction (Curriculum Associates, 2015). The ability to provide classroom instruction at a student’s current level is seen as central to increasing student achievement. Additionally, the i-Ready Reading program is an on-line platform that uses the diagnostic data to create
individualized on-line learning pathways and lessons for students in reading. For example, a student’s current performance level may contain gaps in certain academic skills, and knowledge of this can provide a springboard towards closing these gaps (Jiménez & Gersten, 1999).
In specifically looking at the reading diagnostic, CA looks to gauge student levels in the areas of phonological awareness, phonics, high frequency words, vocabulary, and
comprehension. CA explains that the on-line system uses an adaptive structure that makes adjustments as students answer questions in order to increase or decrease the challenge level of the questions presented, thereby providing an accurate measure of a student’s current academic level. Additionally, diagnostic results provide both scale and norm scores for students. Scale scores look at scores as a continuum to allow educators to compare students across grade bands. Norm scores provide educators with a relative measure of how students are performing
compared to peers nationwide. In order to derive these scores, CA uses the adaptive technology model describe above, in conjunction with a Rasch Item Response Theory Model (RIRTM). The use of this model allows for the prediction of student success on certain questions based on level of difficulty. Furthermore, CA details that they have conducted field-testing with over 2,000,000 students, which in conjunction with the RITRM, and adaptive technology allow for greater
16
reliability and validity regarding the norm and scaled score results of the diagnostic (Curriculum Associates, 2014).
Real World Scenarios
In addition to the use of adaptive technology and diagnostic assessments, CA employs the use of real world scenarios. They note that presenting content in this manner allows for:
students to connect new learning with prior knowledge
lessons linked to student interests so as to provide a real world connection
increased engagement due to the use of real-world themes and interactive settings. (Curriculum Associates, 2015).
The use of real world scenarios is supported as a best-practice in engaging students, and therefore increasing student achievement in the long-term. The use of a student’s prior
knowledge allows for new learning to stick and ground itself in things a student already knows and is able to do. Prior knowledge is not always necessarily previous academic content, but can also include previous real-world experiences, or interests (Pollock, Black, & Ford, 2012).
Explicit Instruction and Feedback
Research into reading instruction supports the idea of explicit instruction and feedback. Explicit instruction and feedback refers to direct and specific instruction for students that includes models and explanations, followed by time for students to practice the new concept. Research supports and discusses the use of direct explicit instruction in both vocabulary acquisition and reading comprehension (Swanson, Vaughn, & Wexler, 2017). Furthermore, research supports explicit instruction in phonological awareness, phonics, and high-frequency words, which are all components of foundational literacy, and early reading (Foorman & Moats,
17
2004). Feedback in this sense refers to ‘in the moment’ corrective instructions. Studies show that while feedback has little effect on long-term retention when students provide correct answers, feedback following an incorrect response greatly increases student’s long-term retention of skills and concepts (Pashler, Cepeda, &Wixted, 2005). CA states the the i-Ready program delivers direct explicit on-line instruction with feedback through the lesson pathways provided. The assertion is that the experience a student has combines the elements of models and explanations, and then allows student time to practice the new skill introduced.
Furthermore, based on student responses feedback is provided to correct misconceptions and reteach, and then permit additional practice. Should a student continue to fail to demonstrate mastery, an indication will be provided to the teacher that the student may require more intense face-to-face one-on-one direct instruction (Curriculum Associates, 2015).
Interactivity and Gradual Release of Responsibility
The i-Ready Reading program’s on-line lessons are created to continually keep students engaged. The program embeds tools which require students to make a decision at least every thirty seconds, for example a click. CA believes that similar to real life, they must keep students consistently engaged. While the developers may have their own notions as to what students deem engaging, it should be noted that research does support the idea of student engagement and gaming. Game developers often use strategies when creating games to ensure engagement, and these strategies and ideas can essentially be used for educational games to encourage
engagement (Dickey, 2005). In addition to embedded engagement strategies, the i-Ready Reading program also attempts to employ the strategy of a gradual release of responsibility. Gradual release of responsibility is the idea of relinquishing control over to students for them to work with and practices new concepts in a measured and forward moving manner. It is similar
18
to providing students with a little bit more responsibility as they demonstrate they have acquired new skills and knowledge (Pearson, & Gallagher, 1983). CA feels they embed this idea by having students first see a model of a concept, followed by guided instruction, the practice of new skills, and then an assessment to check skill mastery (Curriculum Associates, 2015).
Foundational Reading Skills
The i-Ready Reading program contends that both diagnostic testing and instruction are developed in such a way to address not only foundational literacy skills, but also to assess and teach vocabulary and comprehension (Curriculum Associates, 2015). Nationwide, most states have adopted some version of the Common Core State Standards (CCSS). The CCSS
specifically point to foundational reading skills being taught in grades Kindergarten through 5th
grade. Furthermore, the CCSS Initiative (2018) lists and defines the overarching foundational skills as:
print concepts – know and understand the basic ideas of print
phonological awareness – understanding of syllables, words, and sounds
phonics & word recognition – ability to decode words, and recognize commonly used words
fluency – ability to read with accuracy and appropriate pace to be understood As students move from foundational reading skills grades, the standards shift and look for students to interact with higher-level informational and literary texts. The primary goal of the literacy standards once students are in grades six through twelve is for students to read to learn. As such, much of the standards focus around the ideas of comprehension and vocabulary
acquisition. For example, in contrast to foundational literacy skills, the overarching ideas in grades six through eight include:
19
key ideas and details – main points within a text
craft and structure – know and understand meaning of words and features and how text is presented
integration of knowledge and ideas - understand charts, figures, facts, and opinions
range of reading and level of text complexity – reading social studies and science texts on grade-level (Common Core State Standards Initiative, 2018).
Use of Technology with Students in Urban Settings
As part of school turn-around, many support the use of technology as a means by which to increase student achievement. The i-Ready Reading program is a form of on-line instructional technology, and as such the big ideas surrounding the use of technology with students in urban settings will be explored. The idea of technology takes on many forms in schools today. For example, some schools consider the use of desktop computers a form of technology integration, while others argue that the use of an on-line instructional platform constitutes a use of
technology. While this contention exists, it should be noted that both examples provide models of how some schools choose to use technology. In considering the research relevant to a study of the CA’s i-Ready program in the CMSD, it is important to consider and examine school
technology use, particularly for students in urban settings. Herein some of the challenges and benefits of the use of technology in urban settings will be discussed.
In urban settings, technology use can have a contentious existence. For example, some settings lack the resources altogether, while in other settings technology is inappropriately used as a reward for behavior rather than a tool for education. Additionally, some find that
20
slideshow presentations vs. lectures). While these statements are true, in order for technology to actually be effective, it must be used as a meaningful tool to engage students and assist them in learning (O’Hara, 2014). This is important when one considers that evidence exists of student appreciation of technology in schools when it is used for self-directed creative purposes as opposed to teacher directed activities. Furthermore, the use of technology can be seen as a means to create active engagement (Shady, 2014). Understanding these ideas, it is important for school leaders in urban settings to examine how technology is used when available. Failing to examine the use of technology can lead to gaps in use and intended purpose.
In furthering the discussion on the challenges of technology use in urban settings, one cannot proceed without acknowledging the notion of the homework gap. As more schools continue to move towards technology integration, its use now extends beyond the traditional school day into the realm of homework. It should be noted that teachers can assign lessons in the i-Ready program outside of the traditional school day as homework. As such, one of the plagues of technology integration in urban settings is the notion of homework gaps Meyers (2016) writes, “Disparity in home Internet service has lead to the "homework gap," where economically
disadvantaged students "go from a digital oasis to a digital desert when they go from school to home," as Chike Aguh, CEO of EveryoneOn described it” (para. 3). So, while technology is being used a means to increase student achievement and engage students, in some realms it is actually proving to be counter-productive. As is the case in some urban settings, the lack of appropriate technology outside of school can actually lead to a widening of knowledge and skills gaps where technology is required to complete assignments.
While challenges and gaps exist in the use of technology in urban settings, research in general finds that it can have a positive effect. There exists contention among researchers as to
21
the necessary conditions and relational connection of positive effects, but nonetheless positive evidence exists (Ahn, Beck, Rice, & Foster, 2016). Understanding this is important for school leaders looking for ways in which to potentially increase student achievement. With regard to technology integration in urban settings, the overarching theme is not so much centered around technology, but moreover the way in which it is employed. Current literature demonstrates that when technology is used to engage students in creation and self-determined activities, its use is more effective than when it is used as a means to modify traditional teaching methods. For example, students appreciate the autonomy to research and create using technology, vs. merely attend to a slideshow presentation. Understanding this research provides a basis as to the use of technology in urban settings.
Summary
In 2012 HB 525 was passed by the 129th Ohio General Assembly. This legislation is
more commonly referred to as the CP. The main goal of the CP was to increase student
achievement in the CMSD. One of the main tenets of the plan was the notion of more autonomy at both the district and school level. In granting autonomy at the school level, building leaders and their instructional teams were granted more control over budgets and decisions around instructional materials for intervention and enrichment. One tool that many school principals began to use was the i-Ready Reading program from CA. The program is an on-line platform used for both assessment and instruction. The program uses adaptive technology and RIRTM to place students at their current performance levels, and allow educators to receive norm and scaled scores for students. CA believes that this data allows for students to then receive an individualized pathway for their learning. Furthermore, CA explains that they build their platform on research-based practices that include: real world scenarios, explicit instruction and
22
feedback, and interactivity and a gradual release of responsibility. Additionally, CA details how they address reading skills aligned to the CCSS. This review of literature presents why some school-based leaders in the CMSD chose to use the i-Ready Reading program. Furthermore, it confirmed, via research, some of the assertions made by CA as to the value of the embedded instructional practices of the program. Finally, it discussed the use of technology by students in urban settings. Essentially a gap existed in the research as to whether the program had an effect on reading achievement given these factors, and this study addressed this gap.
23
CHAPTER III
METHODOLOGY
This chapter presents the method of research for the study. The researcher used a quantitative methodology. Included within this discussion is the rationale for quantitative methods, an explanation of the ex post facto design for quantitative research, and the description and justification of the setting and participants for the design. Furthermore, a presentation of the procedures are presented along with the limitations and delimitations of the study.
The three quantitative research questions were as follows:
1. Is there a difference in NWEA® MAP Reading Assessment scores for students who used the Curriculum Associates i-Ready Reading program, compared to students who did not use the program?
2. Is there a difference in the amount of change in NWEA® MAP Reading Assessment scores based on ethnicity (Hispanic vs. non-Hispanic) when using the Curriculum Associates i-Ready Reading program, as compared to students who did not use the program?
24
scores based on sex when using the Curriculum Associates i-Ready Reading program, compared to students who did not use the program?
Rationale for Quantitative Methods
In looking to study the assertions made by CA regarding the effectiveness of the i-Ready program, it was determined that the best means by which to conduct this analysis was via
quantitative methods. Since the original analysis conducted by CA was done using quantitative statistics, it is only logical that this study used quantitative methods to analyze the effect of the i-Ready program. It should be noted that quantitative research stems from positivist philosophical roots, is experimental, empirical, numerical and statistical in nature, and allows for confirmation and hypothesis testing (Merriam, 2009). Given the characteristics of quantitative research, and the understanding that the original CA study regarding the effectiveness of the i-Ready program, it becomes evident that an evaluation of the i-Ready program would be conducted using
quantitative methods.
Ex Post Facto Design for Quantitative Research
An ex post facto line of inquiry refers to research conducted after-the-fact. As such, it can be determined that interference from the researcher did not occur (Salkind, 2010). Given this, it can be said that an ex post facto design is a form of causal-comparative research. Causal-comparative research refers to a study conducted with two or more groups and one independent variable (Gay, & Airasian, 2003). Furthermore, it allows for a hypothesized cause-effect
relationship to be explored, but does not intend to make cause-effect conclusions. Understanding this construct, and that the groupings of students whose data were used for this study existed prior to the application of the intervention, and that they were not randomly assigned to control groups, it can be determined that the study was a quasi-experimental design (Warner, 2013).
25
While it is rare for a study to be ex post facto and causal-comparative, and also be quasi-experimental, in this case there was a matched comparison (control) group, there was
implementation of a treatment, and there was an attempt to account for other variables. While this type of research design is seen as valid it is not without limitations. When one considers an ex post facto design, it should be noted that research points to three main potential gaps. In no particular order, areas of concern with ex post facto designs include:
a lack of randomization
one may run the risk of over-interpreting results, and hence come to faulty conclusions
the researchers inability to fully manipulate the independent variable
Although these limitations exist, educational research often lends itself to a more ex post facto approach as compared to an experimental design (Kerlinger, 1986). Furthermore, while the researcher understands the underpinnings of the potential limitations, there was an expectation that confidence be placed in the quasi-experimental design.
Setting and Participants for Quantitative Design
The data for this quantitative study were collected from the CMSD. The CMSD is located in the Mid-Western United States and is the public school district that serves the city of Cleveland. According to the most recent statistics presented via the Ohio Department of Education website, the district had an enrollment of 38,949 students during the 2016 - 2017 school year. One hundred percent of students enrolled for that school year received free or reduced lunch. Additionally, 9.2% of students were coded as English Language Learners, while 21.8% of students were coded as students with special needs. The per pupil expenditure for that academic year was $11,054.
26
In order to conduct the study, students were sampled from Luis Munoz Marin Dual Language Academy (LMM) in the CMSD, and Scranton school. Given the parameters below, and to ensure appropriate sample size, all students whose data were available were included. A comparison was conducted between students who were exposed to, and used, the i-Ready program, and students who did not. To find a sample of students who were not exposed to the i-Ready program, another school within the CMSD that used the same English Language Arts (ELA) core curriculum, and balanced literacy block was identified. Additionally, to control for teacher effectiveness, results of the Teacher Evaluation and Development (TDES) system were used in addition to a teacher’s overall effectiveness rating per State of Ohio guidelines, which also includes Student Growth Measures (SGM). To determine this information, overall
effectiveness results were pulled from the 2015-2016 school year. Results from this year were used as this is the year prior to the 2016-2017 school year from which the i-Ready program was measured via NWEA® MAP Reading Assessment results, because one of the assessments used for SGM is the NWEA® MAP Reading Assessment. Since this assessment can be used to help create the model of teacher effectiveness, the researcher could not use data from the same years (2016 – 2017 school year) to analyze the effect. To control for school effects, the results of a model comparison were used. In the CMSD there is a statistical process by which schools are clustered according to demographic, enrollment, and location information. This information provides a score that then allows for schools to be clustered into comparison schools based on the relative proximity of the scores when plotted, and is referred to as the peer schools model (N. D’Amico, personal communication, 2018). An a priori power analyses was done (Cohen, 1988), whereby sample size n = 91 was computed as a function of the required power level. (Faul, Erdfelder, Lang, & Buchner, 2007).
27 Data Analysis Procedure for the Quantitative Study
A Fixed Effects (FE) Linear Regression model was used as the means of statistical analysis. The Fixed Effects model used the individual as their own control. While there were some assumptions regarding changes during the period with which the data were collected, much of those assumptions in this study were controlled for via the selected sample based on teacher effectiveness and school chosen. The study fulfilled the requirements of the FE Linear
Regression model since the study was an ex post facto design and complied with the two general requirements:
the dependent variables (DV), in this case NWEA® MAP Reading Assessment scores, were measured on two occasions
the predictor variable changed across the two occasions for a significant portion of the sample
Additionally, sex and ethnicity were considered in the statistical analysis. It should be noted that they were considered as a category by which to pull a sample, and not as a variable effect that may change over time (Allison, 2009). Furthermore, they were part of the analysis as a way to compare success by subgrouping. With regard to the variable ethnicity, a student is considered Hispanic if the parent of the student identifies the student as Hispanic on the CMSD student enrollment form. (J. Cedeño, personal communication, 2019). Hence, non-Hispanic is used for students of various races who are not identified as Hispanic via the student enrollment form. Also, the variables sex and ethnicity were included in the original analysis but were
nonsignificant and created some multicollinearity because of the presence of the variables and the interactions, so the variables were removed since they weren't specifically answering one of the research questions. In order for the difference in NWEA® MAP Reading Assessment scores
28
to be considered statistically significant, a value of p <.05 was used. The variables were measured as follows:
NWEA® MAP Reading Assessment scores – a Rasch Unit (RIT) scale with a range from 100 to 350
ethnicity – nominal – non-Hispanic – which included white, black, Asian or pacific islander, American Indian or Alaskan native, or multiracial – or Hispanic
sex – nominal – dichotomous – biological female or biological male
primary independent variable (IV) – nominal - dichotomous – used i-Ready Reading Program or did not use the program
Limitations and Delimitations for the Quantitative Study
While controls were in place to assure validity and reliability, limitations and delimitations for the quantitative study existed. One of the limitations of this study was the inability to control testing conditions for the administration of the NWEA® MAP Reading Assessment across schools. While CMSD has established rules and policies for administering the NWEA® MAP Reading Assessment, a centralized proctoring team does not exist to ensure implementation occurs in exactly the same way across and within schools. Another limitation of this study was the subjective nature of teacher performance via the TDES process. While the process is standardized, the results ultimately rely on an evaluator’s opinion against a rubric. While this is true, a quantitative component was used via a teacher’s SGM. The SGM was chosen from the 2015-2016 school year to prevent a statistical error in which data that could be used for the DV is not also used as a control. Another potential limitation of the study involved the use of a FE method, as there can be a statistical error since the within-individual data is exclusively used. While FE excludes the between-individual effects, the use of controls within
29
the study, meaning sample selection based on school and teacher similarities, controlled for some of this between-individual variance, and decreased any potential errors. Finally, limitations exist with ex post facto designs in general. For example, ex post facto designs lack randomization, pose a risk of interpreting results incorrectly, and present challenges for the researcher to fully manipulate the independent variable. The researcher chose to impose some delimitations on the study itself. The study specifically looked at groups of students within the CMSD on the West Side of Cleveland. Since the study was conducted in this manner, there existed a narrowed and targeted population of students. As such, the final analysis and results of this study may not be generalizable beyond the schools studied. A further delimitation to the quantitative design that was imposed by the researcher is the effect being measured relative to the i-Ready program’s impact, and results on the NWEA® MAP Reading Assessment. While the assessment results are not solely a measure of the program, the use of these scores presented the most accurate data available via this assessment.
Summary
A quantitative research deign was ideal for this study for multiple reasons. The intent of the study was to see if the CA i-Ready program indeed had a relationship to student achievement as evidenced via the NWEA® MAP Reading Assessment scores. CA internal research indicated that the program indeed produced a positive effect, but no outside assessments were used in making this assertion. As such, and given that their analysis was done via quantitative statistics, this study measured the effect using an outside assessment, and also used quantitative methods. Furthermore, an ex post facto design was used whereby existing data were pulled after the fact to compare students who used the program, and students who did not use the program.
30
Considerations such as school and teacher were used as controls in selecting the sample. Statistical analysis was conducted via a FE Linear Regression.
31
CHAPTER IV RESULTS
This research study addressed the effectiveness of the i-Ready Reading program while used at Luis Munoz Marin Dual Language Academy (LMM) in the Cleveland Metropolitan School District (CMSD) during the 2016-2017 academic year. Specifically, the study looked to see if there was an effect on student achievement via a positive change in student reading scores on the Northwest Evaluation Association (NWEA®) Measures of Academic Progress (MAP) Reading Assessment. The goal was to see if a positive change in MAP Reading scores existed to determine whether the use of the i-Ready Reading program fulfilled the intent of the Cleveland Plan at increasing student achievement via principal autonomy at the school level. Quantitative data and methods were used to examine the effect on MAP Reading Assessment scores of
students who used the program and those who did not. This was done by analyzing NWEA MAP Reading assessment scores of two different schools – one that used the program and one that did not - from spring 2016 to spring 2017 via Fixed Effects (FE) Linear Regression.
Quantitative Data Analysis
32
1. Is there a difference in NWEA® MAP Reading Assessment scores for students who used the Curriculum Associates i-Ready Reading program, compared to students who did not use the program?
2. Is there a difference in the amount of change in NWEA® MAP Reading Assessment scores based on ethnicity (Hispanic vs. non-Hispanic) when using the Curriculum Associates i-Ready Reading program, as compared to students who did not use the program?
3. Is there a difference in the amount of change in NWEA® MAP Reading Assessment scores based on sex when using the Curriculum Associates i-Ready Reading program, compared to students who did not use the program?
The data analysis of this causal-comparative, ex post facto research compared two groups of students. The first group consisted of students were exposed to and used the i-Ready Reading Program. The second group consisted of students who did not use the i-Ready Reading Program. For the purpose of this study, both groups of students chosen were exposed to the same core English Language Arts curriculum, and quality of teacher.
Assumptions of Regression
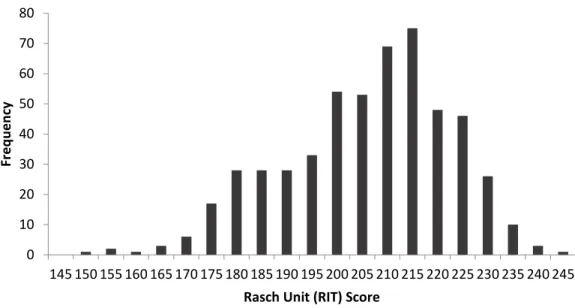
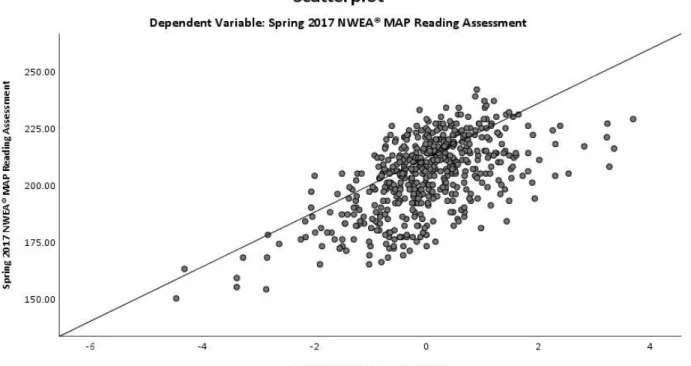
Prior to FE Linear Regression analysis, the normality of the dependent variable was assessed. This was done via the creation of a histogram of the Spring 2017 NWEA® MAP Reading Assessment scores. As is depicted in the histogram (see Figure 1), the dependent variable is approximately normally distributed, with a slight negative skew. Additionally, variances in spring reading score (dependent variable) across levels of each independent variable were examined using standardized residual plots, and all were found to have homogeneous variance across levels (see Figure 2). Next, the normality of the distribution of residuals was
33
examined. According to the Shapiro-Wilk test, the residuals distribution was not normally distributed, (530) = .955, p < .001. The researcher transformed the variable in various ways (log transformation, square root), but transformations did not change the nonnormality of the
distribution of residuals.
Figure 1. Histogram depicting distribution of spring 2017 NWEA® MAP Reading assessment
scores.
According to Warner (2013), “In general, empirical distribution shapes are considered problematic only when they differ dramatically from normal” (p. 153). Hence, this is not necessarily an essential assumption to fulfill, since the actual assumption for the regression is that the theoretical residuals are normally distributed and we cannot tell that from our sample data. But to be sure that the results were not affected by this, the analysis was conducted in various other ways to ensure the results were consistent. Other methods included doing simple independent t-tests to check differences between raw means, and then computing a change score
0 10 20 30 40 50 60 70 80 145 150 155 160 165 170 175 180 185 190 195 200 205 210 215 220 225 230 235 240 245 Fr e q u e n cy
Rasch Unit (RIT) Score
Score Distribution
Spring 2017 NWEA® MAP Reading Assessment
34
as the dependent variable instead of including both pre- and post-test scores. All resulted in the same conclusions.
Figure 2. Scatterplot depicting standardized residual of spring 2017 NWEA® MAP Reading assessment scores.
District and Study Sample Demographics
The data for this quantitative study were collected from the CMSD. The CMSD is located in the Mid-Western United States and is the public school district that serves the city of Cleveland. According to the statistics presented via the Ohio Department of Education website for the 2016-2017 academic year, the district had an enrollment of 38,949. The racial breakdown of the students enrolled as reported by the Ohio Department of Education website is as follows:
white (non-Hispanic) – 15.7%
35
Hispanic – 15.8%
Asian or pacific islander – 1.3%
American Indian or Alaskan native – .2%
multiracial – 2.6%
One hundred percent of students enrolled for that school year received free or reduced lunch. Additionally, 9.2% of students were coded as English Language Learners, while 21.8% of students were coded as students with special needs. The per pupil expenditure for that academic year was $11,054.
For this study, the sample was pulled from LMM and Scranton school in the CMSD. This determination of peer school was made via the peer schools model used with the CMSD. The peer school model clusters schools according to demographic, enrollment, and location information. This information provides a score that then allows for schools to be clustered into comparison schools based on the relative proximity of the scores when plotted. (N. D’Amico, personal communication, 2018). 533 participant scores were received, of which 530 were used as three scores did not provide school identification. To be included in the analysis, the students must have attended the school for a full academic year (FAY), and have a spring 2016 and spring 2017 NWEA® MAP Reading Assessment score. In general, a FAY means a student attended the school from at least the end of the first week of October of the academic year until the administration of spring assessments of that same school year. During the 2016-2017 school year, the FAY began on October 10, 2016. For the purposes of this study, FAY would have ended with the spring 2017 administration of the NWEA MAP Reading assessment, which in this case was February 27, 2017. Taking into consideration this time period, and time students did not receive regular instruction for various occasions, such as calamity days, field trips, and
36
breaks, the researcher used a minimum minute usage of at least 450 minutes. Only students who engaged in on-line instruction via the i-Ready Reading program for 450 minutes or more were considered as having used the program and included in the analysis. While this was the
minimum usage required to be considered part of the sample, it should be noted that greater than fifty percent of the participants who used the program had usage of more than 700 minutes. With regard to sex, there were 135 male participants who attended LMM, which constituted 25.47% of the sample, and 122 male participants who attended Scranton, which constituted 23.02% of the sample. There were 134 female participants who attended LMM, which constituted 25.28% of the sample, and 139 female participants who attended Scranton, which constituted 26.23% of the sample. With regard to ethnicity, 198 participants were Hispanic and attended LMM, or 37.36% of the sample, and 186 participants were Hispanic and attended Scranton, or 35.10% of the sample. There were 71 non-Hispanic participants who attended LMM, or 13.39% of the sample, and 75 non-Hispanic participants who attended Scranton school, or 14.15% of the sample. Regarding school, 269 participants attended LMM, or 50.8% of the sample, and 261 participants attended Scranton school, or 49.2% of the sample (see Table I).
37
Table I
Frequency and percentages of sample by sex, ethnicity, and school (n =530)
Demographic Information Frequency Percentage
Sex Female at LMM Female at Scranton Male at LMM Male at Scranton Ethnicity Hispanic at LMM Hispanic at Scranton Non-Hispanic at LMM Non-Hispanic at Scranton School LMM Scranton 134 139 135 122 198 186 71 75 269 261 25.28 26.23 25.47 23.02 37.36 35.10 13.39 14.15 50.80 49.20 Mean Score Changes
In order to confirm the results of the regression, exploratory analysis was conducted. This was done by analyzing mean score changes. The change in mean scores on the NWEA® MAP Reading Assessment scores were examined between spring 2016 and 2017 (see Table II). Three independent sample t-tests were conducted to examine mean 2016 scores, mean 2017 scores, and the changes in scores. In general, there was not a significant difference in spring 2016 mean NWEA® MAP Reading Assessment scores for Scranton school (M = 198.20, SD = 21.14) compared to LMM (M = 197.48, SD = 15.33); t (474) = .448, p = .655. In general, there was a significant difference in spring 2017 mean NWEA® MAP Reading Assessment scores for Scranton school (M = 206.49, SD = 16.32) compared to LMM (M = 201.49, SD = 16.26); t (528) = 3.542, p <.05. In general, the change score was significantly higher for Scranton school than LMM conditions; t (528) = 4.467, p <.05 (see Table II).
38
Table II
Group statistics for mean change score by school and year (n =530)
______________________________________________________________________________ n Spring 2016 mean NWEA® MAP Reading Assessment scores Spring 2017 mean NWEA® MAP Reading Assessment scores Mean Change Scranton (did not use the i-Ready Reading program)
LMM
(did use the i-Ready Reading program) 261 269 198.20 197.48 206.49 201.49 8.29 4.01
Fixed Effect Linear Regression Model
The primary independent variable of interest for this study is whether or not the student used the i-Ready Reading Program. Use of the program is labeled as school in the descriptive statistics, and LMM was coded as one for the analysis, and Scranton school was coded as zero. The dependent variable is the NWEA® MAP Reading Assessment scores, which consist of a Rasch Unit (RIT) scale with a range from 100 to 350, with a control for the reading scores prior to beginning the program. Additionally, the nominal variables of ethnicity (Hispanic, or non-Hispanic) and sex (male, or female) were included in the analysis. Ethnicity and sex were used as a means of determining whether reading scores changed more for particular subpopulations of students. Additionally, they were transformed and calculated as an interaction variable with school. Hispanic was coded as one, and non-Hispanic was coded as zero. Female was coded as one, and male was coded as zero. To control for outside factors, the Independent Variable of Spring 2016 NWEA® MAP Reading Assessment scores was used. Additionally, 2015-2016