in unemployment bene
fi
t takeup
between labour migrants
and Dutch native workers
Anita Strockmeijer, Paul de Beer and Jaco Dagevos Dutch Employee Insurance Agency, University of Amsterdam; Erasmus
University Rotterdam
Abstract The large increase in Eastern European migrants entering the Dutch labour market has led to concerns about their potential claim on Dutch unemployment benefits. We use a decomposition analysis to investigate differences in uptake of unemployment benefits between migrants and native Dutch employees by analysing register data for all employees in the Netherlands in 2015. The results show that Eastern European migrants, similar to other migrants, receive
unemployment benefit more often than native Dutch
employees. This difference can be largely ascribed to job characteristics. The inclusion of unemployment risk in the analysis reveals that non-working migrants are much less likely to receive unemployment benefits than Dutch natives.
Keywords unemployment benefit, takeup, migrant worker, social cohesion, Netherlands
Addresses for correspondence: Anita Strockmeijer (corresponding author), Dutch Employee Insurance Agency (UWV), La Guardiaweg 68, 1043 DK Amsterdam, Netherlands; email: anita.strockmeijer@uwv.nl. Professor Paul de Beer, Chair in Labour Relations at University of Amsterdam, Amsterdam Institute for Advanced Labour Studies (AIAS-HSI), Nieuwe Achtergracht 166, 1018 WV Amsterdam, Netherlands; email: p.t.debeer@uva.nl. Professor Jaco Dagevos, Chair in Integration and Migration at Erasmus University, Burgemeester Oudlaan 50, 3062 PA, Rotterdam, Netherlands; email: j.dagevos@scp.nl. Professor Jaco Dagevos is also affiliated with the Netherlands Institute for Social Research (SCP). Professor Paul de Beer is also affiliated with De Burcht (Dutch Centre for Industrial Relations).
International Social Security Review,Vol. 73, 2/2020
© 2020 The Authors. International Social Security Review published by John Wiley & Sons Ltd on behalf of International Social Security Association
75
Introduction
A consequence of the enlargement of the European Union (EU) is that many migrants from Eastern European Member States have come to the Netherlands. Labour migrants who are residents of EU Member States do not need a work permit to work in the Netherlands, making it relatively easy for Dutch employers to employ this group of workers. In 2007, when the free movement of EU workers began to widen, 63,000 migrants were in paid employment in the Netherlands; a decade later, their number had increased to almost 300,000.
For the majority of the Eastern European migrants, work is the most important reason for coming to the Netherlands, primarily because of the higher income they expect to receive (Dagevos, 2011; Gijsberts and Lubbers, 2013). These workers are willing to accept lower wages and poorer working conditions than native Dutch employees because wages in the Netherlands are substantially higher than in the Eastern EU Member States. The jobs performed by Eastern European labour migrants in the Netherlands are characterized by a high degree of uncertainty about how long employment will last and whether employment contracts will be renewed. Given that these workers are mainly employed on temporary contracts in sectors that are sensitive to economic and seasonalfluctuations, these workers face a high risk of unemployment (Huijnk, Gijsberts and Dagevos, 2014).
The Dutch Unemployment Insurance Act (Werkloosheidswet) protects employees against the financial consequences of unemployment by providing a replacement income. The share of Eastern European labour migrants among recipients of unemployment benefits is substantially higher than their share in
the working labour force (Huijnk, Gijsberts and Dagevos, 2014;
Eurofound, 2015; Statistics Netherlands, 2018). The share of European migrants claiming unemployment benefits is also higher than among native Dutch employees, by a factor of between 1.5 and 2 (Barrett and Maître, 2013).
The arrival of Eastern European labour migrants in the Netherlands has fuelled the debate about the claiming of unemployment benefits. Borjas argues that a more generous social security system can attract or pull migrants, in a process he likens to a “welfare magnet” (Borjas, 1999). A negative self-selection mechanism may operate among migrants in the sense that they migrate in the expectation that the welfare state in the host country will offer them income protection (Nannestad, 2007). Generous benefits then act as a magnet, pulling in low-skilled migrants. It is sometimes argued in the public and political discourse that, while Eastern European labour migrants come to the Netherlands to work, they do so in the knowledge that if they become unemployed they can count on more generous unemployment arrangements than in their home country.
Although Eastern European labour migrants are more often in receipt of unemployment benefits, studies have often taken no account of differences in
background characteristics. The existence of a“pull”mechanism is difficult to test empirically, but we can investigate whether, after controlling for migrants’ background characteristics and labour market position, their takeup of unemployment benefits is disproportionately high. The unemployment risk of labour migrants was not included in earlier analyses (Huijnk, Gijsberts and Dagevos, 2014; Eurofound, 2015; Statistics Netherlands, 2018), while excluding their often vulnerable labour market position risks missing a possible explanation for their higher takeup of unemployment benefits.
The development of more detailed knowledge about the relationship between migrants and their use of social security programmes is highly desirable (Guild, Carrera and Eisele, 2013). If (too) many migrants make use of social security, this can put pressure on (national) solidarity (De Beer and Koster, 2007; Reesken and Van Oorschot, 2012) and have a bearing on public support for migration and the way migrants are perceived. In turn, this could threaten the legitimacy of migrant workers and therefore the continuation of their rights if they should become unemployed. This is not an imaginary risk: a large majority of the Dutch population (80 per cent) believe that migrants should go back to their country of origin if they become unemployed, while almost 60 per cent agree with the statement that migrants from Eastern Europe abuse the benefits system (Dagevos and Gijsberts, 2013).
To enable us to form a more substantiated view on the takeup of unemployment benefits by Eastern European labour migrants, in this article we address the following question: Do Eastern European migrants claim Dutch unemployment benefits more often than Dutch natives, and if so, to what extent can this be explained by differences in personal and job characteristics?
Theoretical framework
To be able to claim unemployment benefits, an employee must pass through two stages. Thefirst is to lose their work and become unemployed. The second is to apply for unemployment benefit; provided they meet the conditions set out in the Unemployment Insurance Act, they may then receive benefits. In this article we analyse these two stages, first separately and then in combination. The distinction between the two stages is important, because the factors that influence the risk of becoming unemployed may be different from those affecting the likelihood of receiving benefits after becoming unemployed. It is, for instance, possible that workers in a vulnerable labour market position are more likely to become unemployed but are less likely to be awarded unemployment benefits if they do. This may occur, for example, because they do not meet all the eligibility criteria, such as the number of requisite weeks worked.
We analyse the risk of becoming unemployed to shed light on the effect of migrants’ vulnerable labour market position and then investigate whether migrants who have lost their jobs receive unemployment benefits more or less often than native workers. We then combine the data on the two stages to explore whether labour migrants overall claim unemployment benefit more or less often than native Dutch employees. This latter exercise aligns with the majority of studies, which look at the relative benefit takeup of labour migrants
(Barrett and Maître, 2013; Huijnk, Gijsberts and Dagevos, 2014;
Eurofound, 2015; Statistics Netherlands, 2018). Additionally, it offers an insight into the question of whether the impact of thefirst stage (losing work) or of the second stage (receiving unemployment benefit when unemployed) is the dominant factor for the total takeup of benefits.
The risk of employees losing their job depends on factors such as the sector in which they work and the type of employment contract they have. In a contracting economy, the reduction in employment is generally more marked in the private sector than the public sector (Vrooman, 2009). The risk of unemployment is also substantial in sectors that are subject to seasonal fluctuations in demand for labour. It is commonplace for employers in the agro-sector, for example, to hire Eastern European labour migrants to accommodate peaks in the workload. Short periods of employment also characterize the temporary employment sector. Many labour migrants from Eastern Europe find work with a Dutch employer in this sector owing to active placement by temporary employment agencies in their home country (Strockmeijer, De Beer and Dagevos, 2017). We therefore expect Eastern European labour migrants, given the sectors in which they are employed (especially the agro-sector and the temporary employment sector), to be at greater risk of unemployment, since these jobs are commonly temporary.
Employees with temporary employment contracts are at greater risk of unemployment than those with permanent employment contracts and more often receive unemployment benefits (Van der Werff, Kroon and Heyma, 2016). Employees with a migration background more often have flexible employment contracts than those with a Dutch background, and Eastern European labour migrants tend to work under temporary employment contracts over longer periods than do other migrant groups (Berkhout, Bisschop and Volkerink, 2014; Strockmeijer, De Beer and Dagevos, 2017). This, too, translates into a higher risk of unemployment for Eastern European labour migrants.
Apart from job characteristics, the unemployment risk also depends on personal characteristics. The risk of becoming unemployed is relatively high among young employees, who often have temporary contracts and who are often first in line for dismissal at times of rationalization (“last in, first out”). The average age of labour migrants from Eastern Europe is age 33, eight years younger than that of
native Dutch employees (Strockmeijer, De Beer and Dagevos, 2017). This also contributes to the higher risk of these workers losing their jobs.
Low-skilled workers have a greater risk of unemployment than workers with a higher education level. The share of low-skilled workers is twice as high among Eastern European labour migrants than among native Dutch employees (Dagevos, 2011). In addition, there is often a poor match between Eastern European labour migrants’educational background and their job: they are often overqualified for the work they are doing, or are qualified for a different type of work (Dagevos, 2011).
Finally, gender also influences the risk of unemployment. For many years, the unemployment rate for women was higher than that for men, but this difference disappeared during the most recent economic crisis; men are now actually slightly more at risk of losing their jobs because they work in more economically sensitive sectors such as construction and transport (Merens and Van den Brakel, 2014). The overrepresentation of Eastern European men in precisely these sectors heightens their risk of unemployment.
The above overview shows that the specific job and personal characteristics of Eastern European labour migrants are contributory factors in their risk of unemployment. Ourfirst hypothesis states that:
Eastern European labour migrants lose their jobs more often than do native Dutch employees because of their job characteristics (H1a) and because of their personal characteristics(H1b).
Employees pay mandatory contributions towards unemployment insurance, affording them protection against thefinancial consequences of unemployment. Eastern European labour migrants pay these contributions, as do native Dutch employees, via their employer. To qualify for Dutch unemployment benefits, an employee must have been working in the Netherlands for at least 26 weeks during the 36 weeks preceding the first day of unemployment. An unemployed employee is then entitled to receive unemployment benefit for a period of three months. A longer employment history confers a longer entitlement to unemployment benefit. EU Regulations on social security ensure that differences in social security systems between countries do not pose a barrier to the free movement of workers.1 If an employee works in another Member State, he or she enjoys the same social and tax advantages as employees who are nationals of that Member State.2 Eastern European labour migrants therefore have the same entitlement to unemployment benefits as native Dutch employees. Periods in
1. Regulation 883/2004 (the base Regulation) and 987/2009 (the implementing Regulation).
2. Article 7(2) of Regulation 492/2011 guarantees the equal treatment of employees.
employment in the Netherlands, and elsewhere (EU/EEA), are taken into account in calculating the number of weeks and years worked.3
The requirement regarding the number of weeks worked means that unemployed workers with a short employment history do not always qualify for unemployment benefit. Many Eastern European labour migrants are young (Strockmeijer, De Beer and Dagevos, 2017), and almost half of them are
“starters” (see below) on the Dutch labour market, meaning they first began working as employees in the Netherlands in the previous calendar year. By contrast, only 2 per cent of native Dutch employees are starters (Strockmeijer, De Beer and Dagevos, 2017). We would accordingly expect a high proportion of Eastern European labour migrants to have no entitlement to unemployment benefits when losing their job.
As stated, labour migrants may count the weeks worked in their country of origin as part of their entitlement to unemployment benefits, but they must apply for this to be taken into account explicitly. In 2015, only 32 applications included the foreign employment history when entitlement to unemployment benefit was being determining (Pacolet and De Wispelaere, 2016).4
Even when a worker is entitled to unemployment benefit, a lack of knowledge about the Dutch benefits system can still create a barrier to claiming it. An unemployed worker needs to know about the unemployment benefits system and the administrative procedures involved in making a claim (Hernanz, Malherbet and Pellizzari, 2004; Renema, 2018). Although we might expect labour migrants to have less knowledge than native Dutch employees, a study by Renema (2018) shows that many Polish migrants are aware of the Dutch eligibility requirements: 80 per cent know the rules governing entitlement. In answer to the question of when someone is entitled to unemployment benefits, a large majority select the response category “after having worked, paid taxes and social contributions for an extended period”. Respondents know that they are only entitled to unemployment benefit if they have been economically active in the Netherlands for a certain period; native Dutch employees were not asked this question. Social networks are one way in which this knowledge is transferred. Eastern European labour migrants often make use of employment placement agencies and intermediaries, which are by no means always concerned exclusively
3. Articles 6 and 61 of Regulation 883/2004 stipulate that periods of employment completed in
another EU Member State must be taken into account as though they were periods completed in the Netherlands.
4. An employee who has received wages for 52 days or more per year during four of the lastfive years
meets the “year requirement”. An employee who meets the year requirement is entitled to
extension of the duration of benefits by one month per employment year worked.
Approximately 9,000 applications were submitted in 2015 wherein the applicants may have had an employment history, impacting on the extension of the duration of the unemployment benefit. In 2,927 of the successful applications, the applicant had a Polish employment history.
with job placement, but also communicate with the benefits agency when the temporary employment contract expires (Guiaux, 2016).
Lack of knowledge therefore appears to be less of a barrier for Eastern European labour migrants than their employment history. Our second hypothesis is therefore:
Unemployed Eastern European migrants are less likely to receive unemployment benefit than do unemployed native Dutch workers because they are often unable to meet the requirement regarding the number of weeks worked(H2).
If Eastern European labour migrants lose their jobs more often than Dutch natives because of their job and personal characteristics, but less often receive unemployment benefits due to an insufficient employment history, the question then is which effect is dominant. Are Eastern European labour migrants more or less likely to receive unemployment benefits? There is considerable difference in the labour market position between Eastern European labour migrants and native Dutch employees (see Strockmeijer, De Beer and Dagevos, 2017). However, labour migrants are well aware of their unemployment benefit entitlements and know that they are entitled to benefits after working for six months. Accordingly, we expect the first effect (a higher risk of unemployment) to be stronger than the second effect (a lower chance of receiving benefits in the event of unemployment). Additionally, given that earlier studies show a higher takeup of unemployment benefits by Eastern European migrants, our third hypothesis is as follows:
Eastern European employees are more likely to receive unemployment benefits than native Dutch employees(H3).
Data and methods
Data
To answer the research question, the study drew on administrative microdata published by Statistics Netherlands concerning the jobs and wages of employees in the Netherlands, as well as unemployment benefits. The country of origin of employees born abroad was added to the employees’database in order to be able to distinguish between different groups of migrants in the analyses.
The focus in the analyses is on Eastern European labour migrants. The share of labour migrants from Eastern Europe in paid employment in the Netherlands and enrolled in the population register is around 45 per cent (Strockmeijer, De Beer and Dagevos, 2019). Focusing on both registered and unregistered labour migrants
produced a rich research database for the entire population of Eastern European labour migrants in paid employment. Their position is compared with that of native Dutch employees. We also wish to compare the Eastern European population with other migrant groups. To do so, we group migrants by origin into a number of categories: “Eastern European”; “other EU” (Member States that had free movement of workers before EU enlargement in 2004 and 2007, as well as Iceland, Liechtenstein, Norway (EEA) and Switzerland); “Western”;
“Non-Western”; and Turkish and Moroccan employees, who formed the largest group of labour migrants in the 1960s and 1970s, are placed in a separate category. In January 2015, there were 6.3 million employees aged 19 to 60 in paid employment in the Netherlands. Just over 183,000 were of Eastern European origin, or 2.9 per cent of the cohort (Table 1). The share of native Dutch employees in the total number of employees working in January 2015 was 87.0 per cent.
Dependent variables
We used two dependent variables:“no work in paid employment”and“receiving unemployment benefits”. “Receiving unemployment benefits” applies for employees from the cohort with “no work in paid employment” if they are no longer in paid employment in the Netherlands for at least one month within a year. To measure this, we monitor the cohort from February 2015 to December 2015 inclusive. Analysis of the variable“no work in paid employment” sheds light on the effects of a person’s labour market position. From this we can determine whether the often vulnerable labour market position of labour migrants is an important reason for their high share of claims for unemployment benefits. We derive the variable “no work in paid employment” from the monthly
Table 1. Share of employees aged 19–60 and background characteristics, cohort January 2015
Origin Share employees (%) Share male (%) Average age Share temporary work (%)
Eastern European 2.9 57.2 33.1 70.9 Other EU 2.5 55.3 39.7 35.3 Western excl. EU 1.2 47.1 41.0 34.3 Non-Western 4.5 51.2 40.4 36.6 Turkish/Moroccan 2.0 62.2 40.6 29.7 Dutch 87.0 51.2 39.7 26.8 100.0
Source:Authors, derived from Statistics Netherlands (2016).
observations of wage income. If an employee receives no income from wages in a given month, this suggests no work in paid employment in the Netherlands.
To avoid measuring mainly seasonal effects, we opted not to measure a single moment at which employees were or were not in work. Rather, we opted to spread the measurement over a period of one year. We use the term“no work in paid employment in the Netherlands” rather than “unemployed” because being unemployed implies that people have no work, have recently been looking for work and are available for work–information that we do not have. Although we refer to “no work”, we cannot rule out the possibility that income was obtained from self-employed activity during the relevant period, since this is another factor on which we have no information. It is moreover unclear whether people who are no longer in paid employment are still living in the Netherlands. We can therefore make statements about the extent to which migrants receive unemployment benefits more or less often than native Dutch employees after losing their job, but not why some of them do not claim unemployment benefits. However, this information is not needed in order to answer the main question, as we are concerned with whether Eastern European labour migrants receive unemployment benefits more or less often; the question of why is less important here. “No work” is a dichotomous variable; it is about becoming unemployed, not about how long someone spends without work.
The Dutch unemployment benefits database is linked to the employee database and contains information on unemployment benefits paid in the year 2015. For the variable“receiving unemployment benefits”, we monitor the cohort over the same period of a year and observe whether they received unemployment benefit for at least one month during that period. We measure the incidence, i.e. the number of people starting to receive unemployment benefits within a year, whereas most other studies focus on the prevalence, i.e. the total takeup of unemployment benefits at a specific moment. “Receiving unemployment benefits” is similarly a dichotomous variable: receiving or not receiving unemployment benefits within a year. If a person receives both income from wages and unemployment benefits in a given month, we interpreted this as receiving unemployment benefits.
Independent variables
Gender, age, contract, sector, hourly wage, employment history and origin were used as independent variables in our analyses. We have no information on education level for Eastern European labour migrants who are not enrolled in the population register, nor for the majority of those who are enrolled. We use hourly wage as a proxy for the strength of the labour market position (which is related to education, but also to other factors such as the skill level required by
the job); a lower hourly wage generally suggests a vulnerable position on the labour market.
We derive employment history from the number of years that employees were in paid employment in the Netherlands in the period 2011–2014. We distinguish between three categories: starters, employees with a longer employment history, and employees with an interrupted employment history. A starter is someone who worked in paid employment in the Netherlands for thefirst time in 2014. An employee with a longer employment history was in paid employment in the Netherlands for at least six months in each of the four preceding years (2011–2014). An employee with an interrupted employment history worked in paid employment for some of the period 2010–2014, but not in all years and not just in 2014.
Research methodology
We use the decomposition method to investigate differences in receipt of unemployment benefits between two groups of employees, and to determine the extent to which those differences are attributable to personal and job characteristics. This is a suitable method for investigating differences in average outcomes between two groups (Jann, 2008). In our analyses, we explain the differences between different migrant groups and native Dutch employees. The decomposition analysis breaks down the differences into an explained and an unexplained part. The explained difference shows what proportion of the difference can be ascribed to the background characteristics included in the model – in this case gender, age, contract, sector, hourly wage and employment history. The unexplained part reflects the portion of the differences between the groups that remains after controlling for the background characteristics. This unexplained part is often ascribed in the literature to discrimination, but it may also be caused by variables that are not included in the model, for example, in our case, education level. The Oaxaca method was used for the analyses in this article (Jann, 2008). This method enables categorical predictor variables to be included in the statistical programme Stata. We use logical regression analysis, present the categorical predictor variables and use deviation dummies.
First, we analyse whether and to what extent differences in“no work”between a labour migrant group and native Dutch employees can be explained by personal and job characteristics. We estimate the probability of loss of work by those in work:
P loses work between t and tð þ1jworktÞ
This tests hypothesis 1a that Eastern European labour migrants more often lose their jobs than do native Dutch employees and that this difference can be explained by their job characteristics. It equally tests hypothesis 1b that this difference can be explained by their personal characteristics.
We then investigate the difference in receipt of unemployment benefits between labour migrants without work and Dutch natives without work, exploring the extent to which personal and job characteristics, including employment history, explain the differences. We estimate the probability of receiving unemployment benefits given the fact that people are not in work:
P receiving unemployment benefits between t and tð þ1jloses work between t andtþ1Þ
This tests hypothesis 2, which posits that the employment history of Eastern European labour migrants is often insufficient to qualify for unemployment benefits.
Finally, we examine which of the two effects dominates, estimating the probability that workers who lose their jobs will receive unemployment benefits:
P receiving unemployment benefits between t and tð þ1jworktjÞ
This tests hypothesis 3, which posits that Eastern European labour migrants who lose their jobs are more likely to receive unemployment benefits than native Dutch employees. The different routes to receiving unemployment benefits are shown in Figure 1.
Figure 1.Schematic representation of different effects into unemployment benefits
Source: Authors.
Results
No work
Of the 183,000 Eastern European labour migrants who were in paid employment in the Netherlands in January 2015, 59.7 per cent worked in every month of that year. The remainder (40.3 per cent) were not in paid employment for one or more months in 2015 (Table 2). Among native Dutch employees, 10.4 per cent were not in paid employment for at least one month. Other migrant groups occupy an intermediate position, with the proportion not in paid employment for at least one month varying from 15.2 to 19.3 per cent. By some margin, therefore, Eastern European labour migrants more often have no work in the Netherlands.
Four times as many Eastern European labour migrants have thus spent at least a month with “no work” as have native Dutch employees: a difference of 29.9 percentage points. In total, 80 per cent of this difference (23.6 percentage points) can be ascribed to differences in the job and personal characteristics included in the model, while the remaining 6.3 percentage points of the difference are unexplained. Table 3 presents the results of the decomposition analysis. Job characteristics and employment history make the biggest contribution to explaining the difference in the share with no work between Eastern European labour migrants and native Dutch employees.
The main explanatory characteristic is employment history, accounting for 8.0 of the 23.6 percentage points difference in the chance of having no work (i.e. the greater chance that Eastern European labour migrants will have no work). In interpreting the individual categories, the effect is a combination of the
Table 2.Number of employees aged 20–60 and the share who received no income from wages for at least one month during a year, cohort January 2015
Origin Number of employees (x 1,000) Share of employees with no work in paid employment for at least one month (%)
Eastern European 183 40.3 Other EU 161 19.3 Western excl.EU 75 16.8 Non-Western 283 18.4 Turkish/Moroccan 124 15.2 Dutch 5,518 10.4 6,346 100.0
Source:Authors, derived from Statistics Netherlands (2016).
Table 3. Results of decomposition analysis of the chance of having no work; contribution by personal and job characteristics to explaining differences between migrants and native Dutch employees, cohort January 2015
Eastern Europe versus Netherlands Other EU versus Netherlands Westers versus Netherlands Non-Western versus Netherlands Turkey/Morocco versus Netherlands Size group_1 EE: 183,193 EU: 160,977 W: 75,318 NW: 283,373 T/M: 124,187 Size group_2 NL: 5,518,436 NL: 5,518,436 NL:,518,436 NL: 5,518,436 NL: 5,518,436 Labour migrants .403 .193 .168 .184 .152 Dutch employees .104 .104 .104 .104 .104 Difference .299 .089 .064 .080 .048 Explained difference .236 .053 .040 .047 .019 Unexplained difference .063 .037 .024 .033 .028 Explained difference (in % in brackets): (79.0) (60.0) (62.5) (58.8) (39.6)
Total contract effect .068 .010 .008 .012 .004
Sector Agro-sector -.002 .000 .000 .000 -.001 Construction .000 .000 .000 .000 .000 Industry* .000 -.001 .000 .001 -.001 Retail .000 .000 .000 .000 .000 Transport .000 .000 .000 .000 .000 Financial services -.002 .001 .001 .000 -.002 Temp agencies .014 .018 .001 .002 .003 Health -.001 .000 .000 .000 .000 Education .003 .000 .000 .001 .001 Public sector .013 .007 .003 .001 .002 Other/cleaning .000 .001 .001 .003 .003
~ Total sector effect .033 .013 .008 .009 .007
Hourly wage €1-5 -.002 -.001 -.001 .000 -.001 €5-10* .023 .000 .001 .003 .002 €10-15 -.001 .000 .000 -.001 -.002 €15-20 .014 .002 .002 .002 .002 €20-25 .011 .002 .002 .004 .004 €25-30 .005 .000 .001 .002 .003 (Continued) 87
individual category and the over- or under-representation of the origin group in that category. Employees with a longer employment history more often hold onto their work and are thus less often without work. Eastern European labour migrants are under-represented in this category compared with Dutch employees, and this explains almost a quarter of the explained difference in the probability of no work. The opposite effect, but with the same result, occurs for starters on the labour market, with no employment history and a greater likelihood of having no work. Eastern European labour migrants are predominantly starters compared with native Dutch employees, and this explains part of their greater chance of having no work.
Employment with a temporary contract more often leads to no work. Eastern European labour migrants much more often have temporary contracts than do
Table 3.Results of decomposition analysis of the chance of having no work; contribution by personal and job characteristics to explaining differences between migrants and native Dutch employees, cohort January 2015- Continued
Eastern Europe versus Netherlands Other EU versus Netherlands Westers versus Netherlands Non-Western versus Netherlands Turkey/Morocco versus Netherlands >€30 .000 .000 .000 .000 .000
~Total hourly wage effect .052 .004 .004 .010 .008 Employment history Starter .017 .007 .004 .003 .002 Interrupted* .010 .003 .003 .003 .002 Longer .053 .020 .014 .014 .007 ~ Total employment history effect .080 .030 .020 .020 .011 Age 19–24* .003 -.002 -.002 -.002 -.003 25–34 -.001 .000 .000 .000 .000 35–44 .000 -.001 -.001 -.001 -.003 45–54 .005 .000 .001 .000 -.001 55–60 -.002 .000 .000 .000 -.001
~ Total age effect .004 -.004 -.002 -.004 -.009
Total gender effect 0.001 -.001 .000 .000 -.001
Notes:* reference category;€= euro. Source:Authors.
native Dutch employees, and are therefore more often without work than are native Dutch employees. If Eastern European labour migrants had permanent contracts in numbers proportional to that of native Dutch employees, the share with no work would reduce by 6.8 percentage points.
The total sector effect explains 3.3 percentage points of the difference in having no work. The risk of no work varies across sectors; the sector effect of the public sector is for example small because the risk of losing a job in this sector is limited. This is a sector in which Eastern European labour migrants are heavily under-represented compared with native Dutch employees, which explains part of their greater probability of being without work. Employees in the temporary employment sector also have a greater chance of having no work. With the over-representation of Eastern European labour migrants in the sector, this also explains their greater chance of having no work. The sector effect thus explains the difference due to both over-representation in high-risk sectors and under-representation in low-risk sectors.
We treat hourly wage as a proxy for the strength of the labour market position, with a lower hourly wage indicating a vulnerable position and a greater probability of unemployment. The logit analysis confirms this: workers in the two lowest hourly wage categories are at greater risk of having no work. Half the Eastern European labour migrants receive an hourly wage of between 5 euros and 10 euros per hour, compared with 10 per cent of native Dutch employees. This explains 10 per cent of the explained difference in the risk of having no work between the two groups. The total effect of hourly wage on no work equates to 5.2 of the explained difference of 23.6 percentage points. Differences in the personal characteristics of gender and age explain only a very small part of the difference in the risk of having no work.
To summarize, 80 per cent of the large difference between Eastern European labour migrants and native Dutch employees in the probability of spending at least one month during a year with “no work in paid employment” in the Netherlands can be explained by employment history, job characteristics and, to a lesser extent, personal characteristics. These results support hypothesis 1a that Eastern European labour migrants are at greater risk of having no work than native Dutch employees, and that this is due to their job characteristics, which indicate a vulnerable position on the labour market. However, personal character-istics offer virtually no explanation for the differences, and hypothesis 1b is therefore rejected.
Table 3 also shows the results of the decomposition analysis for other migrant groups. They too are at greater risk of having no work compared with native Dutch employees, but the difference is smaller than for Eastern European migrants, and a smaller part of the difference can be explained by job characteristics.
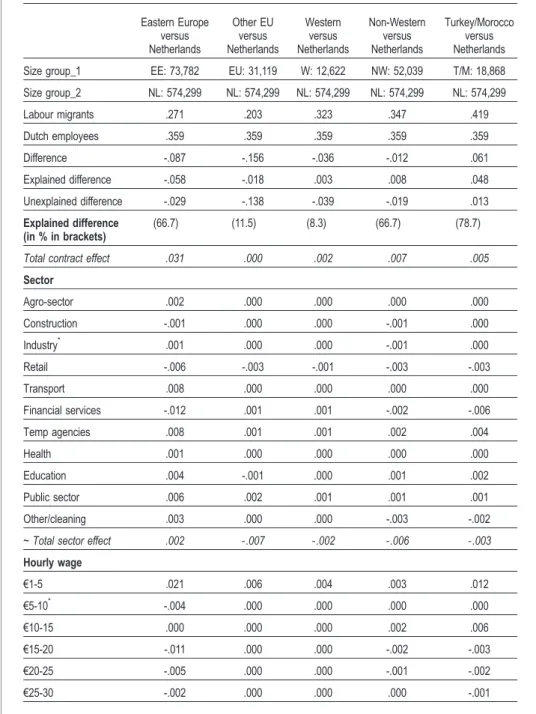
Receipt of unemployment benefits by non-workers
Employees from the cohort who have performed no work in paid employment in the Netherlands for one or more months during a year are potentially eligible for unemployment benefit. We find that just over one in four Eastern European labour migrants without work received unemployment benefit, compared with one in three non-working native Dutch employees (Table 4). The difference between the two groups is 8.7 percentage points; 67 per cent of this difference (5.8 percentage points) can be explained by differences in personal and job characteristics. Once again, the majority of the difference is explained by the characteristics that were included in the model. A third of the difference (2.9 of the 8.7 percentage points) is not explained by background characteristics. The main explanation for the smaller share of non-working Eastern European labour migrants receiving unemployment benefits is employment history. A longer employment history qualifies the person concerned for a longer duration of unemployment benefits, but relatively few Eastern European labour migrants have a lengthy employment history. Conversely, starters on the labour market do not always qualify for unemployment benefits, and many Eastern European labour migrants without work fell into this category. Employment history explains 10.4 percentage points of the smaller share of Eastern European labour migrants receiving unemployment benefits compared with non-working native Dutch employees. The explained portion is 8.7 percentage points, which means that other job and personal characteristics partially compensate for the effect.
Non-workers who held temporary employment contracts more often claim unemployment benefit than do non-workers who held permanent employment contracts. It may be that employees who held a permanent contract find new work more quickly. Receipt of unemployment benefits by non-workers with temporary employment contracts explains 3.1 percentage points of the greater share of Eastern European migrants receiving unemployment benefits, thereby partly compensating for the lower share receiving unemployment benefits owing to a shorter employment history. Young people who lose their jobs more often claim unemployment benefits than older workers, contributing to the slightly greater share of Eastern Europeans in receipt of unemployment benefits. On the one hand, Eastern European labour migrants are under-represented in the financial services sector, where the likelihood of receiving unemployment benefits is relatively high; this partly explains the lower share of Eastern European labour migrants receiving unemployment benefits. On the other hand, Eastern European migrants are also under-represented in sectors with a low likelihood of moving onto unemployment benefits, such as the public sector and education, which has the effect of increasing the share receiving benefits. The total sector effect therefore explains only a small part of the difference in receiving unemployment
benefits: 0.2 percentage points. Differences in gender and hourly wage, as a proxy for strength of the labour market position, offer no significant explanation for the difference in receiving unemployment benefits.
To sum up, a relatively high proportion of Eastern European labour migrants spent at least one month during the course of a year with no work, but relatively few non-working labour migrants received unemployment benefits, and this difference is explained principally by their employment history. These findings support hypothesis 2 that many Eastern European migrants are unable to meet the required number of weeks worked to qualify for Dutch unemployment benefits. The limited unexplained portion may be due to a lack of knowledge on the part of migrants about their unemployment benefit entitlements, preventing them from making a claim. It is also plausible that some of them return to their country of origin or move to another EU Member State if they become unemployed, and therefore do not claim Dutch benefits.
Turkish and Moroccan labour migrants without work are the only migrant group who are more likely to receive unemployment benefits than non-working native Dutch employees (Table 4). For labour migrants from other European countries, with both a Western and non-Western origin, only a small part of the difference can be ascribed to job and personal characteristics, with other, unknown factors playing a bigger role.
Total share of labour migrants receiving unemployment benefits
The foregoing analyses show that Eastern European labour migrants who lose their jobs due to their vulnerable labour market position are less likely to receive unemployment benefits because of their short employment history. Next, we look at whether Eastern European labour migrants in paid employment are more or less likely to receive unemployment benefits than native Dutch employees? Receiving unemployment benefits is plotted against the starting position of having work. The share of Eastern European labour migrants is found to be substantially greater than that of native Dutch employees, at 14.7 per cent and 5.5 per cent, respectively (Figure 2).
The greater share of Eastern European labour migrants receiving
unemployment benefits shows that the effect of their vulnerable labour market position on the receipt of unemployment benefits is greater than their lower receipt of these benefits if they lose their job. In total, 87 per cent of the difference of 9.2 percentage points (which equates to 8.0 percentage points) is explained by the characteristics included in the model. Table 5 shows the difference in receipt of unemployment benefits between native Dutch employees and different migrant groups, from the perspective of migrants.
Table 4.Results of decomposition analysis of receiving unemployment benefits given no work; contribution by personal and job characteristics to explaining differences between non-working migrants and non-working native Dutch employees, cohort January 2015
Eastern Europe versus Netherlands Other EU versus Netherlands Western versus Netherlands Non-Western versus Netherlands Turkey/Morocco versus Netherlands Size group_1 EE: 73,782 EU: 31,119 W: 12,622 NW: 52,039 T/M: 18,868 Size group_2 NL: 574,299 NL: 574,299 NL: 574,299 NL: 574,299 NL: 574,299 Labour migrants .271 .203 .323 .347 .419 Dutch employees .359 .359 .359 .359 .359 Difference -.087 -.156 -.036 -.012 .061 Explained difference -.058 -.018 .003 .008 .048 Unexplained difference -.029 -.138 -.039 -.019 .013 Explained difference (in % in brackets) (66.7) (11.5) (8.3) (66.7) (78.7)
Total contract effect .031 .000 .002 .007 .005
Sector Agro-sector .002 .000 .000 .000 .000 Construction -.001 .000 .000 -.001 .000 Industry* .001 .000 .000 -.001 .000 Retail -.006 -.003 -.001 -.003 -.003 Transport .008 .000 .000 .000 .000 Financial services -.012 .001 .001 -.002 -.006 Temp agencies .008 .001 .001 .002 .004 Health .001 .000 .000 .000 .000 Education .004 -.001 .000 .001 .002 Public sector .006 .002 .001 .001 .001 Other/cleaning .003 .000 .000 -.003 -.002
~ Total sector effect .002 -.007 -.002 -.006 -.003
Hourly wage €1-5 .021 .006 .004 .003 .012 €5-10* -.004 .000 .000 .000 .000 €10-15 .000 .000 .000 .002 .006 €15-20 -.011 .000 .000 -.002 -.003 €20-25 -.005 .000 .000 -.001 -.002 €25-30 -.002 .000 .000 .000 -.001 (Continued) 92
The type of employment contracts of Eastern European labour migrants and the sectors in which they are employed both explain why they receive unemployment benefits more often than native Dutch employees. As Eastern Europeans more often have temporary contracts, more often work in the temporary employment sector, and less often work in the public sector, they are more likely to claim unemployment benefits. The fact that the effects of employment contract and sector are greater than those of age and employment history is responsible for the greater receipt of unemployment benefits by Eastern European labour migrants compared with native Dutch employees. The findings support hypothesis 3. The limited proportion of around 10 per cent that cannot be explained by job and personal characteristics (1.1 of the difference of
Table 4.Results of decomposition analysis of receiving unemployment benefits given no work; contribution by personal and job characteristics to explaining differences between non-working migrants and non-working native Dutch employees, cohort January 2015
- Continued Eastern Europe versus Netherlands Other EU versus Netherlands Western versus Netherlands Non-Western versus Netherlands Turkey/Morocco versus Netherlands >€30 .000 .000 .000 .000 .000
~ Total hourly wage effect -.002 .006 .004 .002 .011 Employment history Starter -.051 -.026 -.013 -.012 -.010 Interrupted* .001 .000 .001 .001 .001 Longer -.053 -.023 -.013 -.017 -.016 ~ Total employment history effect -.104 -.048 -.025 -.028 -.024 Age 19–24* .021 .027 .021 .028 .045 25–34 .001 .000 .000 .000 .000 35–44 .003 .004 .003 .004 .012 45–54 -.005 .001 .000 .001 .004 55–60 -.004 -.001 .000 -.001 -.003
~Total age effect .016 .031 .024 .032 .059
Total gender effect -.001 .000 .000 .000 .000
Notes:* reference category;€= euro. Source: Authors.
9.2 percentage points) leaves little scope for strategic behaviour by labour migrants who come to the host country in order to take advantage of a more generous unemployment benefits system.
The takeup of unemployment benefits is also higher by other migrants, with the exception of those from other European countries. The difference between migrant groups and native Dutch employees is however smaller, and between 64 and 84 per cent of the difference can be ascribed to job and personal characteristics; the unexplained part is limited. The type of employment contract explains a large part of the difference, especially for Western and non-Western migrants (42 per cent and 43 per cent, respectively), while hourly wage explains a relatively large part of the difference for Turkish and Moroccan migrants (44 per cent).
Conclusions and discussion
In this study, we investigated the difference in takeup of Dutch unemployment benefits between migrant groups and native Dutch employees. More specifically, by drawing a distinction between the probability of becoming unemployed and the probability of receiving benefits, we also investigated the importance of labour migrants’vulnerable position on the labour market. We included job and
Figure 2. Receiving unemployment benefits, migrant groups and native Dutch employees, cohort January 2015 (in percentage)
Source: Authors.
Table 5. Results of decomposition analysis of receiving unemployment benefits; contribution of personal and job characteristics to explaining differences between migrants and native Dutch employees, cohort January 2015
Eastern Europe versus Netherlands Other EU versus Netherlands Western versus Netherlands Non-Western versus Netherlands Turkey/Morocco versus Netherlands Size group_1 EE: 183,193 EU: 160,977 W: 75,318 NW: 283,373 T/M: 124,187 Size group_2 NL: 5,518,436 NL: 5,518,436 NL: 5,518,436 NL: 5,518,436 NL: 5,518,436 Labour migrants .147 .053 .074 .090 .091 Dutch employees .055 .055 .055 .055 .055 Difference .092 -.002 .019 .035 .036 Explained difference .080 .011 .016 .025 .023 Unexplained difference .011 -.013 .003 .010 .013 Explained difference (in % in brackets): (87.0) (~) (84.2) (71.4) (63.9)
Total contract effect .052 .005 .007 .011 .003
Sector Agro-sector .001 .000 .000 .000 .000 Construction .000 .000 .000 .000 .000 Industry* .000 .000 .000 .000 .000 Retail .000 .000 .000 .000 .000 Transport .002 .000 .000 .000 .000 Financial services -.002 .000 .001 .000 -.002 Temp agencies .014 .001 .001 .002 .003 Health .000 .000 .000 .000 .000 Education .002 .000 .000 .001 .001 Public sector .012 .004 .003 .002 .002 Other/cleaning .000 .000 .000 .000 .001
~ Total sector effect .029 .006 .006 .005 .005
Hourly wage €1-5 .000 .000 .000 .000 .000 €5-10* .014 .000 .000 .002 .002 €10-15 .003 .000 .001 .003 .006 €15-20 -.001 .000 .000 .000 .000 €20-25 .002 .000 .000 .001 .001 €25-30 .001 .000 .000 .001 .001 (Continued) 95
personal characteristics in the analyses in a bid to explain the differences between labour migrants and native Dutch employees.
In a similar manner to migrants from other groups, Eastern European labour migrants receive unemployment benefits more often than do native Dutch employees (15 per cent versus 6 per cent, respectively). We can explain a large part of the difference (90 per cent) by differences in job characteristics between the groups of employees. As Eastern Europeans more often have temporary employment contracts, more often work in the temporary employment sector and less often in the public sector, their likelihood of claiming unemployment benefits is higher. Although the fact that Eastern European labour migrants are younger on average and are more often labour market starters, which reduces their probability of receiving unemployment benefits, their takeup is still higher than that of native Dutch employees. Based on the“welfare magnet” theory, we
Table 5.Results of decomposition analysis of receiving unemployment benefits; contribution of personal and job characteristics to explaining differences between migrants and native Dutch employees, cohort January 2015- Continued
Eastern Europe versus Netherlands Other EU versus Netherlands Western versus Netherlands Non-Western versus Netherlands Turkey/Morocco versus Netherlands >€30 .000 .000 .000 .000 .000
~Total hourly wage effect .020 .000 .002 .007 .010 Employment history Starter -.01 -.003 -.002 -.002 -.001 Interrupted* .005 .002 .002 .003 .001 Longer -.006 -.002 -.002 -.002 -.001 ~Total employment history effect -.010 -.003 -.002 -.001 -.001 Age 19–24* -.003 .002 .003 .003 .006 25–34 .000 .000 .000 .000 .000 35–44 .000 .000 .000 .001 .002 45–54 -.003 .000 .000 .000 .001 55–60 -.003 -.001 .001 -.001 -.003
~ Total age effect -.010 .002 .004 .004 .006
Total gender effect -.001 .000 .000 .000 -.001
Notes:* reference category;€= euro. Source: Authors.
might expect migrants to be deliberately choosing a temporary contract and employment in sectors where they are more likely to lose their job and receive unemployment benefits. In reality, however, we know that it is mainly employers in particular sectors who choose to take on Eastern European labour migrants (Heyma, Bisschop and Biesenbeek, 2018) and in most cases to offer these workers temporary employment contracts (Ruhs and Anderson, 2010; Berkhout, Bisschop and Volkerink, 2014).
The small unexplained portion (around 10 per cent) of the difference can be ascribed to variables which were not included in our model, such as education level, discrimination on dismissal, family composition or illegitimate unemployment benefit claims. To what extent these and other variables are responsible for the unexplained portion cannot be determined based on our study. The findings reported in this article suggest two explanations. First, the difference in takeup of unemployment benefits between Eastern European labour migrants and Dutch natives is largely attributable to the characteristics included in the model, especially job characteristics such as the type of employment contract and working in temporary employment. Second, numerous unmeasured factors influence the unexplained portion. In concrete terms, this means that, while we cannot rule out the role of strategic behaviour, other factors are much more significant.
To place takeup of unemployment benefits in a broader perspective, in this study we also analysed the probability of becoming unemployed. Eastern European labour migrants in paid employment are four times as likely to lose their jobs as are native Dutch employees. Most of this difference is attributable to differences in job characteristics, underlining the vulnerable position of labour migrants on the labour market. If native Dutch workers had occupied the jobs taken, and then lost, by Eastern European migrants, their uptake of unemployment benefits would have been 9.2 percentage points higher.
While a relatively high proportion of Eastern European labour migrants have no work, relatively few of this unemployed group receive unemployment benefits (27 per cent compared with 36 per cent of non-working Dutch natives). This opposing effect may explain the confusion that sometimes exists regarding the takeup of unemployment benefits by labour migrants.
One limitation of our research method is that we interpret“no income from paid employment” as job loss, whereas the absence of wage income may also be due to a worker becoming self-employed or returning to their home country. This could overestimate the possibility of becoming unemployed and underestimate the probability of receiving benefits when becoming unemployed. Additionally, the takeup of Dutch unemployment benefits says nothing about the duration of those benefits or the total takeup of unemployment benefits by country of origin. Our intention is to investigate this in a follow-up study.
The results of our study have a number of potential implications for policy. The vulnerable labour market position of labour migrants leads to more frequent job loss and ultimately to a relatively greater takeup of unemployment benefits. This finding calls for an approach aimed at strengthening the labour market position of Eastern European labour migrants. Education and training focusing specifically on migrants could limit that vulnerability and contribute to helping workers tofind a new job on the Dutch labour market and ultimately reduce the rate of job losses. In addition, we conclude that the lower takeup of Dutch unemployment benefits by out-of-work labour migrants could indicate that they are not accessing the benefits system. As well as knowledge transfer via social networks, communication about arrangements pertaining to the labour market could be geared more effectively to labour migrants.
Bibliography
Barrett, A.; Maître, B.2013.“Immigrant welfare receipt across Europe”, inInternational Journal of Manpower, Vol. 34, No. 1.
Beer, P. de; Koster, F.2007.Voor elkaar of uit elkaar? Individualisering, globalisering en solidariteit. Amsterdam, Aksant.
Berkhout, E.; Bisschop, P.; Volkerink, M.2014.Grensoverschrijdend aanbod van personeel: Verschuivingen in nationaliteit en contractvormen op de Nederlandse arbeidsmarkt
2001-2011. Amsterdam, SEO Economisch Onderzoek.
Borjas, G. 1999. “Immigration and welfare magnets”, in Journal of Labor Economics,
Vol. 17, No. 4.
Dagevos, J.2011.Poolse migranten: de positie van Polen die vanaf 2004 in Nederland zijn komen wonen. The Hague, Sociaal en Cultureel Planbureau.
Dagevos, J.; Gijsberts, M.2013.“Beeldvorming over arbeidsmigranten uit Oost-Europa”, inCOB Burgerperspectieven, No. 4.
Eurofound. 2015. Social dimension of intra-EU mobility: Impact on public services.
Luxembourg, Publications Office of the European Union.
Gijsberts, M.; Lubbers, M.2013.Nieuw in Nederland: het leven van recent gemigreerde Bulgaren en Polen. The Hague, Sociaal en Cultureel Planbureau.
Guiaux, M.2016.“Naleving en gedrag offline klanten”, inUWV Kennisverslag,No. 9.
Guild, E.; Carrera, S.; Eisele, K.2013.Social benefits and migration: A contested relationship and policy challenge in the EU. Brussels, Centre for European Policy Studies.
Hernanz, V.; Malherbet, F.; Pellizzari, M.2004. Take-up of welfare benefits in OECD countries: A review of the evidence. Paris, Organisation for Economic Co-operation and Development.
Heyma, A.; Bisschop, P.; Biesenbeek, C.2018.De economische waarde van arbeidsmigranten uit Midden- en Oost-Europa voor Nederland. Amsterdam, SEO Economisch Onderzoek.
Huijnk, W.; Gijsberts, M.; Dagevos, J.2014.Jaarrapport integratie 2013: Participatie van migranten op de arbeidsmarkt. The Hague, Sociaal en Cultureel Planbureau.
Jann, B.2008.“The Blinder-Oaxaca decomposition for linear regression models”, inThe Stata Journal, Vol. 8, No. 4.
Merens, A.; Brakel, M. van den. 2014.Emancipatiemonitor 2014. The Hague, Sociaal en Cultureel Planbureau.
Nannestad, P.2007.“Immigration and welfare states: A survey of 15 years of research”, in
European Journal of Political Economy, Vol. 23, No. 2.
Pacolet, J.; De Wispelaere, F.2016.Aggregation of periods for unemployment benefits: Report on U1 portable documents for migrant workers–Reference year 2015. Brussels, European Commission.
Reesken, T.; Van Oorschot, W.2012.“Disentangling the‘new liberal dilemma’: On the relation between general welfare redistribution preferences and welfare chauvinism”, in
International Journal of Comparative Sociology,Vol. 53, No. 2.
Renema, J. 2018. “Knowledge about group’s welfare access among immigrants in the Netherlands”, inImmigrants’support for welfare spending: The causes and consequences of welfare usage and welfare knowledgeability (Doctoral thesis). Nijmegen, Radboud University Nijmegen.
Ruhs, M.; Anderson, B.2010.Who needs migrant workers? Labour shortage, immigration and public policy. Oxford, Oxford University Press.
Statistics Netherlands.2016.Jaarrapport integratie 2016. The Hague, Centraal Bureau voor de Statistiek.
Statistics Netherlands. 2018. Dashboard migrantenmonitor 2007–2016. The Hague, Centraal Bureau voor de Statistiek.
Strockmeijer, A.; De Beer, P.; Dagevos, J.2017.“Mobiliteit binnen de perken: zeer geringe
positieverbetering van werknemers uit Oost-Europa bij een langer werkverleden”, in
Tijdschrift voor Arbeidsvraagstukken, Vol. 33, No. 4.
Strockmeijer, A.; De Beer, P.; Dagevos, J.2019.“Should I stay or should I go? What we can learn from working patterns of Central and Eastern European labour migrants
about the nature of present-day migration”, in Journal of Ethnic and Migration
Studies, Vol. 45, No. 3.
Vrooman, C.(ed.). 2009. Werkloosheid in crisistijd.Baanverliezers, inkomensveranderingen en sociale gevolgen; een verkenning. The Hague, Sociaal en Cultureel Planbureau.
Werff, S. van der; Kroon, L.; Heyma, A.2016.Beslag uitkeringen personen inflexibele schil 2006-2014. Amsterdam, SEO Economisch Onderzoek.