IFPRI Discussion Paper 00760 March 2008
Gender Difference in the Long-Term Impact of Famine
Ren Mu, Texas A&M University
and
Xiaobo Zhang, International Food Policy Research Institute
Food Consumption and Nutrition Division and
INTERNATIONAL FOOD POLICY RESEARCH INSTITUTE
The International Food Policy Research Institute (IFPRI) was established in 1975. IFPRI is one of 15 agricultural research centers that receive principal funding from governments, private foundations, and international and regional organizations, most of which are members of the Consultative Group on International Agricultural Research (CGIAR).
FINANCIAL CONTRIBUTORS AND PARTNERS
IFPRI’s research, capacity strengthening, and communications work is made possible by its financial contributors and partners. IFPRI gratefully acknowledges the generous unrestricted funding from Australia, Canada, China, Finland, France, Germany, India, Ireland, Italy, Japan, Netherlands, Norway, Philippines, Sweden, Switzerland, United Kingdom, United States, and World Bank.
Published by
INTERNATIONAL FOOD POLICY RESEARCH INSTITUTE 2033 K Street, NW Washington, DC 20006-1002 USA Tel.: +1-202-862-5600 Fax: +1-202-467-4439 Email: ifpri@cgiar.org www.ifpri.org Notices
1 Effective January 2007, the Discussion Paper series within each division and the Director General’s Office of IFPRI were merged into one IFPRI–wide Discussion Paper series. The new series begins with number 00689, reflecting the prior publication of 688 discussion papers within the dispersed series. The earlier series are available on IFPRI’s website at www.ifpri.org/pubs/otherpubs.htm#dp.
2 IFPRI Discussion Papers contain preliminary material and research results. They have not been subject to formal external reviews managed by IFPRI’s Publications Review Committee but have been reviewed by at least one internal and/or external reviewer. They are circulated in order to stimulate discussion and critical comment.
Copyright 2008 International Food Policy Research Institute. All rights reserved. Sections of this material may be reproduced for personal and not-for-profit use without the express written permission of but with acknowledgment to IFPRI. To reproduce the material contained herein for profit or commercial use requires express written permission. To obtain permission, contact the Communications Division at ifpri-copyright@cgiar.org.
iii
Contents
Acknowledgments v
Abstract
vi
1. Introduction
1
2. Background
3
3. Conceptual Framework
5
4. Data and Descriptive Evidence
8
5. Results
13
6. Mortality Selection Bias
21
7. Conclusion
23
Appendix A: Data Sources
24
Appendix B: Proof of Four Propositions
25
Appendix C: Tables
27
iv
List of Tables
1. Impact of famine
14
2. Impact of famine severity
17
3. Impact of famine when excluding the birth years of 1959 and 1962: Two measures
17
4. County-fixed effect estimates of impact of famine using 1 percent 1990 census
individual data
19
5. Estimates of interaction effect of famine and ethnicity gender bias indicator
20
6. Contribution of mortality selection to observed gender difference in famine effects
22
C.1. Illiteracy rate, nonworking rate, and disability rate in rural China, by birth year and
gender
27
C.2. Index of education gender bias, by ethnicity
28
C.3. Birth and death rates from various sources
34
C.4. Sex ratios and ratio of male-to-female birth rates
35
List of Figures
1. Conceptual framework of the effects of famine
6
2. Sex ratio (male/female) for cohorts 1955-1966
8
3. Change in sex ratio vs. change in mortality rate (28 provinces)
9
4. Ratio of female-to-male disability rates in rural areas, by age in 2000
10
5. Ratio of female and male nonworking population shares in rural areas, by age
11
6. Ratio of female-to-male illiteracy rates in rural areas, by age in 2000
12
v
ACKNOWLEDGMENTS
The authors acknowledge the helpful comments received from Andrew Dillon, Gordon Liu, Zhehui Luo, Futoshi Yamauchi, and participants in a seminar held in Beijing University and the annual Chinese Economists Society meetings held in Changsha, China, July 27-30, 2007.
vi
ABSTRACT
An increasing literature examines the association between restricted fetal or early childhood growth and the incidence of diseases in adulthood. Little is known, however, about gender difference in this
association. We assess the impact of nutritional deficiency in the early lives of survivors of the Chinese Great Famine in terms of health and economic welfare, paying special attention to gender differences. We found evidence of several significant negative impacts for female⎯but not male⎯survivors, and the gender differences are statistically significant. Furthermore, we show that the selection bias caused by differences in mortality plausibly explains more than two-thirds of the documented gender difference in the long-term health of famine survivors.
1
1. INTRODUCTION
An expanding body of literature examines Barker’s proposed association between restricted fetal growth and the higher incidence of diseases in adulthood (Barker and Osmond 1986; Barker et al. 1989; Barker 1998; Godfrey and Barker 2000).1 Scholars in both epidemiology and economics are interested in how to evaluate this link in the absence of laboratory experiments. If confirmed, the link would justify health interventions for pregnant women and young children, especially those vulnerable to negative shocks. One common way to test the hypothesis is to make use of a quasi-natural experiment, such as a famine, epidemic, or weather shock, whose incidence occurred during gestation, and examine subsequent disease prevalence.
The possible challenge of the quasi-natural-experiment approach, however, is correctly measuring the true impact of fetal nutritional deficiency. The Barker hypothesis applies only to survivors; the
implicit assumption is that those exposed to the negative shock must have survived to a later life stage at which their health could be observed. However, because of mortality selection, the full sample of cohorts who were conceived during the quasi-natural experiment setting is not observed at their late life stages. Moreover, it is well documented that mortality selection differs by gender. For example, Sen (1981) records that the proportion of excess male mortality was 56 percent compared with 44 percent for their female counterparts in the 1943 West Bangle famine. Das Gupta and Li (1999) and Almond et al. (2007) show that the excess sex ratio dropped during the 1959–1961 Chinese Great Famine.2 Excess male mortality during the famine may result in male famine survivors being inherently healthier than males in other cohorts. Therefore, if there is a link between different levels of physiological response to reduced calories inutero (or in very early childhood) and adult health status, different survival rates may imply that the long-term impacts of famine are gender specific.
Despite the mortality selection problem associated with major shocks, most studies related to the Barker hypothesis do not emphasize the gender difference in survivorship. A few exceptions are Ravelli et al. (1999); Luo, Mu, and Zhang (2006); and Maccini and Yang (2006). These studies in general find negative health impacts only for women. Ravelli et al. show higher body mass indexes (BMIs) and waist circumferences in 50-year-old women who were exposed to the Dutch famine in the fetal stage, but the impact is insignificant for men. Luo, Mu, and Zhang compare cohorts born during the Chinese famine in the period 1959–1961 and soon afterward across severe and less severe famine-stricken regions. The researchers demonstrate that women born during the famine were more likely to be overweight in adulthood, but the trend was not noticeable in men. Maccini and Yang study the effects of weather conditions around the time of birth on the health, education, and socioeconomic welfare of Indonesian adults, showing that higher rainfall in early life has large positive effects on the adult outcomes for women but not men. Given the findings of these studies, the question we address in this paper is, why does the Barker hypothesis seem to apply only to women?
In our study, we use the Chinese Great Famine (1959–1961) as a quasi-natural experiment. We evaluate the long-term effects of hunger during gestation and very early childhood on adult health and economic outcomes, including disabilities, illiteracy, and labor force participation. In particular, with data from the 1990 and 2000 Chinese population censuses, we examine how these long-term effects differ between males and females. Consistent with the predictions of our model of gender-specific mortality selection, we found that female famine survivors had higher disability and illiteracy rates than do males; in fact, disability and illiteracy were not evident among male survivors. The results are robust to the test of alternative gender bias explanation.
We developed a novel approach to assess the magnitude of the measurement bias in the estimated famine effect caused by mortality selection. We found that the mortality selection effect accounts for
1 There is a large multidisciplinary literature on the link between health and economic outcome early and late in life. For detailed reviews, see Gluckman and Hanson (2006), Schultz (2007), and Strauss and Thomas (2008).
2 Das Gupta and Li (1999) attribute the drop in the excess sex ratio to the peak in the excess ratio among cohorts born just before the famine and to the excess male mortality during the famine.
2
about 70 percent of the total observed gender difference. In other words, the insignificant long-term effects on men were largely driven by their higher mortality attrition. Because sample selection resulting from mortality is a common problem in studies using shocks as quasi-natural experiments, the
methodology we developed can help to estimate the degree of such sample selection bias. Until very recently, the general literature concluded that parental treatment is the major contributing factor to observed gender differences. For example, Behrman (1988) reports bias against girls in the intrahousehold allocation of nutrition during lean seasons in India, and Rose (1999) shows that high rainfall narrows gender bias in infant mortality in India. Maccini and Yang (2006) conclude that their finding of gender difference in the impact of early childhood weather conditions is consistent with a gender bias model. Jayachandran (2006) also reports that postnatal smoke from massive wildfires in Indonesia in 1997 had more negative effects for girls than for boys, but the paper acknowledges that this finding could reflect physiological differences as well as gender bias in parental treatment. In a review article, Cox (2007) calls for more attention to the importance of biology in explaining gender differences. In this regard, the findings of our paper provide more supportive evidence on the role of biology in explaining gender differences in the outcomes examined.
The findings of this study have two important policy implications. First, given that the cohort born during the Great Famine period are now in their late forties, this study could be an initial step in assessing the disease burden and health-care needs of middle-aged people in China. In particular, higher disease prevalence in women relative to men has important implications in the equity concern in the provision of health insurance and care. Second, the findings of this study also imply that the relevant policy interventions in maternity health are not only beneficial to children’s health and the health of the adults they grow into but also helpful in the long run for gender equality in terms of health, economic, and social outcomes.
Section 2 of the paper provides a brief review of the epidemiology and economics literature related to the Barker hypothesis. We also present background information on the Chinese Great Famine. Section 3 lays out a conceptual framework about how different survival thresholds lead to different health distributions. Section 4 discusses data and provides descriptive evidence supporting the correlations between exposures to famine in early childhood and adult health and economic welfare. We test the long-term effects of famine on disability, nonworking rates, and illiteracy in Section 5. In Section 6, we further compute the contribution of mortality selection to the observed gender difference in the famine effect. Section 7 concludes the paper.
3
2. BACKGROUND
2.1. The Barker Hypothesis
The Barker hypothesis, also called the fetal origins hypothesis, postulates that when a fetus suffers malnutrition, the resulting stress can induce irreversible adaptations to the hunger environment that alter its permanent ability in later life to adjust to improved nutritional opportunities. In the long run, the maladaptation can lead to negative health outcomes in later stages of life (Barker and Osmond 1986; Barker et al. 1989; Barker 1998; Godfrey and Barker 2000).
Following the seminal work by Stein et al. (1975), most famine-based epidemiological studies of the Barker hypothesis use as a quasi-natural experiment the 1944–1945 Dutch winter when German army blockades precipitated a sharp decline in food availability. Drawing on retrospective cohort analyses, these studies generally conclude that the famine had a negative impact on various health outcomes. For example, prenatal exposure to famine is believed to be associated with antisocial personality disorder in early adulthood (Neugebauer, Hoek, and Susser 1999), major affective disorders (Brown et al. 2000), schizophrenia in adulthood (Hulshoff et al. 2000), higher BMI and waist circumference in 50-year-old women (Ravelli et al. 1999), and lower glucose tolerance in adults (Ravelli, van de Meulen, and Michels 1998).3
The general conclusions from recent economics literature also point to long-lasting negative impacts of shocks like famines, epidemics, and severe weather. For example, using the 1918 influenza pandemic in the United States as a quasi-natural experiment, Almond (2006) shows that in utero exposure to the disease has large negative effects on adult economic and health outcomes. Alderman, Hoddinott, and Kinsey (2004) link exposure to transitory shocks such as war and drought experienced by
Zimbabwean children before age three to their preschool nutritional status. The researchers further trace the consequences of these early shocks to the subjects’ subsequent health and education as young adults. Droughts are also found to have negative effects on children’s growth (Hoddinott and Kinsey 2000). Akresh, Verwimp, and Bundervoet (2007) show that stresses at birth, such as civil conflict and crop failure in Rwanda, led to worse health outcomes several years after the shock. Banerjee et al. (2007) found that a large income shock caused by phylloxera (an insect that attacks the root of vines) in 19th-century France reduced the height of the affected male cohort born in the shock period by 0.6 to 0.9 centimeters but had no impact on other health outcome variables.4
The estimated impacts in the studies cited here are conditional on survival. Given that shocks may affect the likelihood of survival, the unconditional impacts could be larger than the conditional ones. 2.2. The Chinese Great Famine
Despite its prominence in epidemiological studies, the Dutch winter famine had shorter duration and lower mortality than did the Great Famine in China. Estimated excess deaths for the Great Famine range between 20 million and 30 million (Johnson 1998). Regional distribution of the famine was also highly uneven. The highest mortality during 1959–1962 relative to the average mortality before the famine in 1956–1958 ranged from 14.9 percent in Tianjin to 474.9 percent in Anhui Province (Yang 1996). In addition, because of the pro-urban food supply policy, urban areas suffered much less from famine than did rural areas (Lin and Yang 2000).
Many studies on the Great Famine focus on identifying the causes of the catastrophic human tragedy. Researchers trace the famine to various factors, including excessive food consumption in collective dining halls (Chang and Wen 1998; Yang 1996; Yang and Su 1998), lower production incentives resulting from the denial of the right to withdraw from collectives (Lin 1990), preferential
3 However, in a study based on a small sample of survivors (fewer than 600) of the Leningrad siege of 1941–1944, Stanner et al. (1997) found that malnutrition in utero is not linked to diabetes and coronary heart disease in adulthood.
4
supplies of food to cities and favoritism of industry over agriculture during the period (Lin and Yang 2000), disastrous weather, and a possible mix of all these factors (Li and Yang 2005). Overall, however, a famine can be viewed as a tragic magnification of market and government failures (Ravallion 1997), and the Great Famine was no exception. The policies adopted during the Great Leap period are believed to be a primary factor contributing to the catastrophe (Johnson 1998; Li and Yang 2005).
Although these studies contribute to understanding the causes of this human tragedy, increasing data availability on cohorts affected by the Great Famine have permitted analysis of its long-term consequences to human capital. St. Clair et al. (2005) investigate psychiatric case records in a mental hospital in Wuhu, Anhui Province, one of the regions stricken most severely by the famine. The study shows that children born during the famine were twice as likely to develop schizophrenia, confirming a link between nutritional deficiency and the mental illness. By restricting the Chinese Health and Nutrition Survey (CHNS) data to the “family unit” of a mother, a father, and at least one child, Gørgens, Meng, and Vaithianathan (2007) found significant stunting of growth in those exposed to the famine. They used the height of the second generation to control for selection bias caused by mortality.5 From aggregated pregnancy history data, Cai and Wang (2005) found evidence that the Great Famine resulted in elevated risks of miscarriage and stillbirth. Meng and Qian (2006) merged the 1990 China population census with the 1989 CHNS at the county level and used the surviving population in the county as a proxy for famine severity. They found negative impacts of famine exposure on some health, education, and labor market outcomes. Using the same CHNS data, Chen and Zhou (2007) determined that famine suppressed the growth of adult height, on average, by 3.4 centimeters. Almond et al. (2007) also found negative long-term effect of famine on a range of socioeconomic outcomes by comparing the famine cohort in Hong Kong to that in Mainland China. Based on CHNS data, Luo, Mu, and Zhang (2006) report the gender difference in the long-term impact of the famine on body mass index: female survivors were more likely to be overweight, but that was not the case for men. Because CHNS data have a small sample cohort size and cover only seven provinces, our paper makes a contribution in studying the gender differences by using different sets of data that are more representative.
5 Gørgens, Meng, and Vaithianathan (2007) used cohorts born between 1948 and 1961 as the famine cohort and cohorts born between 1938 and 1948 and between 1961 and 1971 as control cohorts.
5
3. CONCEPTUAL FRAMEWORK
The conceptual framework of Almond (2006) is used in this paper to illustrate the impact of famine. That model introduces two channels by which negative shocks could increase infant mortality and negatively affect the subsequent health of cohort survivors. First, famine reduces survival thresholds conditional on health, thereby increasing mortality rates. Second, a negative shift in the health distribution as a result of the shock could also lead to higher mortality rates. We call the first channel the “selection effect” and the second channel the “distribution effect.” We extended the model by explicitly allowing gender difference in the survival thresholds, showing that the difference in survival would lead to differences in the
selection effect and the distribution effect.
We assumed that the accumulative function of population health is defined as F(x; μ), where x is the unobserved underlying health and μ is the parameter of mean in the distribution. We further assumed that F(x; μ) has the first and second derivatives with respect to x and μ and satisfies the following properties: (i)
(
;
)
>
0
∂
∂
x
x
F
μ
and(
;
)
<
0
.
∂
∂
μ
μ
x
F
(ii) 2(
2;
)
>
0
∂
∂
x
x
F
μ
when x < μ. (iii) ( ; ) 0 2 < ∂ ∂ ∂μ
μ
x x F when x < μ.These properties hold for normal distributions ( F(x;μ) = Φ(x - μ) ) and more generally for the location family when F(x;μ) = G(x - μ) and there is a single module.
Figure 1 shows how famine can affect the density function. We define distribution function before and after the famine as f0 = f(x; μ0) and f1 = f(x; μ1). Famine alters the health of survivors in two ways. First, famine moves the survival threshold from s0 to s1. Infants born during famine with relatively poor health (independent of famine) are less likely to survive than are infants born during normal times. This is the selection effect of the famine. Second, famine decreases the overall health of the infants born in the period. This effect shifts the underlying health distribution function to the left, from f0 to f1 (the parameters of the means from μ0 to μ1), as shown in Figure 1. This is the distribution effect. If adult health is a monotonic transformation of infant health,6 the proportion of adults who are not in good health (good health threshold is denoted byg) is
)
;
(
1
)
;
(
)
;
(
)
,
,
(
μ
μ
μ
μ
s
F
s
F
g
F
g
s
P
−
−
=
. (1)When a famine (whose severity is denoted by h) strikes, both μ and s are affected—that is, d
dh
μ
< 0 and
dh
ds
> 0. The long-term health impact of exposure to famine can then be measured by the change in this proportion:
6 In line with the Barker hypothesis, we assume that adult health is preconditioned in part by biological shocks that affect future health outcomes.
6
dh
ds
s
g
s
P
dh
d
g
s
P
dh
g
s
dP
∂
∂
+
∂
∂
=
(
,
,
)
(
,
,
)
)
,
,
(
μ
μ
μ
μ
μ
. (2) The first term on the right side of equation (2) measures the distribution effect, holding the survivalthreshold constant, while the second term defines the selection effect by holding the distribution constant.
Figure 1. Conceptual framework of the effects of famine
g
Note: f is a density function.
Assuming
s
≤
g
<
μ
and using properties (i) through (iii) gave us the following four propositions. Proofs for these propositions are provided in Appendix B.( , , )
0
P
s g d
dh
μ
μ
μ
∂
>
∂
. (3)Proposition 1: If a famine shifts the health distribution leftward, the proportion of people in poor health increases.
0
)
,
,
(
<
∂
∂
dh
ds
s
g
s
P
μ
. (4) Proposition 2: If the survival threshold increases as a result of either famine or other shocks, theproportion of people with poor health in the total surviving population decreases.
Further, if female infants have a lower survival threshold than their male counterparts (0<sf <sm),7 we have a third proposition:
μ μ μ μ ∂ ∂ > ∂ ∂P( ,sm,g) P( ,sf,g). (5)
7 The medical literature (for example, Jakobovits 1991) reports that male fetuses are less physiologically robust than female fetuses, and the spontaneous abortion rate is higher for male than for female fetuses in the second trimester.
distribution effect selection effect 1 0
s
s
)
;
(
1 1x
f
μ
f
0(
x
;
μ
0)
s7
Proposition 3: If a famine decreases the general health of a population (dμ < 0), with the same
shift inμ, the distribution effect on men’s disability rate is higher than that on women’s.
It also follows that
s g s P s g s P m f ∂ ∂ < ∂ ∂ (μ, , ) (μ, , ) . (6) Proposition 4: Given the same change in the survival threshold during the famine, men with a
higher initial threshold experience a smaller negative effect than women.
Under the assumption that females have a higher initial threshold, the distribution effect would lead to a larger negative effect for male survivors, but the selection effect would result in a larger negative effect for female survivors. Given the different predictions of these two effects, it is possible to
empirically separate them.
Both the epidemiological and economics literatures have provided evidence for the impact of fetus development and early childhood nutritional condition on adult cognitive and productive capacities (Schultz 2007). The model used in this study can also be appropriately modified and applied to study outcomes such as education achievements and labor participation rates.
8
4. DATA AND DESCRIPTIVE EVIDENCE
In this section, we present some descriptive evidence of gender-specific long-term impacts, using data from the 2000 China population census and the 1998 China agricultural census. Both data sources provide provincial-level aggregate information. Figure 2 plots the male-to-female sex ratios in urban and rural areas by age cohort using the 2000 China population census (see Appendix A for descriptive summaries). In rural areas, the sex ratio for the 1961 birth cohort was 100.3, dropping substantially from 109.6 for the 1958 cohort (the prefamine year cohort), and increased to 103.9 for the 1962 cohort. The observed dip in rural areas in 1961, the severest year of the Chinese Great Famine, suggests that male mortality exceeded female mortality during the famine period.
Figure 2. Sex ratio (male/female) for cohorts 1955-1966
99 10 1 10 3 10 5 10 7 10 9 11 1 11 3 11 5 Se x ra tio 1955 1956 1957 1958 1959 1960 1961 1962 1963 1964 1965 1966 Birth year Urban Rural
Source: 2000 China population census
Note: Famine cohort was born during 1959-1961 with 1961 as the severest year.
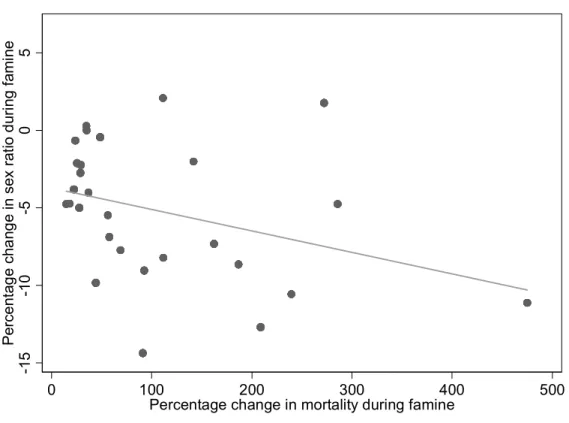
Figure 3 graphs sex ratio changes in 1961 relative to control years against the excess mortality during the famine, a measure of famine severity, in 28 provinces where data are available. The fitted line shows that provinces with more excess mortality experienced a larger drop in the male-to-female sex ratio. When we ran a regression of mortality change on famine severity, we found a significant coefficient of –0.0138 with t = –2.13. It suggests that gender difference in mortality selection is aggravated by famine severity. Figures 2 and 3 both suggest that famine has a greater negative impact on men than on women in terms of survival.
9
Figure 3. Change in sex ratio vs. change in mortality rate (28 provinces)
-1 5 -1 0 -5 0 5 P er ce nt age c han ge in s ex r at io du rin g fa m in e 0 100 200 300 400 500
Percentage change in mortality during famine Source: 2000 China population census
Notes: Sex ratio change is defined as the change in sex ratio between 1961 and the average sex ratio in 1956–1958 as a percentage of the average sex ratio in 1956–1958. Similarly, change in mortality rate is defined as the change in mortality rate from the average level in 1956–1958 to the mortality rate in 1961 as the percentage of the average level. Famine cohort was born during 1959-1961 with 196.
Based on the information of disability in the 2000 China population census,8 we calculated the disability rates for men and women separately for each age group. Figure 4 plots the ratio of female-to-male disability rates by birth year in rural areas. It is apparent from the figure that the fefemale-to-male disability rate was substantially higher for those born in 1960 and 1961 compared with the corresponding male disability rate. For each disabled man in the 1960 and 1961 birth cohorts, there were 0.74 disabled women in the same cohort. For the prefamine cohort in 1958, however, there were only 0.64 disabled women for each disabled man, whereas for the postfamine cohort in 1962, the number was 0.65. The evidence suggests that compared with other birth cohorts, female famine survivors suffered more disabilities than their male counterparts.
10
Figure 4. Ratio of female-to-male disability rates in rural areas, by age in 2000
.5 5 .6 .6 5 .7 .7 5 R at io o f f e m al e/ m al e d is a bi lit y r at es 1955 1956 1957 1958 1959 1960 1961 1962 1963 1964 1965 1966 Birth year
Source: 2000 China population census
Note: Famine cohort was born during 1959-1961 with the 1961 as the severest year.
Drawing on the 1998 China agricultural census as well as the 2000 China population census, we calculated the proportion of the nonworking population at each age cohort by gender. Figure 5 presents the ratio of the female-to-male nonworking population in rural areas by year of birth using the two data sources. The data sources provide very similar patterns, especially for the famine and postfamine cohorts. The ratio of female-to-male nonworking Chinese peaked in 1961 according to both data sources. Using the census data, we found that the ratio was 5.5 in 1961, compared with 4.9 for the prefamine cohort of 1958 and 5.0 for the postfamine cohort of 1962. The highest ratio in 1961 suggests a negative impact of famine on female employment status relative to male employment status.
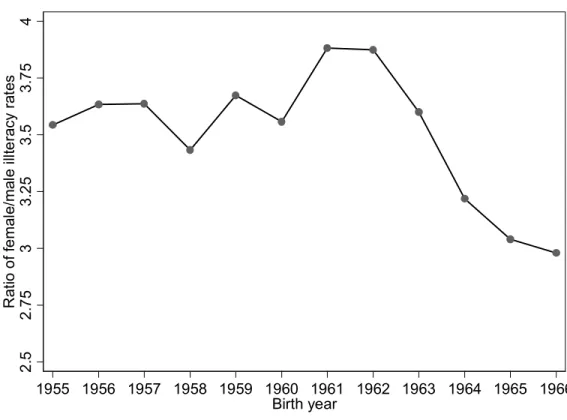
Another outcome we examined was the education achievement measured by adult illiteracy.9 Figure 6 shows the ratio of female-to-male illiteracy rates in rural areas by year of birth. For rural Chinese born in 1961 and 1962, a female’s relative likelihood of being illiterate is 3.9, much higher than the prefamine level of 3.4 for those born in 1958.
These figures provide descriptive evidence that the long-term impact of childhood famine exposure is gender specific. In the next section, we conduct a more rigorous quantitative analysis by making use of large regional variation in famine severity to further test the Barker hypothesis.
9 We also examined as an outcome the calculated years of schooling. The gender difference remains. However, the results on years of schooling may be confounded with the difference in the relative school capacity for famine cohorts and pre- and postfamine cohorts. At least in the short run, the capacity of secondary and tertiary schools in rural China is fixed. Being noticeably smaller, the famine cohort may have enjoyed a larger chance of being enrolled in postsecondary schools, and as a result, higher years of schooling. Capacity is less of an issue for primary schools because they were rather widespread even in rural China. Thus, the illiteracy rate is a measure that is less contaminated by the supply factor.
11
Figure 5. Ratio of female and male nonworking population shares in rural areas, by age
4 5 6 7 1955 1957 1959 1961 1963 1965 Birth year Rat io of f em al e/ m al e nonw or ki ng popul at ion s har es
Source: 1998 China agricultural census
4. 6 4. 8 5 5. 2 5. 4 5. 6 Ra tio of fem a le /m a le no nw or ki ng r a te s 1955 1956 1957 1958 1959 1960 1961 1962 1963 1964 1965 1966 Birth Year
Source: 2000 China population census
12
Figure 6. Ratio of female-to-male illiteracy rates in rural areas, by age in 2000
2. 5 2. 75 3 3. 2 5 3. 5 3. 7 5 4 Ra tio of fe m ale /m al e il lter ac y r ate s 1955 1956 1957 1958 1959 1960 1961 1962 1963 1964 1965 1966 Birth year
Source: 2000 China population census
13
5. RESULTS
Using the panel dimension of the population cohort data at the provincial level, we analyzed cohorts born between 1950 and 1970 and 30-to-50-year-olds by the 2000 census. We estimated the following
regression separately for men and women:
cij i j j j c
cij Famine age age age
Y =
α
+α
+α
+α
+α
3+α5D +ε
4 2 3 2 1 0 , (7)where Ycij is the outcome for cohort c in province i at age j. We used two alternative measures of famine: a famine cohort dummy and famine severity, which we define shortly. We also included in the regression age and polynomials of age to capture the underlying relationship between the outcome variables of age and health.10 If the impact of famine deviated greatly from the trend as predicted by the flexible age function, we expected that it would be captured by the coefficient on the famine variable. However, considering that famine causes excess mortality, the real causal effect was underestimated by this coefficient when we ignored mortality selection. The province dummy variables D were included to account for provincial variations that might be correlated with outcome variables as well as the cohort differences. The idiosyncratic error term is εcij.
5.1. Main Results
Table 1 shows the regression results for the disability rate, nonworking rate, and illiteracy rate. A famine dummy variable was defined as 1 for the birth years of 1959 through 1961 and 0 for others. Provincial dummies were included in all estimations but not reported here. Because province sizes vary greatly by population, we used rural gender-specific provincial population as weight in the regressions. Standard errors in the regressions were corrected for serial correlation within province and arbitrary
heteroscedasticity. For each outcome, the first column reports results for females and the second for males. We used two specifications to test gender difference: the female-to-male ratio of the outcome variables and the difference between the coefficients on famine across female and male populations (the third and fourth columns, respectively, under each outcome heading).
14
Table 1. Impact of famine
Disability rate Nonworking rate Illiteracy rate
Female (1) Male (2) Ratio (1) – (2) Female (1) Male (2) Ratio (1) – (2)
Female (1) Male (2) Ratio (1) – (2) Famine 0.489 -0.176 0.100 0.665 0.079 0.06 0.081 0.019 0.471 0.107 0.227 0.364 (4.36)*** (2.22)** (4.81)*** (6.18)*** (1.06) (1.77)* (1.22) (0.25) (2.91)*** (1.36) (3.90)*** (3.42)*** Age 8.142 6.073 0.136 2.069 5.358 2.979 -3.136 2.378 -8.539 -0.874 -1.121 -7.665 (8.36)*** (5.64)*** (1.66) (2.68)** (7.05)*** (6.46)*** (5.19)*** (3.32)*** (4.43)*** (1.62) (1.33) (4.89)*** Age2/100 -0.228 -0.168 -0.005 -0.061 -0.173 -0.084 0.08 -0.088 0.201 0.011 0.039 0.19 (8.76)*** (5.98)*** (2.13)** (2.94)*** (7.80)*** (6.76)*** (5.11)*** (4.61)*** (4.06)*** (0.83) (1.84)* (4.62)*** Age3/1000 0.213 0.156 0.005 0.057 0.179 0.079 -0.067 0.100 -0.140 0.004 -0.039 -0.144 (9.23)*** (6.45)*** (2.67)** (3.16)*** (8.22)*** (7.03)*** (4.99)*** (5.69)*** (3.43)*** (0.34) (2.33)** (4.16)*** Observations 651 651 651 651 651 651 651 651 651 Adjusted R2 0.798 0.833 0.530 0.966 0.911 0.957 0.926 0.901 0.775
Notes: The regressions are based on the 2000 China population census. Robust t-statistics (corrected for serial correlation within province and arbitrary heteroscedasticity) are in parentheses. * Significant at 10 percent, ** significant at 5 percent, *** significant at 1 percent. The famine is a dummy variable equal to 1 for the age cohort of 1959–1961 and 0 for other birth years. Birth cohorts from 1950–1970 (inclusive) are included in the analysis. Province dummies are included in the regressions. Ratio is outcome for female over outcome for male. Regressions are weighted by rural gender-specific provincial population weights. Thirty-one provinces are included in the analysis.
15
As shown in Table 1, the coefficient for the famine variable in the first regression on the female disability rate is significant and positive, whereas it is negative for the male disability rate. The coefficient on the famine dummy is 0.489 (t = 4.36). Compared with nonfamine cohorts, women who were born during the famine and survived have a higher chance (0.489 basis points) of being disabled. This magnitude is not trivial, given that the average disability rate is about four basis points. The finding indicates that female famine survivors are more susceptible to the distribution effects, given their lower level of excess mortality compared with their male counterparts. The result for female survivors is more consistent with the prediction of Proposition 1. In contrast, the famine dummy has a negative and significant coefficient for males, suggesting a positive selection for male survivors. In light of more serious mortality selection for male famine survivors, it seems that the selection effect dominates the distribution effect, as predicted by Proposition 2 in our model.
The gender difference in the famine impact, either measured by the difference of the coefficients for the famine variable (0.665, with t = 6.18) or the coefficient for the female-to-male ratio (0.1, with t = 4.81), turns out to be significant at the 1 percent level. These results suggest that women with an exposure to famine at an early age are more likely to be disabled in adulthood than are their male counterparts. This lends more support to Proposition 4, that a greater excess mortality selection of male population causes the observed gender difference in the famine effects.
We found no evidence that female famine survivors have higher nonworking rates than do women in other cohorts. Even though the coefficient on the famine dummy is positive and marginally significant for males, the magnitude of the famine dummy is larger for females than for males. A gender difference is also not evident for nonworking rates. The smaller famine cohort indicates a limited labor supply. It is likely that labor markets place a premium on this age cohort, thereby offsetting the negative impact of famine on labor participation.
The results for illiteracy rates shown in Table 1 indicate that the famine female cohort is associated with a 0.471-point-per-thousand higher illiteracy rate, which is statistically significant. We found no evidence of famine impact on the illiteracy rate of males. Moreover, the gender difference is pronounced and statistically significant: the famine coefficient on the ratio of the female-to-male illiteracy rate is 0.227 (t = 3.90), and the difference between the famine coefficient across females and males is 0.364 (t = 3.42). Once again it seems that women are more vulnerable to the distribution effects of famine, whereas for men, mortality selection plays the stronger role.
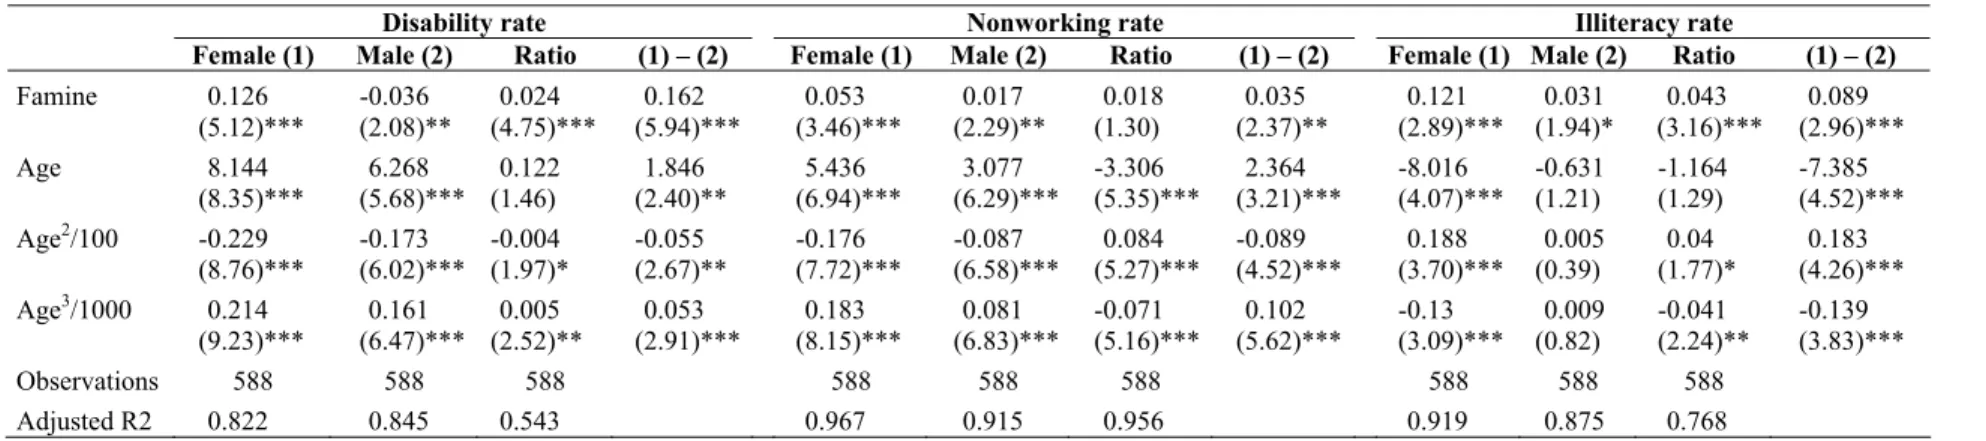
To cross-reference the robustness of the results with the definition of the famine variable, we replaced the famine variable shown in Table 1 with the alternative famine severity measure shown in Table 2. We defined the new famine variable as the change in mortality from the average level in 1956– 1958 to the highest value over the period 1959–1962, based on mortality data by province in Yang (1996, 38). Consistent with the results shown in Table 1, coefficients for the famine variable in regressions on disability rate and illiteracy rate are significantly higher for the famine cohort among women than among men. In addition, the gender difference in the nonworking rate becomes significant at 5 percent using the alterative famine measure.
Strictly speaking, the results in Tables 1 and 2 test the effects of poor nutrition during early childhood, not in utero. Because the famine lasted from 1959 through late 1961, some survivors born in early 1959 may not have had prenatal exposure to the famine. Moreover, people who were born in early 1962 (in the nonfamine cohort) may have been exposed to famine in utero. To directly test the Barker hypothesis, we dropped 1959 and 1962 from the sample and repeated the analyses in Tables 1 and 2. Table 3 reports only the coefficients of interest for the two famine variables. In the top panel, the famine dummy variable is 1 for the birth years of 1960 and 1961 and 0 for other birth years. The bottom panel mirrors the analysis in Table 2 using famine severity as a measure.
The major results from Table 3 are consistent with those in Tables 1 and 2. For the disability rate, the gender difference for the famine variables is highly significant, and its magnitude is more pronounced than that shown in Tables 1 and 2. Regarding the illiteracy rate, the coefficient for both specifications with different famine variables for the female sample is significant at the 5 percent level but insignificant for the male sample. The coefficients in the regressions on gender ratio and difference are significant at 1
16
percent and 5 percent, respectively, for both famine variables. Overall, the significant gender difference based on the reduced sample provides further support for the existence of selection bias for men and the substantial effect of exposure to famine in utero and in infancy on adult women’s human capital
outcomes.
5.2. Robust Checks
One alternative explanation for the results reported in the previous section points to migration selection. Such selection has to be gender cohort-specific to cause the observed gender difference in famine effects. It is true that at any given age, men are more likely to migrate than are women. However, the gender difference in migration is not cohort-specific but exists across a range of age groups. Moreover, if
migration selection existed only in the famine cohort, we would have underestimated the famine impacts. The reason for the possible underestimation is that migrants are a positively selected group in terms of health and education outcomes, and the gender difference in those outcomes for the ones remaining in rural areas would be smaller, the opposite of our finding. Further, according to the 2000 China population census, only 2.68 percent of the rural population lived in provinces other than their birthplaces. Therefore, intraprovince migration (typically resulting from marriage) leading to measurement error in the coding of birthplace should not be a concern.
17
Table 2. Impact of famine severity
Disability rate Nonworking rate Illiteracy rate
Female (1) Male (2) Ratio (1) – (2) Female (1) Male (2) Ratio (1) – (2) Female (1) Male (2) Ratio (1) – (2)
Famine 0.126 -0.036 0.024 0.162 0.053 0.017 0.018 0.035 0.121 0.031 0.043 0.089 (5.12)*** (2.08)** (4.75)*** (5.94)*** (3.46)*** (2.29)** (1.30) (2.37)** (2.89)*** (1.94)* (3.16)*** (2.96)*** Age 8.144 6.268 0.122 1.846 5.436 3.077 -3.306 2.364 -8.016 -0.631 -1.164 -7.385 (8.35)*** (5.68)*** (1.46) (2.40)** (6.94)*** (6.29)*** (5.35)*** (3.21)*** (4.07)*** (1.21) (1.29) (4.52)*** Age2/100 -0.229 -0.173 -0.004 -0.055 -0.176 -0.087 0.084 -0.089 0.188 0.005 0.04 0.183 (8.76)*** (6.02)*** (1.97)* (2.67)** (7.72)*** (6.58)*** (5.27)*** (4.52)*** (3.70)*** (0.39) (1.77)* (4.26)*** Age3/1000 0.214 0.161 0.005 0.053 0.183 0.081 -0.071 0.102 -0.13 0.009 -0.041 -0.139 (9.23)*** (6.47)*** (2.52)** (2.91)*** (8.15)*** (6.83)*** (5.16)*** (5.62)*** (3.09)*** (0.82) (2.24)** (3.83)*** Observations 588 588 588 588 588 588 588 588 588 Adjusted R2 0.822 0.845 0.543 0.967 0.915 0.956 0.919 0.875 0.768
Notes: The regressions are based on the 2000 China population census. Robust t-statistics (corrected for serial correlation within province and arbitrary heteroscedasticity) are in parentheses. * Significant at 10 percent, ** significant at 5 percent, *** significant at 1 percent. Famine severity is defined as the percentage change in mortality from the average level in 1956-1958 to the highest value over the period of 1959-1962, based on mortality data by province in Yang (1996, p. 38). Birth cohorts from 1950–1970 (inclusive) are included in the analysis. Province dummies are included in the regressions. Ratio is outcome for female over outcome for male. Regressions are weighted by rural gender-specific provincial population weights. Twenty-eight provinces with information on famine severity are included in the analysis. Chongqing, Hainan, and Tibet are not included because Yang (1996) does not report the famine severity in those provinces. As a result, the total number of observations is less than that in Table 1.
Table 3. Impact of famine when excluding the birth years of 1959 and 1962: Two measures
Disability rate Nonworking rate Illiteracy rate
Female (1) Male (2) Ratio (1) – (2) Female (1) Male (2) Ratio (1) – (2) Female (1) Male (2) Ratio (1) – (2)
Famine 0.626 -0.198 0.125 0.686 0.015 0.056 0.056 -0.041 0.373 0.026 0.367 0.347 (4.44)*** (2.03)* (4.19)*** (5.03)*** (0.15) (1.23) (0.76) (0.43) (2.12)** (0.30) (5.93)*** (2.87)*** Famine severity 0.157 -0.034 0.030 0.160 0.045 0.017 0.016 0.028 0.100 0.013 0.075 0.087 (4.96)*** (1.53) (4.02)*** (4.73)*** (2.28)** (1.64) (1.05) (1.57) (2.29)** (0.71) (4.97)*** (2.60)**
Notes: The regressions are based on the 2000 China population census. Robust t-statistics (corrected for serial correlation within province and arbitrary heteroscedasticity) are in parentheses. * Significant at 10 percent, ** significant at 5 percent, *** significant at 1 percent. The first famine is taken from Table 1. The famine severity variable is the same as defined in Table 2. Birth cohorts from 1950–1958, 1961, and 1963-1970 (inclusive) are included in the analysis. The birth years of 1959 and 1962 are dropped. Province dummies are included in the regressions. Ratio is outcome for female over outcome for male. Regressions are weighted by rural gender-specific provincial population weights.
18
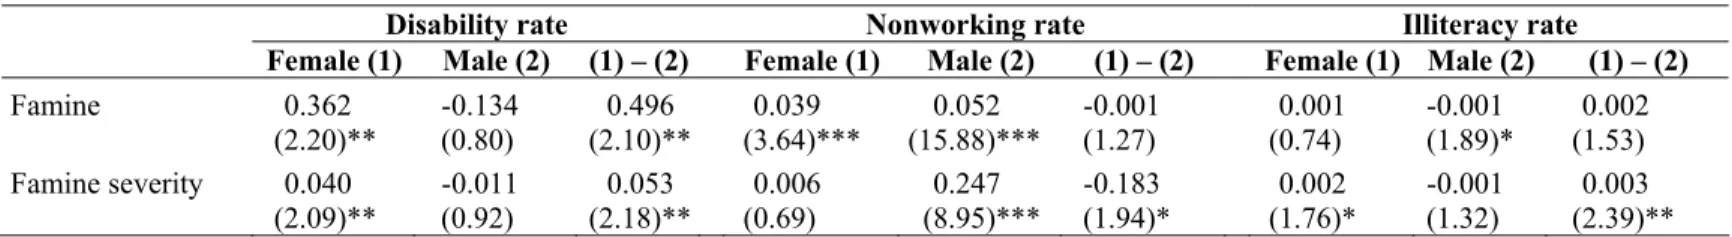
Nonetheless, to check the robustness of the results, we also used data from the 1 percent sample of the 1990 China population census.11 Migration was much less active in 1990 than in 2000. Using two alternative famine variables, we ran two sets of regressions on the three outcome variables, which include county-fixed effects. The first row in Table 4 shows the regression results for the famine variable defined as in Table 1. The coefficient in the first regression for females (column 1) is significant and negative, whereas the coefficient in the second regression for males is negative but insignificant, which is consistent with the findings from the 2000 census. The magnitude of the estimates is slightly smaller compared with that shown in Table 1. The difference probably reflects the cohorts being 10 years younger in 1990 and the long-term negative health effect not having fully emerged. It should be noted that the gender difference becomes insignificant for the illiteracy rate, as shown in the last column of Table 4. This may be a result of the different definitions of “illiteracy rate” in the 1990 and 2000 censuses. In the 1990 census, we could not separate full illiteracy from semi-illiteracy, whereas in the 2000 census, full illiteracy was used to calculate the illiteracy rate.
The second row of Table 4 presents the estimations based on the famine severity variable as defined in Table 2. The coefficients for the famine variable in the regressions on disability rate and illiteracy rate are also consistent with the findings in Table 2.
Another alternative explanation is that the observed gender difference in famine effects is caused by gender bias, primarily manifested by greater parental discrimination against girls than against boys. Given that our specification embodies a single difference between famine and nonfamine cohorts, for the gender bias hypothesis to hold, it must be true that discrimination against girls is more severe during the famine period than in nonfamine times.
11 China Population and Information Research Center, 1% Sample of the 1990 China Population Census Data, accessed from the Texas A&M University China Archive at
19
Table 4. County-fixed effect estimates of impact of famine using 1 percent 1990 census individual data
Disability rate Nonworking rate Illiteracy rate
Female (1) Male (2) (1) – (2) Female (1) Male (2) (1) – (2) Female (1) Male (2) (1) – (2)
Famine 0.362 -0.134 0.496 0.039 0.052 -0.001 0.001 -0.001 0.002
(2.20)** (0.80) (2.10)** (3.64)*** (15.88)*** (1.27) (0.74) (1.89)* (1.53) Famine severity 0.040 -0.011 0.053 0.006 0.247 -0.183 0.002 -0.001 0.003
(2.09)** (0.92) (2.18)** (0.69) (8.95)*** (1.94)* (1.76)* (1.32) (2.39)**
Notes: The regressions are based on the 2000 China population census. Robust t-statistics (corrected for serial correlation within province and arbitrary heteroscedasticity) are in parentheses. * Significant at 10 percent, ** significant at 5 percent, *** significant at 1 percent. The famine is a dummy variable equal to 1 for the age cohort of 1959-1961 and 0 for other birth years. Birth cohorts from 1950–1970 (inclusive) are included in the analysis. County-fixed effects are included in the regressions. Five hundred ninety-eight counties are included in the analysis. The definition of famine and famine severity correspond to those in Tables 1 and 2, respectively.
20
Ideally, we would need an exclusive restriction that affects gender bias but not mortality selection to disentangle the gender bias from mortality selection bias. Given the data limitation, we chose to
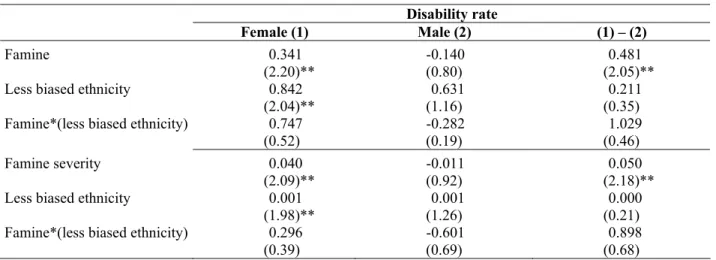
explore the potential differences among ethnicity groups in terms of their value of boys versus girls. China has 56 ethnic groups, with the majority ethnicity being Han. To measure gender bias, we focused on education outcomes, because the gender difference in educational level largely captures the gender bias. Thus, we created a gender bias index by ethnicity based on the 2000 China population census, as shown in Appendix Table C.2. The average gender bias index is 4.5, and we defined ethnic groups with a gender bias index less than 3 as “less biased ethnicity.” In the next step, we ran the same regressions as shown in Table 4 but added the less biased ethnicity variable and its interaction with the famine variable. If gender bias is the cause for observed gender difference, then we would expect the famine effect to differ among ethnicities with different degrees of gender bias. In other words, we would expect a positive and significant coefficient on the interaction term. However, the results shown in Table 5 indicate that no clear difference exists between the ethnic groups with different levels of gender bias. Therefore, we conclude that gender bias is unlikely to be the cause of the observed gender difference.
Table 5. Estimates of interaction effect of famine and ethnicity gender bias indicator
Disability rate
Female (1) Male (2) (1) – (2)
Famine 0.341 -0.140 0.481
(2.20)** (0.80) (2.05)**
Less biased ethnicity 0.842 0.631 0.211
(2.04)** (1.16) (0.35)
Famine*(less biased ethnicity) 0.747 -0.282 1.029
(0.52) (0.19) (0.46)
Famine severity 0.040 -0.011 0.050
(2.09)** (0.92) (2.18)**
Less biased ethnicity 0.001 0.001 0.000
(1.98)** (1.26) (0.21)
Famine*(less biased ethnicity) 0.296 -0.601 0.898
(0.39) (0.69) (0.68)
Notes: The regressions are based on the 1 percent sample of the 1990 China population census. The famine and famine severity variables follow the definitions in Tables 1 and 2, respectively. Ethnic groups with gender bias (Appendix Table C.2) less than 3 are defined as “less biased ethnicity.” * Significant at 10 percent, ** significant at 5 percent, *** significant at 1 percent.
The third concern is that different access to health care between genders may be the cause. In rural China, access to health care may vary across regions, but there is no evidence that it is gender-specific, and there is no reason to believe gender-specific access occurs only to famine cohorts. Other shocks, such as the Cultural Revolution, have also affected most of the cohorts in our analysis,12 but we do not expect the impact of this shock to be gender-specific only to the famine cohort.
21
6. MORTALITY SELECTION BIAS
Having shown the existence of gender difference in the long-term impact of famine, in this section we investigate how much of it can be explained by the underlying gender difference in mortality selection.
It follows from Proposition 4 that
)
;
(
1
)
;
(
)
;
(
1
1
)
;
(
)
,
,
(
μ
μ
μ
μ
μ
s
F
s
F
s
F
g
F
g
s
P
−
Δ
⋅
−
−
=
Δ
=)
;
(
1
)
;
(
))
,
,
(
1
(
μ
μ
μ
s
F
s
F
g
s
P
−
Δ
⋅
−
−
. (8)This equation provides a formula to compute the impact of mortality selection. One implicit assumption of this equation is that the outcome variable
P
(
μ
,
s
,
g
)
has first derivative with respect to the threshold variable s. Therefore, we use the estimations shown in Table 2, which are based on a continuous famine severity variable, as a basis for our simulation.13 We measureP
(
μ
,
s
,
g
)
in equation (7) with the average disability rate of the cohorts of 1963–1965 who were born after the famine (see Appendix Table C.1).The second term of equation (7) stands for excess mortality rates. Although the Chinese
government has published death and birth rates for the overall population, some scholars have questioned the data quality in the period of famine for two reasons (C. Li 1997; R. Li 2001). First, the year-to-year population changes in the famine period calculated based on the birth rates and death rates do not add up to the published population changes. Second, the total male population declined by exactly 10 million from 1959 to 1960, indicating a sign of data manipulation. Several researchers (Banister 1984; Calot 1985; Coale 1984; Jiang 1986) have tried to reconstruct the death rates and birth rates in the famine years. As shown in Appendix Table C.3, the estimates the researchers developed for death rates showed more pronounced differences from the reported rates than did their estimates for birth rates.
To estimate the mortality rates for men and women, we assumed that the birth rates were the same each year for boys and girls. Because the birth rates by sex are not available, we used the following formula to test the validity of our assumption:
t b t ft mt ft mt ft ft mt mt ft mt
SR
SR
N
N
B
B
N
B
N
B
b
b
=
⎟
⎟
⎠
⎞
⎜
⎜
⎝
⎛
⎟
⎟
⎠
⎞
⎜
⎜
⎝
⎛
=
⎟
⎟
⎠
⎞
⎜
⎜
⎝
⎛
⎟⎟
⎠
⎞
⎜⎜
⎝
⎛
=
, (9)where the subscripts m and f stand for “male” and “female,” respectively; the birth rates bmt and bft are defined as the proportion of boys and girls born at year t in the total male and female populations at year t.
b t
SR
is the sex ratio at birth, andSR
t refers to the sex ratio for the entire population at time t. Appendix Table C.4 lists the sex ratios (SR
t) and the ratio of birth rates ( mtft
b
b ). The ratio of birth rates is slightly
greater than 1 and is rather stable over the period 1956-1965, suggesting that the difference between male and female birth rates is muted, even in the time of famine. This justifies our assumption of identical birth rates for men and women.14
Having derived the birth rates, we calculated the number of new births for boys and girls based on the total female and male populations, which are available from China Population Statistical Yearbook
13 For simplicity here, we report only the results of the outcome variable of disability rate. The results for the illiteracy rate are similar.
14 We used the assumption mainly for simplicity. We also adjusted the birth rates according to the last column in Appendix Table C.2, and the main results remained the same.
22
(NBS 1994). Next, we computed the number deaths among both sexes at year t by subtracting the changes in the male and female populations from year t – 1 to t from new male and female births at year t. Then we calculated mortality rates for men and women as the share of male and female deaths in the total male and female populations (see Appendix Table C.3). We defined the change in mortality rate from the famine years of 1959–1961 to the two normal years of 1956 and 1957 to measure the second term in equation (5). The total observed gender difference in the famine effect is 0.162 × 4.20 × 10 = 6.802, where 4.20 is the average value of the famine severity variable in the famine period. Because the
disability rate is measured as the number of disabled per 10,000 people in the regressions and the famine severity variable is defined as the percentage change, we times a factor of 10 to make it comparable with the unit of excess mortality and disability rates (‰).
Table 6 shows the excess mortality rates, the mortality selection bias, and the contribution of that bias to the total observed gender difference based on five different sources. The last row of Table 6 presents the share of contribution related to mortality selection in total observed gender difference in famine effect. The five simulations based on different birth and death rates provide rather consistent results of about 70 percent. In summary, taking the gender difference in mortality selection into account causes more than two-thirds of the observed gender difference in famine effect to vanish.
Table 6. Contribution of mortality selection to observed gender difference in famine effects
NBS
(1994) (1984) Coale Banister (1984) (1985) Calot (1986) Jiang Excess mortality (‰)
Men 17.38 13.77 13.18 13.95 18.11
Women 12.47 9.04 8.49 9.22 13.25
Estimation bias caused by mortality selection (‰)
Men -17.24 -13.66 -13.08 -13.85 -17.96
Women -12.41 -9.00 -8.45 -9.18 -13.18
Gender difference in estimation bias (‰)
(difference between above two rows) 4.83 4.67 4.63 4.67 4.78
Percentage of mortality selection bias in observed
gender difference (%) 71.0 68.6 68.0 68.6 70.3
Notes: The excess mortality rate is defined as the difference between death rates in the famine years (1959-1961) and normal years (1957-1958). The calculated male and female death rates are listed in Appendix Table C.3. The estimation bias resulting from mortality selection is calculated based on equation (5). The female and male disability rates are the average of the famine-free cohorts of 1963-1965 in Appendix Table C.1. The total observed gender difference is 6.80 (0.162*the average value of the famine severity in the famine period).
23
7. CONCLUSION
Using data from different sources, we found strong evidence that exposure in utero to famine increases the likelihood of disability and illiteracy for rural adult women. Exposure to severe famine at the prenatal and infancy stages has a gender-specific relationship to disability and illiteracy in adulthood. The long-term health impact on men is less pronounced than on women. During the famine period, women have lower age-specific mortality rates than do men. Male fetuses are more likely to miscarry than female fetuses exposed to the same shocks. Female fetuses and infants may be more adaptive to the environment of malnutrition than their male counterparts. Thus, when environmental changes occur later—that is, food becomes more abundant—the benefit of adapting to hunger may turn into a hindrance, causing a higher likelihood of bad health for women. In contrast, for male famine victims, the penalty of maladaptation is death. Because of this higher attrition rate, it is hard to observe the negative health impact for men exposed to famine in early life. We developed a novel approach to estimate the degree of underestimation of famine effect as a result of mortality selection and show that it accounts for about 70 percent of the observed gender difference in famine effect. This helps explain why the literature in general tends to find more significant long-term health effects of famine and other shocks for men than for women. In sum, the Barker hypothesis applies more to women, who are more likely to survive than men, while the Darwinian process is more relevant for men when a severe shock, such as famine, strikes.
Traditionally, mortality is considered a cost of famine. However, negative health impacts on famine survivors indicate that mortality alone underestimates the true cost. Famine and malnutrition have been plaguing many developing countries. One key target of the Millennium Development Goals is to halve hunger and malnutrition by 2015. As the developing world strives to achieve that goal in the next few decades, the negative effect of malnutrition in early life on health in adulthood may increase along with the nutritional transition. It is therefore imperative to identify and quantify the prenatal and postnatal determinants of adverse adult health outcomes. Such a link is also crucial to understanding the “external” consequence of nutritional neglect of women (Osmani and Sen 2003), because such neglect results in a pattern linking maternal undernourishment to adult diseases. Our study contributes to a better
understanding of this link by using a heterogeneous sample in a large developing country that suffered the largest famine in human history and has since experienced one of the fastest economic transformations.
Some limitations of our study should be noted. First, we cannot strictly distinguish prenatal (that is, at various trimesters during pregnancy) and postnatal impacts of famine. This is partially a result of a lack of data on the length of the Chinese Great Famine. The negative impact of early exposure to famine on health in adulthood may depend on the timing of exposure. Second, at the time of the 2000 China population census, the famine cohort was aged 39 to 41. The full impact of famines may not present itself until later. A future research agenda would continue to follow famine cohorts and examine their well-being, using a more comprehensive set of variables.
24
APPENDIX A: DATA SOURCES
2000 China population census was conducted in late 2000. The published CD of the census contains
detailed demographic information by cohort and province. We calculated the disability rate by age cohort and gender for each province using data from the CD.
1% sample of the 1990 China population census data was downloaded from the Texas A&M
University China Archive at
http://chinaarchive.tamu.edu/portal/site/chinaarchive/menuitem.feaa43fe8cebf1a7140eadb4f00011ca/.
1998 China agricultural census determined the total number of working months among the
Chinese population in the one-year period before the census. The data on the proportion of the population that was unemployed throughout the period by age cohort and gender were tabulated by Fred Gale of Economic Research Services at the United States Department of Agriculture, based on a 1 percent sample of the China agricultural census.
25
APPENDIX B: PROOF OF FOUR PROPOSITIONS
Proof of Proposition 1
Assume
s
≤
g
<
μ
,
with property (iii), we have(
;
)
(
;
)
<
0
.
∂
∂
≤
∂
∂
μ
μ
μ
μ
F
s
g
F
.
0
)]
;
(
1
[
)]
;
(
)
;
(
[
)
;
(
)]
;
(
1
[
)
;
(
)]
;
(
1
[
)
;
(
)]
;
(
1
[
)
,
,
(
2 2<
−
−
∂
∂
≤
−
∂
∂
−
−
∂
∂
−
=
∂
∂
μ
μ
μ
μ
μ
μ
μ
μ
μ
μ
μ
μ
μ
μ
s
F
s
F
g
F
s
F
s
F
s
F
g
F
g
F
s
F
g
s
P
The distribution effect of famine on the proportion of survivors in poor health is positive (
P
( , , )
s g d
0
dh
μ
μ
μ
∂
>
∂
), leading to worse health in the population. Proof of Proposition 20
)]
;
(
1
[
)
;
(
)
1
)
;
(
(
)
,
,
(
2<
−
∂
∂
−
=
∂
∂
μ
μ
μ
μ
s
F
s
s
F
g
F
s
g
s
P
.So the selection effect of famine on the proportion of survivors in poor health is negative (
(
,
,
)
<
0
∂
∂
dh
ds
s
g
s
P
μ
), leading to improved health of the surviving population.
Proof of Proposition 3 Given
(
,
,
)
<
0
∂
∂
s
g
s
P
μ
, we can compute the long-term health effect as a result of a shift in survival threshold (∆s) as follows:
)
;
(
1
)
;
(
)
;
(
1
1
)
;
(
)
,
,
(
μ
μ
μ
μ
μ
s
F
s
F
s
F
g
F
g
s
P
−
Δ
⋅
−
−
=
Δ
=)
;
(
1
)
;
(
))
,
,
(
1
(
μ
μ
μ
s
F
s
F
g
s
P
−
Δ
⋅
−
−
. (10)The first term on the right side of equation (10) represents the proportion of healthy population. The second term stands for the change in mortality rate in the famine years from normal years, so-called excess mortality rate.