Wage Structures in the Private and
Public Sectors in West Germany
CHRISTIAN DUSTMANN and ARTHUR VAN SOEST*
Abstract
In this paper, we investigate pay structures in the private and public sectors for West Germany. We commence by describing some basic features of the public sector. We use micro-data from the German Socio-Economic Panel for the years 1984–93 to analyse developments and differences in public and private sector wage distributions for both males and females. We break wages down into different education groups and age-groups, and use regressions to construct conditional wage differentials. Our results differ in many aspects from findings for the UK. For instance, we find that although mean wages are higher in the public sector for both males and females, conditional wages are higher in the private sector for all education groups for males, but higher in the public sector for females.
JEL classification: J3.
I. INTRODUCTION
Germany has a long history as an active state that monopolises a variety of functions and services. The Prussian state had, for instance, a primary role in the development of many important prerequisites for a modern industrial society, such as railways and other infrastructure.1 The highly developed public sector played a vital role in the process of economic and political reconstruction of West Germany after the war. In post-war Germany, employment in the public sector increased steadily from 1950 to the early 1980s, and remained stable after that. This is in *
Christian Dustmann is at University College London and the Institute for Fiscal Studies. Arthur van Soest is at Tilburg University.
The authors are grateful to two anonymous referees for useful comments. Research of the second author is made possible by a fellowship of the Netherlands Royal Academy of Arts and Sciences (KNAW).
sharp contrast to the UK, where public sector employment has decreased substantially over the last decade (see Disney et al. (1997)). Furthermore, the public sector in Germany has so far not experienced the substantial reforms in pay mechanisms and exposure to market forces that have taken place in the UK. Although privatisation of some components of the public sector has started recently (railways, telecommunication and postal services), it is unlikely that this will reach the extent of the UK in the near future.
One reason for this lack of reforms may be that pay advantages for public sector employees have been more substantial in the UK than in Germany, and that, from the outset, public sector wage determination was linked to market forces more than in Britain. By investigating the development of wage structures over one decade, and comparing it to results found in UK studies, we shed some light on this issue. We use micro-data to analyse pay differentials between the private and the public sector for West Germany over the period 1984 to 1993.
The existing literature on conditions and wage distributions in the public and the private sector is predominantly based on a single cross-section, and thus does not allow for an analysis or comparison of the developments in the two sectors over time.2 Some recent studies are based on panel data, and provide a more dynamic picture of private–public sector pay: Pedersen et al. (1990) analyse data for Denmark, and Elliott and Duffus (1996) and Disney et al. (1997) do so for the UK. But to date no analysis exists for Germany.
Many features of the public sector, such as employment conditions, wage determination and recruitment, are quite particular to Germany. To put our analysis in context, we therefore commence with a brief description of features of the public sector in Germany and some developments over the last decades (Section II). We then discuss and describe the data that we use for our analysis (Section III). In Section IV, we investigate the wage evolution in the two sectors over a period of 10 years (1984 to 1993). We distinguish between males and females, and we consider wage differentials for different education groups and age-groups. In Section V, we estimate wage regressions for both sectors, and compute conditional wage differentials in the two sectors for three different education groups. Some of our results differ quite substantially from recent findings for the UK.
2Examples of such studies are Smith (1976) and Belman and Heywood (1989) for the US, Brunello and Rizzi
(1993) for Italy, Hartog and Oosterbeek (1993) for the Netherlands, Zweimüller and Winter-Ebmer (1994) for Austria, Bender and Elliot (1996) for Britain and Dustmann and van Soest (1997) for Germany. Brunello and Dustmann (1996) compare wage structures between Germany and Italy. Studies for developing countries, where the public sector is often even more substantial, include Gindling (1991) for Costa Rica, Terrell (1993) for Haiti and Van der Gaag and Vijverberg (1988) for Ivory Coast.
II. THE PUBLIC SECTOR IN GERMANY
1. Public Sector Employment: Some Numbers
Public sector employment in Germany has risen from 2.2 million in 1950 to 2.9 million in 1960 to 4.6 million in the early 1980s to 4.97 million in 1992 for West Germany and to 6.7 million for Germany as a whole.3 The most rapid expansion of the public sector took place in the 1960s and 1970s. This was mainly induced by an extension of the welfare state and the corresponding expansion of social, educational and medical services (see Becker (1987)).
Accordingly, the public sector plays a significant role as an employer. In 1990, one out of five individuals in dependent employment was working in the public sector, and this ratio has been stable until recently. It fell slightly below 20 per cent as a result of the privatisation of the railways in 1994, and below 18 per cent as a result of the privatisation of telecommunication services and mail services in 1995.
Public sector employment occurs at different levels: the central government, state (Länder) and local authorities (Gemeinden), and financial and non-financial public enterprises. In 1990, 77 per cent of all public employees were employed in administrative jobs at government, state or local authority level. Of these, 9.4 per cent were employed by the federal government, 54.2 per cent by the states and 36.4 per cent by local authorities. The remaining 23 per cent of all public employees occupied jobs in the railway and mail services (80 per cent) and in state-dependent public enterprises and charity organisations. Of those employed in administrative jobs, 32 per cent worked in the educational sector (62 per cent in school education and 38 per cent at universities and polytechnics) and 12 per cent in the health sector.
The number of part-time occupations in the public sector in West Germany increased quite substantially during the 1980s. As a share of all public sector jobs, the number of part-time jobs increased from 11 per cent to 18 per cent between 1972 and 1992. The largest fraction of these newly generated part-time jobs are occupied by females, whose part-time employment increased from 20 per cent in 1960 to 26 per cent in 1972, and to 37 per cent in 1992. At the same time, the ratio of female workers employed in the public sector increased from 28 per cent in 1960 to 35 per cent in 1972, and to 42 per cent in 1992. In 1990, female employees held 87 per cent of all part-time occupations. In 1990, 82 per cent of all female employees in the public sector were employed by the states and the local authorities. This contrasts with 67 per cent for males.
Most part-time employees work in the educational sector (about 56 per cent), and here predominantly in school education (37 per cent of all part-time 3
The numbers we report in this section are based on various issues of Wirtschaft und Statistik, a monthly publication of the German Statistical Institute (Statistisches Bundesamt).
employees), in various administrative jobs (19 per cent) and in the health sector (about 14 per cent).
The public sector in Germany distinguishes between two types of employees — civil servants proper (Beamte) and both blue-collar (Arbeiter) and white-collar (Angestellte) public sector employees. The creation of the status of civil servants goes back to Prussia in 1794. A number of regulations were subsequently introduced to define the status of the civil servant in other German states and cities. Civil servants have a special relation with their employer, the state, which is based on a principle of mutual obligations and loyalty. Employment as a civil servant is usually based on a lifetime contract, and it includes a guaranteed pension. The duties carried out by civil servants include responsibilities attached to sovereignty (defence, police force, law and order). The employment relations of civil servants are nowadays regulated in the Deutsche Beamtengesetz from 1953. Civil servants are excluded from collective bargaining. In 1990, civil servants accounted for about 41.5 per cent of all state employees. They are therefore the largest group of employees in the public sector, followed by white-collar employees (35.1 per cent) and blue-collar employees (23.4 per cent).
The latter two groups (to which we will refer as ‘other public sector employees’) have the right to negotiate wages, and their working contracts may well be temporary. In practice, the type of work done by civil servants and other public sector employees is not very different, except for some special jobs reserved for civil servants only. Pay scales of other public sector employees are the same as those of civil servants (see below). Accordingly, Germany has a dual organisation of public employment. While the rights of civil servants are regulated by law (Bundesbeamtengesetz), the rights of other state employees are regulated by negotiated agreements between unions and employer organisations, as in the private sector.
2. Pay
The pay system for all public sector employees in Germany is uniform and centralised. It is regulated in the Bundesbesoldungsgesetz from 1975. The base salary is determined for four different career groups (Laufbahngruppen). Career groups are categorised by letters A, B, C and R. Every career group is divided into pay scales, which refer to different levels of employment (Besoldungsgruppen) — basic, middle, higher and executive employees (einfacher, mittlerer, gehobener
and höherer Dienst). For example, group A is divided into 16 scales, with A1–A4 referring to basic, A5–A8 to middle, A9–A12 to higher and A13–A16 to executive positions. Depending on their qualifications, employees may enter this pyramid at different levels. For instance, executive positions require a university degree, and usually also special training, while middle positions require a basic school degree and vocational training.
Within every scale, the salary varies according to seniority (Dienstalter). Seniority is calculated as the time after age 21. Should the individual enter the public sector later than that age, then only part of the time between entering the service and reaching age 22 is accounted for in the basic salary. Certain services before entering employment, such as national service, are accounted for (see Verbockett (1986)).
Salaries increase horizontally, based upon seniority, as well as vertically, by moving up to a higher pay scale. Only a certain percentage of those in pay scale i
may move up to pay scale i+1. While the horizontal increases in salary are more or less mechanical, the vertical increase, i.e. the change from one pay scale to another, is based upon achievements, as well as training qualifications. Apart from climbing the scale ladder inside a given career group, it is also possible to change between career groups. However, these changes are not very common, since each main group has quite specific educational and entrance requirements.
On top of the basic salary, public employees may receive additional allowances. These allowances are meant to compensate for special positions (such as temporary employment abroad) and achievements. They may be paid only temporarily, i.e. as long as the special situation persists, or permanently.
Public and private sector workers face the same income tax rules. Moreover, the social security contributions of other public sector employees are the same as those in the private sector. But there is a major difference with civil servants in this respect: civil servants have their own social security system, the costs of which are completely borne by their employer. They therefore do not pay social security contributions. As a consequence, their net earnings are, on average, about 13 per cent higher than those of other public sector workers (or private sector workers) with the same gross earnings.
3. Wage Bargaining
It was outlined above that civil servants in Germany are not allowed to negotiate wages. This restriction does not apply to other public sector employees, however. Wage bargaining in Germany is highly centralised, with wage negotiations covering the whole scope of public sector employment. The union that represents other public sector employees bargains with employers who represent the federal level, the state level and the local level. Any percentage increase in wages that is agreed upon applies uniformly to all pay scales and all career groups. Private sector negotiations may or may not precede public sector negotiations. However, results of the first round of negotiations heavily influence results of the later rounds of negotiations. Since private sector unions are more powerful, they usually lead wage negotiations and set the bench-marks for public sector negotiations.4 Although civil servants are not allowed to get actively involved in 4
See Holmlund (1993) and De Fraja (1993) for theoretical models on wage bargaining between the public sector unions and the government.
wage negotiations, their wage increases are strongly linked to the results of wage negotiations of other public sector employees.
4. Recruitment
Recruitment for public sector occupations in Germany is decentralised. Recruitment procedures are often based on examinations. Compared with the private sector, entrance into the public sector is more formalised and based upon educational certificates (see Brinkmann (1976)). As a consequence of the career principle (Laufbahnprinzip) in the public sector, many employees receive special training not only for the occupation as such, but for each different post in their career group (which is usually associated with a different pay scale — see above). Therefore other public sector employees and civil servants receive a large amount of job-specific training. As a consequence, strong ties develop between employee and employer. This makes entrance into the public sector from private sector occupations difficult. Apart from very specific requirements, age regulations also restrict access to civil servant occupations (see Brandes et al. (1988)).
III. DATA AND VARIABLES
We now look at private and public sector employment conditions and wages in more detail. Our analysis draws on data from the yearly German Socio-Economic Panel (SOEP).5 In the first wave (1984), it includes some 6,000 households, of which 4,500 have a head of German nationality. The remaining 1,500 have a head of foreign nationality. Since many public sector jobs are not open to foreign nationals, we concentrate our analysis on the subsample of Germans only. After reunification, the panel was extended to include the Eastern parts of Germany, but we focus here on West Germany only. Due to attrition, the sample size decreases over the years. The average attrition rate per year is less than 7 per cent, which is quite low compared with other household surveys.
In the previous section, we explained that the German system distinguishes between civil servants and other public sector employees. In most of our analysis, we shall group civil servants and other public sector employees together and refer to them as public sector employees. One justification is that pay structures are practically identical for the two groups.
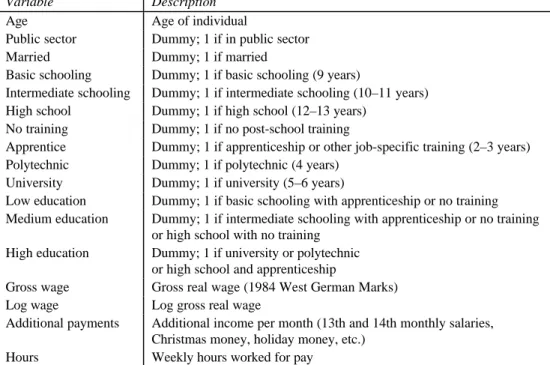
We analyse females and males, and all analyses are performed for these two groups separately. In the sample, we include individuals who are in full-time or part-time employment in the year considered. The survey contains information on monthly gross as well as net earnings. We use gross earnings. Gross hourly wage rates are derived by dividing gross earnings by monthly hours worked. Table A.1 in the Appendix describes the variables we use for our descriptive analyses and in 5More information on the data can be found on the internet: http://www.diw-berlin.de/soep/e.faltblat.html.
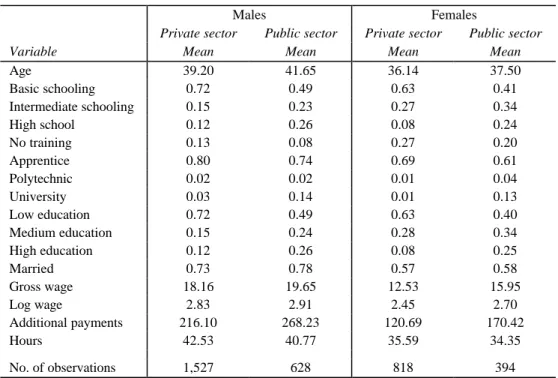
the regressions. Table 1 presents summary statistics for male and female public and private sector employees for 1984.
The education system in Germany, with its dual structure, differs quite substantially from the UK and US systems. Our data contain information on general as well as vocational training. The school system provides education on a basic level (9 years), an intermediate level (10–11 years) and a high-school level (12–13 years). After obtaining any of these degrees, the individual may either join the labour market or enrol in apprenticeship training. Attendance at a polytechnic or a university requires a high-school degree. We classify the information on education and vocational training in seven categories (see Table A.1 for an explanation). For some purposes, we combine these seven categories into three variables — low, medium and high education — where the first is basic schooling with apprenticeship or no training, the second intermediate education with apprenticeship or no training, or high-school education with no training, and the third is a university or polytechnic degree, or high-school education with an apprenticeship.
Table 1 shows that public sector employees are, on average, better educated than private sector employees, and this is true for both males and females. For
TABLE 1
Summary Statistics for 1984
Males Females
Private sector Public sector Private sector Public sector
Variable Mean Mean Mean Mean
Age 39.20 41.65 36.14 37.50 Basic schooling 0.72 0.49 0.63 0.41 Intermediate schooling 0.15 0.23 0.27 0.34 High school 0.12 0.26 0.08 0.24 No training 0.13 0.08 0.27 0.20 Apprentice 0.80 0.74 0.69 0.61 Polytechnic 0.02 0.02 0.01 0.04 University 0.03 0.14 0.01 0.13 Low education 0.72 0.49 0.63 0.40 Medium education 0.15 0.24 0.28 0.34 High education 0.12 0.26 0.08 0.25 Married 0.73 0.78 0.57 0.58 Gross wage 18.16 19.65 12.53 15.95 Log wage 2.83 2.91 2.45 2.70 Additional payments 216.10 268.23 120.69 170.42 Hours 42.53 40.77 35.59 34.35 No. of observations 1,527 628 818 394
instance, only 3 per cent of males in the private sector have a university degree, while this is the case for 14 per cent in the public sector. Public sector employees are also slightly older than private sector employees. These differences in age and education may explain the higher average wages of public sector employees. Additional payments are an important component of the yearly pay in Germany. They include 13th and 14th monthly salaries, holiday and Christmas money and other extra payments. The numbers in Table 1 show that extra payments are higher in the public sector than in the private sector. Finally, Table 1 reveals that public sector employees work fewer hours for pay than private sector employees. For men, the difference is almost two hours per week and mainly reflects different opportunities to work overtime. For women, the difference is somewhat smaller.
IV. WAGE STRUCTURES
Our sample contains information on gross and net monthly earnings, and on the number of hours worked per week during the last month. The wage measure we construct here is gross monthly earnings divided by the number of hours worked per week and divided by 4.3 to give gross hourly earnings. We use the consumer price index to deflate wages to the 1984 level.
As extra payments are a part of the salary, they are included in our wage measure.6 The share of extra payments in the total wage bill increased slightly over the 10-year period we analyse. For males, extra payments as a percentage of total monthly gross earnings increased from 6.5 per cent in 1984 to 7.4 per cent in 1993 for the private sector, and from 7.8 per cent to 8.5 per cent for the public sector. For females, the numbers are very similar: 6.3 per cent in 1984 and 7.0 per cent in 1993 for the private sector, and 7.4 per cent in 1984 and 7.9 per cent in 1993 for the public sector.7
Average log gross real wages for the two sectors over the observation period are plotted in Figure 1. The left-hand panel refers to males and the right-hand one to females. The figures reveal that average public sector wages are higher than private sector wages during the entire 10-year period. This difference is smaller for males than for females. Average wages increase steadily between 1984 and 1993, except between 1988 and 1989 when there was a low increase in the index of negotiated real tariff wages in West Germany (0.8 per cent for blue-collar workers and 0.5 per cent for white-collar workers).
FIGURE 1
Log Gross Real Wage Rates: Public and Private Sector
6
If we use wage measures that do not include these extra payments, our results change only marginally.
Title: 1/2 Dustmann/van Soest
Creator: FreeHand 7.0
CreationDate: 22/09/97 10:22 am
Figure 2 illustrates average individual wage growth. The dip in 1989 is again visible. This graph is based upon individuals who are employed in the same sector in two consecutive waves, while Figure 1 includes those who enter or leave employment or change sector. Since, generally, those who enter the labour market earn less than those who leave the labour market, average wage growth in Figure 1 tends to be smaller than individual wage growth in Figure 2. This also explains why average real wage growth becomes negative in 1988–89 while individual wage growth remains positive. In general, public and private sector wages tend to move in parallel. This reflects the structure of wage negotiations in Germany, where the negotiated results of the large private sector unions are taken as a bench-mark for the public sector (see the discussion in Section II).
On average, individual real wage growth for males is about 3.6 per cent per year in the private sector and 3.5 per cent in the public sector. For females, it is 4.5 per cent in the private sector and 3.8 per cent in the public sector. Thus the wages of female employees in the private sector have grown faster than the wages of male employees in both sectors and than the wages of females in the public
FIGURE 2
Individual Growth Rates for Log Real Wages
Title: 1/2 Dustmann/van Soest
Creator: FreeHand 7.0
sector.
The numbers in Table 1 indicate that public sector employees are slightly older than private sector employees and that they are also better educated. These two factors may account for the positive wage differentials in the graphs. To get a clearer picture, we therefore break down wage developments by age-group and by education level.
Figures 3 and 4 show the development of average log real wages over the decade for four different cohorts, for males and females respectively. Figure 3 indicates that, for men, the average wage in the public sector exceeds that in the private sector for all cohorts except the oldest (men born before 1938). The wage advantage is largest for the post-war generation. For females (Figure 4), all cohorts have higher wages in the public sector, and the difference is much larger than for males, with a slight tendency to increase towards the end of the observation period.
Figure 5 distinguishes between different levels of schooling. Again, the left-hand panel refers to males and the right-left-hand one to females. Holding education
FIGURE 3
Log Gross Wage Rates for Men, by Cohort
Title: 3 Dustmann/van Soest
Creator: FreeHand 7.0
CreationDate: 22/09/97 10:15 am
FIGURE 4
Log Gross Wage Rates for Women, by Cohort
Title: 4 Dustmann/van Soest
Creator: FreeHand 7.0
constant (as defined by the three categories low, medium and high education — see Table A.1 and Table 1), the pattern is quite different from that of the raw differentials in Figure 1. For males, wages in the two sectors are very close to each other for the lowest and the highest education groups, but wages for the intermediate education group are clearly higher in the private sector than in the public sector. Thus it seems that differences in education levels account for the positive raw wage differential between male employees in the public and private sectors. The similar wage movements in the two sectors, already displayed in the raw averages, are sustained for all education categories.
For females, the findings are entirely different. Here, the public sector pays considerably higher wages than the private sector for all education groups. Differences are most pronounced for those with high or low levels of schooling. A common feature for males and females is therefore that the relative wage advantage in the private sector is highest for the intermediate education level. For the intermediate and high education groups, the wage gap for females tends to increase towards the end of the observation period.
To gain a clearer picture of the wage dispersion in each sector and the evolution of the dispersion over time, we calculate the ratios of the 90th to the 10th wage percentile for the public and private sectors for both males and females (Table 2). In 1984, the 90th percentile of the wage distribution for male private
FIGURE 5
Log Gross Wage Rates for Men and for Women, by Education Level
Title: 5 Dustmann/van Soest
Creator: FreeHand 7.0
sector workers was about 2.31 times as large as the 10th percentile. In the public sector, the dispersion is very similar. In both sectors, there is no strong trend over the decade, although it seems that dispersion increases slightly towards the end of the observation period. For females, the numbers are very similar. Again, dispersion seems to increase slightly towards the end of the decade.
This stability in the overall wage dispersion in West Germany during the 1980s and early 1990s has been noted by others (for instance, Gosling (1996), De New and Schmidt (1994) and Steiner and Wagner (1996)). It is interesting to note not only that the dispersion in wages seems to be quite stable, but also that the pattern in the private sector hardly differs from that in the public sector.
These results are in stark contrast to findings for the US and the UK, where the 1980s were characterised by a strong increase in dispersion (see Gosling (1996)). Furthermore, the UK is characterised by quite substantial differences between the two sectors. Based on percentile ratios calculated from data from the British Household Panel Survey (BHPS) for the early 1990s, Disney et al. (1997) conclude that the distribution of wages in the public sector is more equal than that in the private sector for both males and females.
V. WAGE REGRESSIONS
So far, we have presented unconditional wages and wage differentials. We have also illustrated that conclusions based on raw wage differentials change if we break down the sample into education categories. The age structure in the different education groups may also differ, and we have not yet simultaneously controlled for age and education differences. We will do so in this section.
TABLE 2
Ratio of 90th to 10th Wage Percentile
Males Females
Private Public Private Public
1984 2.31 2.28 2.56 2.15 1985 2.50 2.36 2.41 2.44 1986 2.44 2.45 2.29 2.31 1987 2.44 2.52 2.48 2.36 1988 2.41 2.39 2.37 2.34 1989 2.29 2.38 2.45 2.39 1990 2.39 2.36 2.41 2.26 1991 2.38 2.43 2.44 2.40 1992 2.29 2.37 2.42 2.48 1993 2.41 2.40 2.64 2.50
For this purpose, we estimate wage equations. Our analysis is purely descriptive and neglects issues such as sample selection in the two sectors.8 We also refrain from estimating panel data models which take account of individual effects.9
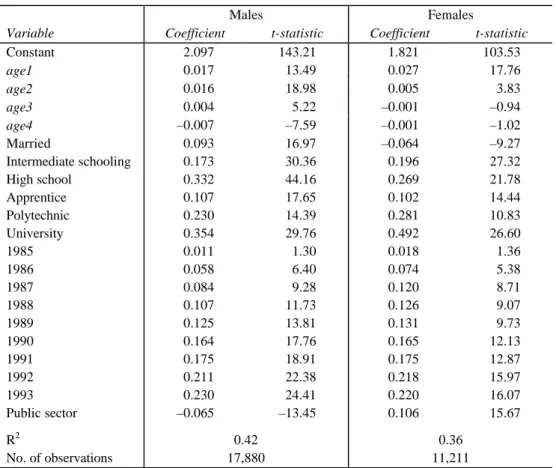
We first estimate pooled regressions for males and females, with a dummy variable for the sector. The specification we use to start with is very simple. The dependent variable is the log of the real gross hourly wage, as defined above. We use a piecewise linear age pattern, with splines from 16 to 30 years of age (age1), 30–40 years of age (age2), 40–50 years of age (age3) and over 50 years of age (age4). We include a series of education dummy variables, referring to both general education and vocational training (see Table A.1 and Table 1), where the default group contains the individuals with the lowest education level — basic school education and no post-school training. We also include a series of year dummies, where 1984 is the base year. Finally, we include a dummy for marital status (1 if married, 0 otherwise).
The results are displayed in Table 3. For males, the estimated coefficient on the public sector dummy is significant and equals –0.065, indicating that, conditional on age, marital status and education, wages in the public sector are about 6.5 per cent lower than wages in the private sector. This result is very different from findings for the UK (see Disney et al. (1997)), where conditional wages in the public sector appear to be about 5 per cent higher than those in the private sector,
ceteris paribus.
For females, on the other hand, we find a significant and substantial advantage to working in the public sector. Here, the estimated coefficient on the public sector dummy equals 0.106. The comparable UK results for females are also positive, but larger: female public sector employees have about 16 per cent higher wages than female private sector employees.
8
Dustmann and van Soest (1997) estimate switching regression models for males, using the first wave of the panel (1984). They estimate various specifications, including models that endogenise education. They find negative differences between average predicted wages in the public and private sectors prior to the sector choice. The differences increase substantially if non-random sector selection is accounted for. Accordingly, their results are even stronger than the results for men reported here.
9Individual heterogeneity renders the estimated coefficients of the wage equations inconsistent if it is correlated with
the other regressors in the model. Fixed effect estimators cure this problem, but identify only coefficients on variables that are time-variant. Our set of regressors almost exclusively includes variables that are time-invariant (such as education) or change systematically over time (such as age). Moreover, the data contain very few transitions from the private to the public sector or vice versa. Therefore we would not be able to estimate the parameters of interest.
Accordingly, our findings indicate that, conditional on education, age and marital status, the relative wage in the public sector compared with the private sector is higher in the UK than in Germany for both males and females. While in West Germany no major reforms of public sector employment have taken place, the UK has experienced substantial reforms in the years prior to 1991, the first year of the UK results we refer to (Disney et al., 1997). Our results suggest that, in West Germany, wages of public sector workers have not been out of line with those in the private sector. Perhaps this is because they have always been linked to bargaining outcomes in the private sector, at least indirectly. Thus, in Germany, the need for reforms to moderate public sector wage growth has been smaller than that in the UK. This may explain why such reforms have not taken place in Germany.
TABLE 3
Wage Regressions
Males Females
Variable Coefficient t-statistic Coefficient t-statistic
Constant 2.097 143.21 1.821 103.53 age1 0.017 13.49 0.027 17.76 age2 0.016 18.98 0.005 3.83 age3 0.004 5.22 –0.001 –0.94 age4 –0.007 –7.59 –0.001 –1.02 Married 0.093 16.97 –0.064 –9.27 Intermediate schooling 0.173 30.36 0.196 27.32 High school 0.332 44.16 0.269 21.78 Apprentice 0.107 17.65 0.102 14.44 Polytechnic 0.230 14.39 0.281 10.83 University 0.354 29.76 0.492 26.60 1985 0.011 1.30 0.018 1.36 1986 0.058 6.40 0.074 5.38 1987 0.084 9.28 0.120 8.71 1988 0.107 11.73 0.126 9.07 1989 0.125 13.81 0.131 9.73 1990 0.164 17.76 0.165 12.13 1991 0.175 18.91 0.175 12.87 1992 0.211 22.38 0.218 15.97 1993 0.230 24.41 0.220 16.07 Public sector –0.065 –13.45 0.106 15.67 R2 0.42 0.36 No. of observations 17,880 11,211 Note: Ordinary least squares estimates; t-statistics are not corrected for random individual effects.
A particular feature of the German public sector is the distinction between civil servants and other public sector employees. The pay systems for both groups are practically identical, and wages of civil servants are linked to negotiated wages of other public sector employees (see discussion above). Still, one may suspect differences in wages between the two groups for various reasons. For instance, selection of civil servants is more formalised and more frequently based on entrance examinations, and their contracts are usually tenured.
To investigate this point, we estimate the above wage equations for public sector workers only, including dummy variables for the status of civil servant and white-collar worker (blue-collar workers are the default group). The results for males indicate that civil servants earn 2.5 per cent higher wages than blue-collar workers, while white-collar workers earn 6.6 per cent higher wages. For females, the differences are larger: civil servants and white-collar workers earn 25 and 29 per cent higher wages than blue-collar workers, respectively. For both genders, civil servants thus seem to earn slightly lower gross wages than other white-collar public sector employees. This apparent disadvantage, however, is likely to be more than outweighed by the fact that social security contributions for civil servants are borne by the employer, by higher job security for civil servants and by other fringe benefits.
We now investigate whether the wage differentials vary across years and across education levels. The returns to age and education may differ between sectors and may vary over the years. We therefore estimate wage regressions separately for the two sectors and for each of the 10 years. For each year, we compare wage predictions for individuals in the public and the private sectors for three different education groups, evaluated at the average age in the sample in the given year. For this purpose, we combine the seven education categories used above into the three groups already described — low, medium and high.
We present the complete estimation results of the wage regressions for the years 1984 and 1993 in Table A.2 in the Appendix. There are some differences, but also some similarities, between the age profiles in the public and the private sectors. In both sectors, wages increase strongly until the age of 30. In 1984, wages of male employees in the age range 16–30 years increase by about 3.7 per cent per year in the private sector and by 4.3 per cent per year in the public sector. In the public sector, wages continue to increase by about 2.4 per cent per year in the age range 30–40, while the increase slows down to 1.7 per cent per year in the private sector. Wages decrease significantly in the private sector after age 40. In the public sector, the profile flattens out but does not turn negative. This could be related to the rather rigid hierarchical pay structure in the public sector, which makes wage decreases difficult (see discussion above). It should be noted, however, that, in this specification, the age pattern reflects a combination of experience, age and cohort effects.
From the results of the wage regressions, it is straightforward to calculate wage differentials between the public and the private sectors for the three education
groups — low, medium and high. Results for 1984 to 1993 are given in Table 4, in which we present point estimates and t-statistics.
For all education levels, the differential between public and private sector wages is negative for males and significant for most years (an exception is the lowest education level in 1993). Wage advantages in the private sector are larger for medium and high education levels than for the lowest education level. There is no clear time trend in these differentials. For the medium and high education levels, the differentials are similar. Again, they remain rather stable over time, though they seem to grow somewhat during the first few years under consideration.
For females, an entirely different picture emerges. Here, wages in the public sector are higher than those in the private sector for all education categories. Furthermore, as in Figure 5, wage advantages are largest in the lowest and highest education categories. In the highest education category, the public–private
TABLE 4
Public–Private Wage Differentials, by Education Level
Low education Medium education High education
Differential t-statistic Differential t-statistic Differential t-statistic Males 1984 –0.048 –2.53 –0.070 –2.32 –0.015 –0.49 1985 –0.038 –1.96 –0.079 –2.55 –0.075 –2.24 1986 –0.061 –2.89 –0.082 –2.56 –0.096 –2.80 1987 –0.096 –4.23 –0.087 –2.61 –0.109 –3.00 1988 –0.044 –2.28 –0.105 –3.60 –0.062 –1.90 1989 –0.062 –3.26 –0.102 –3.71 –0.100 –3.04 1990 –0.059 –3.13 –0.116 –4.07 –0.062 –1.86 1991 –0.055 –2.81 –0.068 –2.35 –0.064 –1.80 1992 –0.031 –1.54 –0.085 –2.88 –0.060 –1.61 1993 0.010 0.49 –0.112 –3.69 –0.061 –1.57 Females 1984 0.136 4.55 0.092 3.08 0.169 5.62 1985 0.084 2.78 0.123 4.07 0.173 5.72 1986 0.099 3.49 0.024 0.84 0.226 7.97 1987 0.100 3.62 0.062 2.26 0.254 9.23 1988 0.137 4.11 0.024 0.73 0.154 4.64 1989 0.070 2.47 0.058 2.03 0.182 6.36 1990 0.081 2.74 0.060 2.04 0.245 8.25 1991 0.122 4.42 0.108 3.93 0.248 8.98 1992 0.125 4.61 0.124 4.58 0.292 10.76 1993 0.121 3.73 0.170 5.22 0.350 10.76
differential ranges from 15 per cent to 35 per cent. Again, there is no clear time trend. Still, the differentials seem to have grown towards the end of the observation period. All these results correspond to the conclusions drawn from Figure 5, in which we controlled for education level and year of observation only.
The large wage advantage of females in the public sector in Germany seems so far to have gone unnoticed. There are several explanations for this finding. It is likely that equal opportunities legislation and equal pay legislation are more easily enforced in the public than in the private sector. It may also be that female public sector employees differ from private sector employees in other aspects, which we do not take explicitly into account in our analysis. For instance, it may be easier to retain the same job after a maternity break in the public sector than in the private sector, so that public sector employees do not lose job-specific human capital. Moreover, it may be easier to change from full-time employment to part-time employment in the public sector. As a consequence, while female private sector employees tend to leave the labour force during maternity, female public sector employees will more often remain employed. These explanations both suggest that, on average, females in the public sector have more job-specific and general human capital than females in the private sector with the same age and education level. Future research should analyse these differences and their causes in more detail.
Compared with UK findings, our results differ both for males and for females. For the UK, Disney et al. (1997) find a wage advantage for highly educated male workers in the private sector, as we do. But, according to the same UK study, male workers with low and medium levels of education receive higher wages in the public sector. The UK results for females also indicate wage premiums in the public sector for most education groups. However, while we find the largest wage advantages for females with a university or polytechnic degree, the wage difference between the sectors for women with a degree in the UK is insignificant.
VI. CONCLUSION
We have examined wage structures in the public and private sectors in West Germany over the period 1984–93. Our empirical analysis is based on data from the SOEP. Our main findings can be summarised as follows. For males and females, unconditional mean wages in the public sector are clearly higher than those in the private sector. This is the case for the entire observation period. The differential, however, is more pronounced for female than for male employees. One reason for these raw differentials could be the higher average age and/or the higher general level of education of public sector employees.
If we break the sample down into different age cohorts, this difference remains, except for the male pre-war cohort, where wages in both sectors are about the same. If we distinguish different education groups, wages for males are very similar in the two sectors for the highest and lowest category. In the intermediate category, they are clearly higher in the private sector. For females, wages are
higher in the public sector, but the difference is smaller in the intermediate education category.
Wages develop almost in parallel in the two sectors, and this is the case for all cohorts and all education groups. Only towards the end of our observation period are there some slight deviations. This reflects the centralised bargaining structure in Germany, where negotiations between the more powerful private sector unions and employers lead negotiations between public sector unions and employers, which then aim for similar agreements to the private sector. The stability in the distribution of wages is reflected by the 90th to 10th percentile ratios. Wage dispersion is remarkably stable in both sectors, and similar for males and females.
Conditional on education, marital status and age, wages are about 6 per cent lower in the public sector for males, but substantially higher for females (about 10 per cent). Allowing for differences in the return to education and age between sectors and over the years, we predict conditional wage differences for three categories of education and training over the 10-year period. For male employees in all education categories, wages are almost always significantly lower in the public sector than in the private sector. Thus there seems to be a wage premium to private sector employment. While our wage measure took into account additional payments, which are higher in the public sector, we have not controlled for other fringe benefits, such as job security, working pattern and access to special insurance and pension contracts. These are more substantial in the public sector, and may compensate workers for the wage disadvantage.
While males do better in the private sector, the opposite is the case for females. Here, all education groups earn higher wages in the public sector, with the largest advantage for those individuals with a university or polytechnic degree. One explanation for these remarkable wage advantages lies in the more regulated character of the public sector, where equal pay legislation may be more powerfully enforced than in the private sector. This wage advantage may explain, to some extent, the substantial increase in the ratio of the number of females to the total number of employees in the public sector.
Our results differ quite substantially from findings for the UK. Most remarkable is the negative, and relatively stable, wage differential for males in West Germany, which can be observed for all years and all education groups. This is in sharp contrast to an overall positive wage differential which has been found for the UK, and which pertains to low and medium education levels if breaking down the sample into different education groups. The UK differentials refer to the period between 1991 and 1994 and occur despite substantial reform efforts in the UK public sector in the 1980s. One conclusion that may be drawn from these results is that one reason Germany witnessed less-intensive reforms of its public sector over the last two decades is its more competitive wage structures. The development of public sector wages is strongly linked to the outcome of negotiations in the private sector.
APPENDIX TABLES
TABLE A.1
Description of Variables
Variable Description
Age Age of individual
Public sector Dummy; 1 if in public sector Married Dummy; 1 if married
Basic schooling Dummy; 1 if basic schooling (9 years)
Intermediate schooling Dummy; 1 if intermediate schooling (10–11 years) High school Dummy; 1 if high school (12–13 years)
No training Dummy; 1 if no post-school training
Apprentice Dummy; 1 if apprenticeship or other job-specific training (2–3 years) Polytechnic Dummy; 1 if polytechnic (4 years)
University Dummy; 1 if university (5–6 years)
Low education Dummy; 1 if basic schooling with apprenticeship or no training Medium education Dummy; 1 if intermediate schooling with apprenticeship or no training
or high school with no training High education Dummy; 1 if university or polytechnic
or high school and apprenticeship
Gross wage Gross real wage (1984 West German Marks) Log wage Log gross real wage
Additional payments Additional income per month (13th and 14th monthly salaries, Christmas money, holiday money, etc.)
TABLE A.2
Wage Regressions
Private Public
Variable Coefficient t-statistic Coefficient t-statistic Males, 1984 Constant 2.038 50.95 1.837 19.52 Medium education 0.179 8.49 0.156 5.40 High education 0.397 17.14 0.429 15.33 age1 0.037 10.16 0.043 5.47 age2 0.017 5.75 0.024 5.12 age3 –0.006 –1.97 0.001 0.12 age4 –0.008 –2.17 0.001 0.36 R2 0.32 0.42 No. of observations 1,527 628 Males, 1993 Constant 2.191 30.91 2.369 21.43 Medium education 0.238 10.05 0.115 4.04 High education 0.526 16.97 0.455 14.46 age1 0.039 6.44 0.022 2.31 age2 0.008 2.27 0.019 3.88 age3 0.009 2.27 0.005 1.12 age4 –0.009 –1.91 –0.006 –1.05 R2 0.32 0.47 No. of observations 1,166 466 Females, 1984 Constant 1.761 34.15 1.724 19.45 Medium education 0.246 8.50 0.202 5.35 High education 0.405 8.38 0.438 10.85 age1 0.037 7.28 0.047 6.15 age2 0.000 0.11 0.013 2.16 age3 –0.005 –1.00 –0.014 –1.98 age4 –0.006 –0.94 0.010 1.00 R2 0.19 0.34 No. of observations 818 394 Females, 1993 Constant 2.241 22.18 2.288 18.32 Medium education 0.186 5.83 0.235 5.79 High education 0.379 6.09 0.608 12.11 age1 0.016 1.81 0.015 1.33 age2 –0.004 –0.81 0.009 1.28 age3 0.004 0.75 0.003 0.51 age4 –0.016 –1.93 –0.005 –0.54 R2 0.09 0.34
No. of observations 736 398
REFERENCES
Becker, R. (1987), Die Rolle des Staates als Arbeitgeber, Diplom-Arbeit, University of Mannheim.
Belman, D. and Heywood, J. S. (1989), ‘Government wage differentials: a sample selection approach’, Applied Economics, vol. 21, pp. 427–38.
Bender, K. A. and Elliot, R. F. (1996), ‘The role of wage structure and sectoral selection in accounting for the public–private sector earnings differential in Britain’, mimeo, University of Aberdeen.
Brandes, W. et al. (1988), Der Staat als Arbeitgeber, Deutsche Forschungsgesellschaft (DFG) Research Report, GH Paderborn University.
Brinkmann, G. (1976), Aufgaben und Qualifikation der Öffentlichen Verwaltung, Göttingen: Otto Schwarz.
Brunello, G. and Dustmann, C. (1996), ‘Public and private sector wages: a comparison between Germany and Italy’, in Comparaisons Internationales de Salaire, Paris: Ministère du travail et des Affaires Sociales, INSEE.
— and Rizzi, D. (1993), ‘Public and private sector wages in Italy: a cross section analysis’, mimeo, University of Venice.
De Fraja, G. (1993), ‘Unions and wages in public and private firms: a game-theoretic analysis’,
Oxford Economic Papers, vol. 45, pp. 457–69.
De New, J. P. and Schmidt, C. M. (1994), ‘The industrial structure of German earnings 1980– 1990’, Allgemeines Statistisches Archiv, vol. 78, pp. 141–59.
Disney, R., Goodman, A., Gosling, A. and Trinder, C. (1997), ‘Wage determination in the public and private sectors’, mimeo, Institute for Fiscal Studies.
Dustmann, C. and van Soest, A. (1997), ‘Public and private sector wages of male workers in Germany’, mimeo, University College London.
Elliott, R. F. and Duffus, K. (1996), ‘What has been happening to pay in the public service sector of the British economy? Developments over the period 1970–1992’, British Journal of Industrial Relations, vol. 34, pp. 192–206.
Gindling, T. H. (1991), ‘Labour market segmentation and the determination of wages in the public, private-formal, and informal sectors in San Jose, Costa Rica’, Economic Development and Cultural Change, vol. 39, pp. 585–605.
Gosling, A. (1996), ‘The changing distribution of wages in the UK and West Germany 1984– 1992’, mimeo, Institute for Fiscal Studies.
Hartog, J. and Oosterbeek, H. (1993), ‘Public and private sector wages in the Netherlands’,
European Economic Review, vol. 37, pp. 97–114.
Holmlund, B. (1993), ‘Wage setting in private and public sectors in a model with endogenous government behaviour’, European Journal of Political Economy, vol. 9, pp. 149–62.
Pedersen, P., Schmidt-Soerensen, J., Smith, N. and Westergaard-Nielsen, N. (1990), ‘Wage differentials between the public and private sectors’, Journal of Public Economics, vol. 41, pp. 125–45.
Schmidt, K. and Rose, R. (1985), ‘Germany: the expansion of an active state’, in R. Rose (ed.),
Smith, S. (1976), ‘Pay differentials between federal government and private sector workers’,
Industrial and Labour Relations Review, vol. 29, pp. 233–57.
Steiner, V. and Wagner, K. (1996), ‘Has earnings inequality in Germany changed in the 1980’s?’, ZEW, Mannheim, Discussion Paper no. 96-32.
Terrell, K. (1993), ‘Public–private wage differentials in Haiti’, Journal of Development Economics, vol. 42, pp. 293–314.
Van der Gaag, J. and Vijverberg, W. (1988), ‘A switching regression model for wage determinants in the public and private sectors of a developing country’, Review of Economics and Statistics, vol. 70, pp. 244–52.
Verbockett, H. W. (1986), Eine Modellrechnung über die künftige Entwicklung von Zahl und Struktur der im Ruhegehalstempfänger im öffentlichen Dienst und ihre finanzielle Bedeutung, dissertation, Johan Wolfgang Goethe University, Frankfurt.
Zweimüller, J. and Winter-Ebmer, R. (1994), ‘Gender wage differentials in private and public sector jobs’, Journal of Population Economics, vol. 7, pp. 271–85.